Guest, Sign inJoin
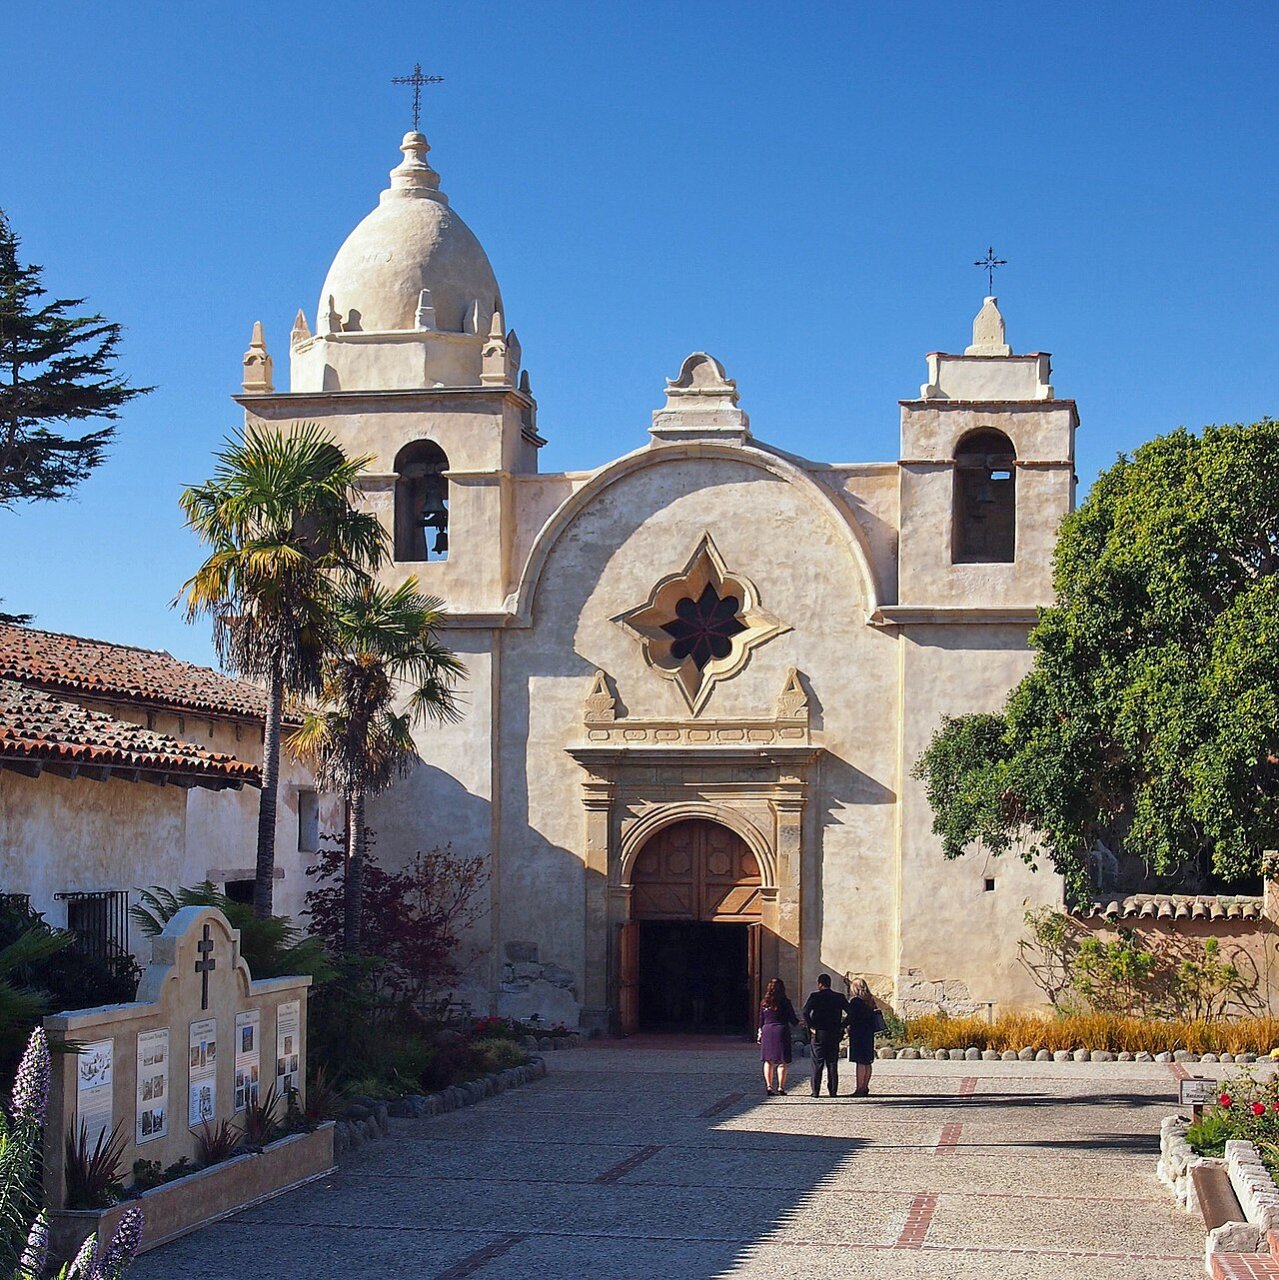
Carmel Mission ChurchCarmel-by-the-Sea, #1 on this list · Photo: McGhiever · CC BY-SA 4.0
California rankings · Civic life

Towns with the most civic life in California

Carmel-by-the-Sea ranks first on civic life among California’s 448 towns of 2,500+; 80 of the 448 grade A− or better on civic life nationally.

The Civic life grade, a character grade (not part of the overall): library visits per resident (IMLS), community nonprofits (IRS) and volunteering groups. How grades work

#1

Carmel-by-the-Sea

Monterey County · 3,105 people
A+

Civic life grade, among the top in the U.S.·Overall A− · #33 of 841 in CA

#2

Sebastopol

Sonoma County · 7,532 people
A+

Civic life grade, among the top in the U.S.·Overall C+ · #321 of 841 in CA

All 448 towns

Civic life grade, best first (the letter is national). Towns with the same score share a rank (T = tied; 2 towns here); the overall grade and state rank are beside each.

448 towns ranked. Not here? See why a town may be missing.

#TownGradeOverall
1Carmel-by-the-SeaMonterey County · 3,105 peopleA+among the top in the U.S.·Overall A− · #33 of 841
2SebastopolSonoma County · 7,532 peopleA+among the top in the U.S.·Overall C+ · #321 of 841
3Mount ShastaSiskiyou County · 3,071 peopleA+among the top in the U.S.·Overall C− · #493 of 841
4Sutter CreekAmador County · 2,701 peopleA+among the top in the U.S.·Overall C · #428 of 841
5YrekaSiskiyou County · 7,714 peopleA+among the top in the U.S.·Overall D− · #804 of 841
6FairfaxMarin County · 7,417 peopleA+among the top in the U.S.·Overall B+ · #81 of 841
7JacksonAmador County · 5,100 peopleA+among the top in the U.S.·Overall C− · #456 of 841
8ParadiseButte County · 10,023 peopleA+among the top in the U.S.·Overall D · #642 of 841
9Nevada CityNevada County · 3,174 peopleA+among the top in the U.S.·Overall C+ · #330 of 841
10Grass ValleyNevada County · 14,035 peopleA+better than 98% of U.S. towns·Overall D · #638 of 841
11ArcataHumboldt County · 19,047 peopleA+better than 98% of U.S. towns·Overall C− · #466 of 841
12OjaiVentura County · 7,474 peopleA+better than 98% of U.S. towns·Overall C+ · #269 of 841
13WeedSiskiyou County · 2,603 peopleA+better than 97% of U.S. towns·Overall D · #686 of 841
14TruckeeNevada County · 17,278 peopleA+better than 97% of U.S. towns·Overall B− · #210 of 841
15Morro BaySan Luis Obispo County · 10,613 peopleA+better than 97% of U.S. towns·Overall B− · #200 of 841
16SausalitoMarin County · 7,019 peopleA+better than 96% of U.S. towns·Overall B+ · #110 of 841
17Mill ValleyMarin County · 13,799 peopleA+better than 96% of U.S. towns·Overall A · #20 of 841
18BerkeleyAlameda County · 121,911 peopleA+better than 96% of U.S. towns·Overall B− · #182 of 841
19TiburonMarin County · 8,881 peopleA+better than 95% of U.S. towns·Overall A · #11 of 841
20TehachapiKern County · 11,852 peopleAbetter than 95% of U.S. towns·Overall D− · #782 of 841
21SonoraTuolumne County · 4,866 peopleAbetter than 95% of U.S. towns·Overall D · #687 of 841
22LakeportLake County · 5,059 peopleAbetter than 94% of U.S. towns·Overall D− · #730 of 841
23Santa CruzSanta Cruz County · 61,797 peopleAbetter than 94% of U.S. towns·Overall C+ · #291 of 841
24Scotts ValleySanta Cruz County · 11,652 peopleAbetter than 94% of U.S. towns·Overall B+ · #104 of 841
25MontereyMonterey County · 28,953 peopleAbetter than 93% of U.S. towns·Overall C · #352 of 841
26WillitsMendocino County · 4,760 peopleAbetter than 93% of U.S. towns·Overall D− · #744 of 841
27EurekaHumboldt County · 25,304 peopleAbetter than 93% of U.S. towns·Overall D− · #769 of 841
28PetalumaSonoma County · 59,688 peopleAbetter than 92% of U.S. towns·Overall B− · #181 of 841
29San Luis ObispoSan Luis Obispo County · 50,636 peopleAbetter than 92% of U.S. towns·Overall C+ · #290 of 841
30Arroyo GrandeSan Luis Obispo County · 18,123 peopleAbetter than 91% of U.S. towns·Overall B · #149 of 841
31ReddingShasta County · 94,092 peopleAbetter than 91% of U.S. towns·Overall C · #425 of 841
32Fort BraggMendocino County · 6,946 peopleAbetter than 91% of U.S. towns·Overall D− · #808 of 841
33Pismo BeachSan Luis Obispo County · 7,911 peopleAbetter than 90% of U.S. towns·Overall C · #343 of 841
34Half Moon BaySan Mateo County · 11,287 peopleAbetter than 89% of U.S. towns·Overall B · #140 of 841
35AngelsCalaveras County · 3,735 peopleAbetter than 89% of U.S. towns·Overall D · #567 of 841
36LafayetteContra Costa County · 25,313 peopleAbetter than 89% of U.S. towns·Overall A · #18 of 841
37Pacific GroveMonterey County · 14,659 peopleAbetter than 89% of U.S. towns·Overall A− · #62 of 841
38San AnselmoMarin County · 12,555 peopleAbetter than 89% of U.S. towns·Overall A− · #49 of 841
39DavisYolo County · 66,110 peopleAbetter than 88% of U.S. towns·Overall B · #130 of 841
40OrindaContra Costa County · 19,507 peopleAbetter than 88% of U.S. towns·Overall A · #3 of 841
41HealdsburgSonoma County · 11,172 peopleAbetter than 87% of U.S. towns·Overall C · #413 of 841
42San MarinoLos Angeles County · 11,964 peopleAbetter than 87% of U.S. towns·Overall A− · #46 of 841
43Palo AltoSanta Clara County · 67,609 peopleAbetter than 87% of U.S. towns·Overall B+ · #112 of 841
44CapitolaSanta Cruz County · 9,340 peopleAbetter than 87% of U.S. towns·Overall C+ · #305 of 841
45OrlandGlenn County · 8,381 peopleAbetter than 87% of U.S. towns·Overall D · #639 of 841
46ClaremontLos Angeles County · 35,838 peopleAbetter than 86% of U.S. towns·Overall B− · #185 of 841
47MoragaContra Costa County · 16,322 peopleAbetter than 86% of U.S. towns·Overall A · #8 of 841
48AtascaderoSan Luis Obispo County · 29,464 peopleAbetter than 86% of U.S. towns·Overall C+ · #278 of 841
49El SegundoLos Angeles County · 16,379 peopleAbetter than 85% of U.S. towns·Overall B− · #199 of 841
50AlbanyAlameda County · 19,195 peopleA−better than 85% of U.S. towns·Overall B+ · #91 of 841
51CoronadoSan Diego County · 21,094 peopleA−better than 84% of U.S. towns·Overall B− · #178 of 841
52El CerritoContra Costa County · 26,121 peopleA−better than 84% of U.S. towns·Overall C · #434 of 841
53Beverly HillsLos Angeles County · 30,764 peopleA−better than 84% of U.S. towns·Overall C+ · #261 of 841
54West HollywoodLos Angeles County · 34,231 peopleA−better than 84% of U.S. towns·Overall C− · #494 of 841
55MalibuLos Angeles County · 9,574 peopleA−better than 83% of U.S. towns·Overall C+ · #318 of 841
56Sierra MadreLos Angeles County · 10,620 peopleA−better than 83% of U.S. towns·Overall B+ · #103 of 841
57PlacervilleEl Dorado County · 10,685 peopleA−better than 83% of U.S. towns·Overall C · #398 of 841
58Laguna BeachOrange County · 22,391 peopleA−better than 83% of U.S. towns·Overall B+ · #86 of 841
59ChicoButte County · 105,081 peopleA−better than 82% of U.S. towns·Overall C− · #478 of 841
60La Cañada FlintridgeLos Angeles County · 19,480 peopleA−better than 82% of U.S. towns·Overall A− · #64 of 841
61Corte MaderaMarin County · 9,929 peopleA−better than 81% of U.S. towns·Overall A · #12 of 841
62OaklandAlameda County · 440,838 peopleA−better than 80% of U.S. towns·Overall D · #604 of 841
63Los GatosSanta Clara County · 32,576 peopleA−better than 80% of U.S. towns·Overall A− · #50 of 841
64South PasadenaLos Angeles County · 25,503 peopleA−better than 80% of U.S. towns·Overall B · #120 of 841
65Portola ValleySan Mateo County · 4,292 peopleA−better than 80% of U.S. towns·Overall A− · #57 of 841
66AvalonLos Angeles County · 3,237 peopleA−better than 79% of U.S. towns·Overall C− · #542 of 841
67Solana BeachSan Diego County · 12,602 peopleA−better than 78% of U.S. towns·Overall A · #23 of 841
68St. HelenaNapa County · 5,194 peopleA−better than 78% of U.S. towns·Overall B+ · #106 of 841
69BurlingameSan Mateo County · 31,929 peopleA−better than 78% of U.S. towns·Overall B+ · #108 of 841
70WillowsGlenn County · 6,116 peopleA−better than 78% of U.S. towns·Overall D− · #734 of 841
71ColusaColusa County · 6,519 peopleA−better than 77% of U.S. towns·Overall D · #621 of 841
72Red BluffTehama County · 14,404 peopleA−better than 76% of U.S. towns·Overall D− · #832 of 841
73Del MarSan Diego County · 3,858 peopleA−better than 76% of U.S. towns·Overall A− · #45 of 841
74LarkspurMarin County · 12,620 peopleA−better than 76% of U.S. towns·Overall A− · #31 of 841
75Agoura HillsLos Angeles County · 19,243 peopleA−better than 76% of U.S. towns·Overall B+ · #101 of 841
76BishopInyo County · 3,696 peopleA−better than 76% of U.S. towns·Overall C− · #470 of 841
77AlturasModoc County · 2,634 peopleA−better than 76% of U.S. towns·Overall D · #614 of 841
78San FranciscoSan Francisco County · 826,079 peopleA−better than 76% of U.S. towns·Overall C+ · #308 of 841
79San CarlosSan Mateo County · 29,261 peopleA−better than 76% of U.S. towns·Overall A · #4 of 841
80BeniciaSolano County · 26,401 peopleA−better than 75% of U.S. towns·Overall B · #124 of 841
81WintersYolo County · 8,214 peopleB+better than 74% of U.S. towns·Overall B · #156 of 841
82SusanvilleLassen County · 12,816 peopleB+better than 73% of U.S. towns·Overall D · #637 of 841
83EncinitasSan Diego County · 60,736 peopleB+better than 73% of U.S. towns·Overall A− · #40 of 841
84SaratogaSanta Clara County · 30,418 peopleB+better than 73% of U.S. towns·Overall A · #2 of 841
85NovatoMarin County · 51,947 peopleB+better than 73% of U.S. towns·Overall B− · #236 of 841
86LoomisPlacer County · 7,004 peopleB+better than 72% of U.S. towns·Overall B · #123 of 841
87Menlo ParkSan Mateo County · 32,713 peopleB+better than 72% of U.S. towns·Overall B+ · #109 of 841
88Los AltosSanta Clara County · 30,965 peopleB+better than 71% of U.S. towns·Overall A · #10 of 841
89MarinaMonterey County · 23,256 peopleB+better than 71% of U.S. towns·Overall C− · #497 of 841
90Villa ParkOrange County · 5,645 peopleB+better than 70% of U.S. towns·Overall A− · #38 of 841
91Newport BeachOrange County · 81,977 peopleB+better than 69% of U.S. towns·Overall B · #144 of 841
92FortunaHumboldt County · 12,003 peopleB+better than 69% of U.S. towns·Overall D · #674 of 841
93Santa MonicaLos Angeles County · 90,082 peopleB+better than 68% of U.S. towns·Overall C+ · #266 of 841
94CalabasasLos Angeles County · 22,027 peopleB+better than 68% of U.S. towns·Overall B · #145 of 841
95BrisbaneSan Mateo County · 4,656 peopleB+better than 68% of U.S. towns·Overall B− · #180 of 841
96WoodsideSan Mateo County · 5,181 peopleB+better than 67% of U.S. towns·Overall A− · #35 of 841
97Santa RosaSonoma County · 179,437 peopleB+better than 67% of U.S. towns·Overall C · #447 of 841
98EmeryvilleAlameda County · 13,251 peopleB+better than 66% of U.S. towns·Overall D · #549 of 841
99AlamedaAlameda County · 76,876 peopleB+better than 66% of U.S. towns·Overall B− · #221 of 841
100Palos Verdes EstatesLos Angeles County · 12,559 peopleB+better than 66% of U.S. towns·Overall A− · #24 of 841
101Signal HillLos Angeles County · 11,153 peopleB+better than 66% of U.S. towns·Overall C · #441 of 841
102Culver CityLos Angeles County · 39,452 peopleB+better than 66% of U.S. towns·Overall C+ · #272 of 841
103Hermosa BeachLos Angeles County · 18,513 peopleB+better than 66% of U.S. towns·Overall B · #129 of 841
104Walnut CreekContra Costa County · 70,012 peopleB+better than 66% of U.S. towns·Overall B− · #223 of 841
105Rolling Hills EstatesLos Angeles County · 7,948 peopleB+better than 65% of U.S. towns·Overall B+ · #107 of 841
106Los AlamitosOrange County · 11,702 peopleB+better than 65% of U.S. towns·Overall C · #385 of 841
107Rancho MirageRiverside County · 17,876 peopleBbetter than 65% of U.S. towns·Overall D · #607 of 841
108Mammoth LakesMono County · 6,867 peopleBbetter than 64% of U.S. towns·Overall C+ · #323 of 841
109Yorba LindaOrange County · 65,632 peopleBbetter than 63% of U.S. towns·Overall A− · #55 of 841
110DanvilleContra Costa County · 43,302 peopleBbetter than 62% of U.S. towns·Overall A · #6 of 841
111SolvangSanta Barbara County · 5,944 peopleBbetter than 62% of U.S. towns·Overall B+ · #77 of 841
112CotatiSonoma County · 7,347 peopleBbetter than 61% of U.S. towns·Overall B− · #233 of 841
113ArcadiaLos Angeles County · 54,117 peopleBbetter than 61% of U.S. towns·Overall B− · #228 of 841
114LincolnPlacer County · 57,367 peopleBbetter than 61% of U.S. towns·Overall B+ · #85 of 841
115AthertonSan Mateo County · 6,960 peopleBbetter than 61% of U.S. towns·Overall A− · #34 of 841
116ClaytonContra Costa County · 10,842 peopleBbetter than 60% of U.S. towns·Overall B+ · #83 of 841
117Westlake VillageLos Angeles County · 7,505 peopleBbetter than 60% of U.S. towns·Overall B · #138 of 841
118Shasta LakeShasta County · 10,208 peopleBbetter than 60% of U.S. towns·Overall D · #635 of 841
119Thousand OaksVentura County · 122,230 peopleBbetter than 60% of U.S. towns·Overall B+ · #102 of 841
120Canyon LakeRiverside County · 11,113 peopleBbetter than 59% of U.S. towns·Overall C+ · #285 of 841
121GoletaSanta Barbara County · 32,401 peopleBbetter than 59% of U.S. towns·Overall B · #137 of 841
122PasadenaLos Angeles County · 135,804 peopleBbetter than 59% of U.S. towns·Overall C · #421 of 841
123Laguna WoodsOrange County · 16,844 peopleBbetter than 59% of U.S. towns·Overall B · #153 of 841
124PleasantonAlameda County · 74,556 peopleBbetter than 59% of U.S. towns·Overall A− · #65 of 841
125CerritosLos Angeles County · 46,367 peopleBbetter than 58% of U.S. towns·Overall C+ · #247 of 841
126AndersonShasta County · 11,131 peopleBbetter than 58% of U.S. towns·Overall D− · #731 of 841
127Santa BarbaraSanta Barbara County · 86,422 peopleBbetter than 58% of U.S. towns·Overall C · #443 of 841
128MartinezContra Costa County · 36,849 peopleBbetter than 58% of U.S. towns·Overall B− · #166 of 841
129Grover BeachSan Luis Obispo County · 12,456 peopleBbetter than 58% of U.S. towns·Overall C · #355 of 841
130WheatlandYuba County · 4,267 peopleBbetter than 57% of U.S. towns·Overall B− · #208 of 841
131BuelltonSanta Barbara County · 5,158 peopleBbetter than 56% of U.S. towns·Overall B− · #172 of 841
132GridleyButte County · 7,258 peopleBbetter than 56% of U.S. towns·Overall D · #598 of 841
133San RafaelMarin County · 59,410 peopleBbetter than 56% of U.S. towns·Overall C · #380 of 841
134South Lake TahoeEl Dorado County · 21,115 peopleBbetter than 56% of U.S. towns·Overall C− · #484 of 841
135FolsomSacramento County · 91,983 peopleB−better than 55% of U.S. towns·Overall B+ · #117 of 841
136Big Bear LakeSan Bernardino County · 5,018 peopleB−better than 54% of U.S. towns·Overall C · #436 of 841
137YountvilleNapa County · 3,198 peopleB−better than 54% of U.S. towns·Overall C+ · #265 of 841
138BurbankLos Angeles County · 102,988 peopleB−better than 53% of U.S. towns·Overall C · #346 of 841
139Redwood CitySan Mateo County · 82,178 peopleB−better than 53% of U.S. towns·Overall B · #160 of 841
140AuburnPlacer County · 13,847 peopleB−better than 53% of U.S. towns·Overall B− · #218 of 841
141OakdaleStanislaus County · 23,246 peopleB−better than 53% of U.S. towns·Overall C− · #504 of 841
142CupertinoSanta Clara County · 58,333 peopleB−better than 53% of U.S. towns·Overall A− · #26 of 841
143CalistogaNapa County · 4,954 peopleB−better than 52% of U.S. towns·Overall B− · #189 of 841
144Altadenaunincorporated, Los Angeles County · 41,705 peopleB−better than 52% of U.S. towns·Overall B− · #205 of 841
145Manhattan BeachLos Angeles County · 33,122 peopleB−better than 52% of U.S. towns·Overall B+ · #84 of 841
146CarpinteriaSanta Barbara County · 12,734 peopleB−better than 52% of U.S. towns·Overall C+ · #246 of 841
147SonomaSonoma County · 10,537 peopleB−better than 52% of U.S. towns·Overall C+ · #294 of 841
148El Paso de Robles (Paso Robles)San Luis Obispo County · 31,626 peopleB−better than 51% of U.S. towns·Overall C− · #533 of 841
149Rio VistaSolano County · 10,523 peopleB−better than 51% of U.S. towns·Overall C · #448 of 841
150PiedmontAlameda County · 10,642 peopleB−better than 50% of U.S. towns·Overall B+ · #80 of 841
151IoneAmador County · 9,282 peopleB−better than 50% of U.S. towns·Overall C+ · #303 of 841
152RedlandsSan Bernardino County · 74,128 peopleB−better than 49% of U.S. towns·Overall C · #360 of 841
153CamarilloVentura County · 68,652 peopleB−better than 49% of U.S. towns·Overall B− · #197 of 841
154PacificaSan Mateo County · 36,890 peopleB−better than 48% of U.S. towns·Overall B+ · #96 of 841
155CloverdaleSonoma County · 8,701 peopleB−better than 48% of U.S. towns·Overall B− · #240 of 841
156CarlsbadSan Diego County · 112,260 peopleB−better than 48% of U.S. towns·Overall B+ · #94 of 841
157Crescent CityDel Norte County · 6,002 peopleB−better than 48% of U.S. towns·Overall D− · #752 of 841
158Seal BeachOrange County · 24,075 peopleB−better than 47% of U.S. towns·Overall B− · #230 of 841
159EscalonSan Joaquin County · 7,394 peopleB−better than 47% of U.S. towns·Overall C · #342 of 841
160Redondo BeachLos Angeles County · 67,281 peopleB−better than 46% of U.S. towns·Overall B · #151 of 841
161PowaySan Diego County · 49,180 peopleB−better than 46% of U.S. towns·Overall A− · #37 of 841
162Pleasant HillContra Costa County · 34,017 peopleC+better than 44% of U.S. towns·Overall C+ · #300 of 841
163Morgan HillSanta Clara County · 45,625 peopleC+better than 44% of U.S. towns·Overall B− · #171 of 841
164Palm SpringsRiverside County · 45,315 peopleC+better than 43% of U.S. towns·Overall D · #666 of 841
165GaltSacramento County · 26,964 peopleC+better than 43% of U.S. towns·Overall C · #356 of 841
166CalipatriaImperial County · 6,012 peopleC+better than 43% of U.S. towns·Overall D− · #787 of 841
167MillbraeSan Mateo County · 22,869 peopleC+better than 42% of U.S. towns·Overall A− · #53 of 841
168WalnutLos Angeles County · 27,316 peopleC+better than 42% of U.S. towns·Overall B · #127 of 841
169NapaNapa County · 76,562 peopleC+better than 42% of U.S. towns·Overall C · #415 of 841
170UkiahMendocino County · 16,068 peopleC+better than 41% of U.S. towns·Overall D− · #728 of 841
171Yucca ValleySan Bernardino County · 21,887 peopleC+better than 41% of U.S. towns·Overall D− · #754 of 841
172CampbellSanta Clara County · 42,490 peopleC+better than 40% of U.S. towns·Overall B− · #179 of 841
173La MesaSan Diego County · 59,914 peopleC+better than 40% of U.S. towns·Overall C+ · #277 of 841
174RiponSan Joaquin County · 16,140 peopleC+better than 40% of U.S. towns·Overall B+ · #89 of 841
175Suisun CitySolano County · 29,454 peopleC+better than 39% of U.S. towns·Overall C− · #539 of 841
176San RamonContra Costa County · 86,209 peopleC+better than 38% of U.S. towns·Overall A− · #32 of 841
177SacramentoSacramento County · 536,449 peopleC+better than 38% of U.S. towns·Overall C− · #509 of 841
178San DiegoSan Diego County · 1,406,106 peopleC+better than 38% of U.S. towns·Overall C+ · #249 of 841
179TaftKern County · 6,995 peopleC+better than 37% of U.S. towns·Overall D− · #743 of 841
180Mountain ViewSanta Clara County · 85,438 peopleC+better than 37% of U.S. towns·Overall B+ · #113 of 841
181Laguna HillsOrange County · 30,020 peopleC+better than 37% of U.S. towns·Overall B · #158 of 841
182IrvineOrange County · 318,764 peopleC+better than 36% of U.S. towns·Overall B+ · #74 of 841
183NeedlesSan Bernardino County · 4,821 peopleC+better than 36% of U.S. towns·Overall D · #561 of 841
184SeasideMonterey County · 31,636 peopleC+better than 36% of U.S. towns·Overall C− · #543 of 841
185RosevillePlacer County · 167,302 peopleC+better than 35% of U.S. towns·Overall B · #131 of 841
186NorcoRiverside County · 25,081 peopleC+better than 35% of U.S. towns·Overall C · #374 of 841
187Indian WellsRiverside County · 4,992 peopleCbetter than 35% of U.S. towns·Overall B− · #213 of 841
188Dana PointOrange County · 32,232 peopleCbetter than 34% of U.S. towns·Overall B+ · #73 of 841
189ExeterTulare County · 10,122 peopleCbetter than 34% of U.S. towns·Overall D · #571 of 841
190RocklinPlacer County · 76,821 peopleCbetter than 34% of U.S. towns·Overall A− · #56 of 841
191Santa ClaraSanta Clara County · 133,446 peopleCbetter than 34% of U.S. towns·Overall B · #148 of 841
192East Palo AltoSan Mateo County · 28,872 peopleCbetter than 33% of U.S. towns·Overall C− · #477 of 841
193DixonSolano County · 21,116 peopleCbetter than 33% of U.S. towns·Overall C− · #491 of 841
194San Buenaventura (Ventura)Ventura County · 109,914 peopleCbetter than 32% of U.S. towns·Overall C · #418 of 841
195LivermoreAlameda County · 83,457 peopleCbetter than 32% of U.S. towns·Overall B · #139 of 841
196BelmontSan Mateo County · 28,752 peopleCbetter than 32% of U.S. towns·Overall B+ · #68 of 841
197TemeculaRiverside County · 114,865 peopleCbetter than 31% of U.S. towns·Overall C+ · #243 of 841
198Palm DesertRiverside County · 53,259 peopleCbetter than 31% of U.S. towns·Overall D · #584 of 841
199MonroviaLos Angeles County · 38,264 peopleCbetter than 31% of U.S. towns·Overall C+ · #309 of 841
200Rancho Palos VerdesLos Angeles County · 39,654 peopleCbetter than 31% of U.S. towns·Overall A− · #28 of 841
201Mountain HouseSan Joaquin County · 25,315 peopleCbetter than 30% of U.S. towns·Overall B+ · #67 of 841
202GlendaleLos Angeles County · 187,160 peopleCbetter than 30% of U.S. towns·Overall C+ · #316 of 841
203Santa Fe SpringsLos Angeles County · 18,793 peopleCbetter than 30% of U.S. towns·Overall D · #596 of 841
204KingsburgFresno County · 13,249 peopleCbetter than 30% of U.S. towns·Overall C · #373 of 841
205San MateoSan Mateo County · 103,337 peopleCbetter than 30% of U.S. towns·Overall B · #141 of 841
206WindsorSonoma County · 25,864 peopleCbetter than 28% of U.S. towns·Overall B− · #175 of 841
207Huntington BeachOrange County · 191,451 peopleCbetter than 28% of U.S. towns·Overall B− · #167 of 841
208GlendoraLos Angeles County · 49,671 peopleCbetter than 28% of U.S. towns·Overall B− · #191 of 841
209BarstowSan Bernardino County · 24,804 peopleCbetter than 27% of U.S. towns·Overall D− · #719 of 841
210HoltvilleImperial County · 5,591 peopleCbetter than 27% of U.S. towns·Overall C · #376 of 841
211San Juan CapistranoOrange County · 35,119 peopleCbetter than 27% of U.S. towns·Overall B · #121 of 841
212HollisterSan Benito County · 45,695 peopleCbetter than 26% of U.S. towns·Overall C · #365 of 841
213CommerceLos Angeles County · 11,688 peopleCbetter than 26% of U.S. towns·Overall D · #679 of 841
214Mission ViejoOrange County · 90,484 peopleCbetter than 26% of U.S. towns·Overall B+ · #87 of 841
215FremontAlameda County · 226,442 peopleCbetter than 26% of U.S. towns·Overall B+ · #105 of 841
216TorranceLos Angeles County · 138,391 peopleCbetter than 25% of U.S. towns·Overall B− · #220 of 841
217VacavilleSolano County · 103,850 peopleC−better than 25% of U.S. towns·Overall C · #414 of 841
218Foster CitySan Mateo County · 32,411 peopleC−better than 24% of U.S. towns·Overall A · #19 of 841
219San JoseSanta Clara County · 989,814 peopleC−better than 24% of U.S. towns·Overall C+ · #293 of 841
220Fountain ValleyOrange County · 55,508 peopleC−better than 24% of U.S. towns·Overall B− · #226 of 841
221Rohnert ParkSonoma County · 44,811 peopleC−better than 24% of U.S. towns·Overall C · #378 of 841
222MarysvilleYuba County · 12,738 peopleC−better than 24% of U.S. towns·Overall D− · #763 of 841
223South San FranciscoSan Mateo County · 64,941 peopleC−better than 23% of U.S. towns·Overall B− · #204 of 841
224PlacentiaOrange County · 54,911 peopleC−better than 23% of U.S. towns·Overall B− · #209 of 841
225LompocSanta Barbara County · 43,315 peopleC−better than 23% of U.S. towns·Overall D · #631 of 841
226OrovilleButte County · 20,451 peopleC−better than 22% of U.S. towns·Overall D− · #835 of 841
227BrentwoodContra Costa County · 66,607 peopleC−better than 22% of U.S. towns·Overall C+ · #270 of 841
228San DimasLos Angeles County · 32,978 peopleC−better than 22% of U.S. towns·Overall C+ · #273 of 841
229San LeandroAlameda County · 85,353 peopleC−better than 22% of U.S. towns·Overall C− · #485 of 841
230Rancho Santa MargaritaOrange County · 45,779 peopleC−better than 21% of U.S. towns·Overall A− · #36 of 841
231HughsonStanislaus County · 8,051 peopleC−better than 21% of U.S. towns·Overall C+ · #315 of 841
232Monterey ParkLos Angeles County · 57,457 peopleC−better than 20% of U.S. towns·Overall C− · #496 of 841
233ConcordContra Costa County · 123,261 peopleC−better than 20% of U.S. towns·Overall C · #377 of 841
234MoorparkVentura County · 35,023 peopleC−better than 20% of U.S. towns·Overall B+ · #79 of 841
235PinoleContra Costa County · 18,543 peopleC−better than 20% of U.S. towns·Overall C · #411 of 841
236Laguna NiguelOrange County · 64,107 peopleC−better than 20% of U.S. towns·Overall B+ · #69 of 841
237La VerneLos Angeles County · 30,178 peopleC−better than 20% of U.S. towns·Overall B− · #237 of 841
238WoodlandYolo County · 62,513 peopleC−better than 20% of U.S. towns·Overall C · #379 of 841
239DublinAlameda County · 71,602 peopleC−better than 19% of U.S. towns·Overall A− · #58 of 841
240BreaOrange County · 47,260 peopleC−better than 19% of U.S. towns·Overall B− · #227 of 841
241CypressOrange County · 48,781 peopleC−better than 19% of U.S. towns·Overall C+ · #256 of 841
242Simi ValleyVentura County · 124,861 peopleC−better than 18% of U.S. towns·Overall B · #164 of 841
243Loma LindaSan Bernardino County · 25,221 peopleC−better than 18% of U.S. towns·Overall B− · #234 of 841
244BrawleyImperial County · 28,008 peopleC−better than 17% of U.S. towns·Overall D− · #785 of 841
245DuarteLos Angeles County · 22,866 peopleC−better than 17% of U.S. towns·Overall C+ · #313 of 841
246Elk GroveSacramento County · 185,007 peopleC−better than 17% of U.S. towns·Overall B · #154 of 841
247Los Altos HillsSanta Clara County · 8,419 peopleC−better than 17% of U.S. towns·Overall A · #5 of 841
248Costa MesaOrange County · 108,881 peopleC−better than 17% of U.S. towns·Overall B · #125 of 841
249CovinaLos Angeles County · 49,404 peopleC−better than 16% of U.S. towns·Overall C · #339 of 841
250Santa ClaritaLos Angeles County · 228,430 peopleC−better than 16% of U.S. towns·Overall B · #152 of 841
251Long BeachLos Angeles County · 450,469 peopleC−better than 16% of U.S. towns·Overall D · #564 of 841
252Aliso ViejoOrange County · 49,844 peopleC−better than 16% of U.S. towns·Overall A− · #47 of 841
253TustinOrange County · 77,843 peopleC−better than 16% of U.S. towns·Overall C+ · #255 of 841
254WatsonvilleSanta Cruz County · 50,716 peopleC−better than 16% of U.S. towns·Overall D− · #720 of 841
255AlhambraLos Angeles County · 79,820 peopleC−better than 16% of U.S. towns·Overall C+ · #299 of 841
256OrangeOrange County · 138,365 peopleC−better than 15% of U.S. towns·Overall B− · #235 of 841
257Rancho CordovaSacramento County · 87,554 peopleC−better than 15% of U.S. towns·Overall C+ · #314 of 841
258Twentynine PalmsSan Bernardino County · 25,939 peopleDbetter than 15% of U.S. towns·Overall C− · #457 of 841
259SanteeSan Diego County · 58,205 peopleDbetter than 15% of U.S. towns·Overall B · #142 of 841
260West SacramentoYolo County · 56,216 peopleDbetter than 15% of U.S. towns·Overall C · #403 of 841
261ArtesiaLos Angeles County · 15,789 peopleDbetter than 14% of U.S. towns·Overall C · #375 of 841
262InglewoodLos Angeles County · 101,662 peopleDbetter than 14% of U.S. towns·Overall D− · #758 of 841
263San BrunoSan Mateo County · 42,305 peopleDbetter than 14% of U.S. towns·Overall B · #162 of 841
264CalimesaRiverside County · 11,111 peopleDbetter than 14% of U.S. towns·Overall C · #338 of 841
265Diamond BarLos Angeles County · 51,884 peopleDbetter than 14% of U.S. towns·Overall B− · #224 of 841
266Lake ForestOrange County · 86,333 peopleDbetter than 14% of U.S. towns·Overall B+ · #88 of 841
267UplandSan Bernardino County · 79,446 peopleDbetter than 13% of U.S. towns·Overall C+ · #327 of 841
268OceansideSan Diego County · 170,483 peopleDbetter than 13% of U.S. towns·Overall C · #404 of 841
269Rio DellHumboldt County · 3,211 peopleDbetter than 13% of U.S. towns·Overall D− · #821 of 841
270CarsonLos Angeles County · 90,808 peopleDbetter than 13% of U.S. towns·Overall C− · #530 of 841
271LakewoodLos Angeles County · 78,010 peopleDbetter than 13% of U.S. towns·Overall C · #361 of 841
272SunnyvaleSanta Clara County · 156,577 peopleDbetter than 13% of U.S. towns·Overall B+ · #82 of 841
273ClovisFresno County · 129,347 peopleDbetter than 13% of U.S. towns·Overall C+ · #242 of 841
274Monte SerenoSanta Clara County · 3,566 peopleDbetter than 13% of U.S. towns·Overall A · #16 of 841
275GardenaLos Angeles County · 58,460 peopleDbetter than 13% of U.S. towns·Overall D · #585 of 841
276LodiSan Joaquin County · 69,100 peopleDbetter than 12% of U.S. towns·Overall C− · #475 of 841
277MurrietaRiverside County · 114,124 peopleDbetter than 12% of U.S. towns·Overall B− · #202 of 841
278MercedMerced County · 99,724 peopleDbetter than 12% of U.S. towns·Overall D− · #823 of 841
279GilroySanta Clara County · 60,764 peopleDbetter than 12% of U.S. towns·Overall C− · #460 of 841
280BakersfieldKern County · 422,165 peopleDbetter than 11% of U.S. towns·Overall D− · #780 of 841
281VistaSan Diego County · 98,274 peopleDbetter than 11% of U.S. towns·Overall C · #331 of 841
282Santa PaulaVentura County · 31,774 peopleDbetter than 11% of U.S. towns·Overall D · #612 of 841
283YucaipaSan Bernardino County · 54,953 peopleDbetter than 11% of U.S. towns·Overall C · #440 of 841
284CorningTehama County · 8,260 peopleDbetter than 11% of U.S. towns·Overall D− · #802 of 841
285Los AngelesLos Angeles County · 3,869,089 peopleDbetter than 11% of U.S. towns·Overall D · #613 of 841
286Grand TerraceSan Bernardino County · 12,936 peopleDbetter than 11% of U.S. towns·Overall C− · #518 of 841
287King CityMonterey County · 14,002 peopleDbetter than 11% of U.S. towns·Overall D− · #748 of 841
288SangerFresno County · 27,228 peopleDbetter than 11% of U.S. towns·Overall C− · #544 of 841
289La QuintaRiverside County · 39,440 peopleDbetter than 11% of U.S. towns·Overall D · #566 of 841
290HillsboroughSan Mateo County · 11,206 peopleDbetter than 10% of U.S. towns·Overall A− · #29 of 841
291California CityKern County · 13,300 peopleDbetter than 10% of U.S. towns·Overall D− · #841 of 841
292San GabrielLos Angeles County · 38,186 peopleDbetter than 10% of U.S. towns·Overall C · #336 of 841
293FillmoreVentura County · 16,937 peopleDbetter than 10% of U.S. towns·Overall C · #405 of 841
294Citrus HeightsSacramento County · 86,348 peopleDbetter than 10% of U.S. towns·Overall C · #407 of 841
295ClearlakeLake County · 16,893 peopleDbetter than 10% of U.S. towns·Overall D− · #837 of 841
296WhittierLos Angeles County · 85,815 peopleDbetter than 10% of U.S. towns·Overall C · #383 of 841
297HerculesContra Costa County · 26,326 peopleDbetter than 10% of U.S. towns·Overall B− · #195 of 841
298CoalingaFresno County · 17,281 peopleDbetter than 10% of U.S. towns·Overall D · #684 of 841
299EscondidoSan Diego County · 146,030 peopleDbetter than 10% of U.S. towns·Overall D · #551 of 841
300La PalmaOrange County · 14,907 peopleDbetter than 10% of U.S. towns·Overall B− · #222 of 841
301MilpitasSanta Clara County · 78,596 peopleDbetter than 10% of U.S. towns·Overall B− · #173 of 841
302Chino HillsSan Bernardino County · 77,519 peopleDbetter than 9% of U.S. towns·Overall B · #165 of 841
303FullertonOrange County · 138,675 peopleDbetter than 9% of U.S. towns·Overall C+ · #317 of 841
304WestminsterOrange County · 88,966 peopleDbetter than 9% of U.S. towns·Overall C− · #519 of 841
305Yuba CitySutter County · 69,485 peopleDbetter than 9% of U.S. towns·Overall D · #643 of 841
306RiversideRiverside County · 323,057 peopleDbetter than 9% of U.S. towns·Overall D · #568 of 841
307FowlerFresno County · 7,745 peopleDbetter than 9% of U.S. towns·Overall D · #692 of 841
308Rancho CucamongaSan Bernardino County · 177,856 peopleDbetter than 9% of U.S. towns·Overall B · #147 of 841
309San MarcosSan Diego County · 94,908 peopleDbetter than 9% of U.S. towns·Overall B+ · #100 of 841
310TurlockStanislaus County · 72,864 peopleDbetter than 9% of U.S. towns·Overall C− · #537 of 841
311Temple CityLos Angeles County · 35,125 peopleDbetter than 8% of U.S. towns·Overall B− · #170 of 841
312BlytheRiverside County · 15,042 peopleDbetter than 8% of U.S. towns·Overall D · #553 of 841
313CoronaRiverside County · 161,734 peopleDbetter than 8% of U.S. towns·Overall C · #381 of 841
314WaterfordStanislaus County · 9,258 peopleDbetter than 8% of U.S. towns·Overall C− · #505 of 841
315VisaliaTulare County · 146,541 peopleDbetter than 8% of U.S. towns·Overall D · #575 of 841
316LomitaLos Angeles County · 19,724 peopleDbetter than 8% of U.S. towns·Overall C− · #458 of 841
317FresnoFresno County · 555,549 peopleDbetter than 8% of U.S. towns·Overall D · #662 of 841
318EastvaleRiverside County · 70,594 peopleDbetter than 8% of U.S. towns·Overall B− · #183 of 841
319Live OakSutter County · 9,466 peopleDbetter than 8% of U.S. towns·Overall C · #435 of 841
320FairfieldSolano County · 122,489 peopleDbetter than 8% of U.S. towns·Overall C− · #532 of 841
321Lemon GroveSan Diego County · 27,936 peopleDbetter than 8% of U.S. towns·Overall C · #432 of 841
322VallejoSolano County · 123,287 peopleDbetter than 8% of U.S. towns·Overall D− · #724 of 841
323WoodlakeTulare County · 8,073 peopleDbetter than 8% of U.S. towns·Overall D− · #794 of 841
324AtwaterMerced County · 32,133 peopleDbetter than 8% of U.S. towns·Overall D− · #760 of 841
325BeaumontRiverside County · 60,835 peopleDbetter than 8% of U.S. towns·Overall C · #388 of 841
326ModestoStanislaus County · 219,652 peopleDbetter than 8% of U.S. towns·Overall D− · #708 of 841
327LancasterLos Angeles County · 170,084 peopleDbetter than 7% of U.S. towns·Overall D− · #793 of 841
328American CanyonNapa County · 22,773 peopleDbetter than 7% of U.S. towns·Overall C · #357 of 841
329GustineMerced County · 6,112 peopleDbetter than 7% of U.S. towns·Overall D · #658 of 841
330OakleyContra Costa County · 47,583 peopleDbetter than 7% of U.S. towns·Overall C+ · #320 of 841
331Apple ValleySan Bernardino County · 75,247 peopleDbetter than 7% of U.S. towns·Overall D− · #721 of 841
332La HabraOrange County · 60,908 peopleDbetter than 7% of U.S. towns·Overall C · #408 of 841
333MenifeeRiverside County · 118,592 peopleDbetter than 7% of U.S. towns·Overall C− · #449 of 841
334La MiradaLos Angeles County · 45,952 peopleDbetter than 7% of U.S. towns·Overall B− · #219 of 841
335NewarkAlameda County · 47,895 peopleDbetter than 7% of U.S. towns·Overall C+ · #264 of 841
336LemooreKings County · 27,291 peopleDbetter than 7% of U.S. towns·Overall C− · #486 of 841
337Imperial BeachSan Diego County · 25,206 peopleDbetter than 7% of U.S. towns·Overall C− · #467 of 841
338WildomarRiverside County · 37,889 peopleDbetter than 7% of U.S. towns·Overall C− · #487 of 841
339BanningRiverside County · 31,852 peopleDbetter than 7% of U.S. towns·Overall D− · #799 of 841
340HaywardAlameda County · 157,113 peopleDbetter than 7% of U.S. towns·Overall C− · #528 of 841
341ComptonLos Angeles County · 90,500 peopleDbetter than 6% of U.S. towns·Overall D− · #742 of 841
342Dos PalosMerced County · 5,697 peopleDbetter than 6% of U.S. towns·Overall D− · #783 of 841
343Daly CitySan Mateo County · 101,261 peopleDbetter than 6% of U.S. towns·Overall C+ · #254 of 841
344El CajonSan Diego County · 101,755 peopleDbetter than 6% of U.S. towns·Overall D · #644 of 841
345TracySan Joaquin County · 101,901 peopleDbetter than 6% of U.S. towns·Overall C · #372 of 841
346DowneyLos Angeles County · 108,468 peopleDbetter than 6% of U.S. towns·Overall C+ · #257 of 841
347HanfordKings County · 62,229 peopleDbetter than 6% of U.S. towns·Overall D · #569 of 841
348Lake ElsinoreRiverside County · 75,067 peopleDbetter than 6% of U.S. towns·Overall D · #580 of 841
349NewmanStanislaus County · 12,453 peopleDbetter than 6% of U.S. towns·Overall C− · #514 of 841
350ChinoSan Bernardino County · 96,957 peopleDbetter than 5% of U.S. towns·Overall C · #424 of 841
351Port HuenemeVentura County · 20,987 peopleDbetter than 5% of U.S. towns·Overall D · #636 of 841
352StocktonSan Joaquin County · 324,597 peopleD−better than 5% of U.S. towns·Overall D− · #706 of 841
353El CentroImperial County · 44,382 peopleD−better than 5% of U.S. towns·Overall D− · #767 of 841
354RichmondContra Costa County · 114,861 peopleD−better than 5% of U.S. towns·Overall D · #605 of 841
355AnaheimOrange County · 341,008 peopleD−better than 5% of U.S. towns·Overall D · #560 of 841
356Union CityAlameda County · 65,282 peopleD−better than 5% of U.S. towns·Overall C+ · #307 of 841
357ImperialImperial County · 22,330 peopleD−better than 5% of U.S. towns·Overall C+ · #286 of 841
358Garden GroveOrange County · 170,455 peopleD−better than 4% of U.S. towns·Overall C · #358 of 841
359San FernandoLos Angeles County · 23,449 peopleD−better than 4% of U.S. towns·Overall D · #573 of 841
360LawndaleLos Angeles County · 29,892 peopleD−better than 4% of U.S. towns·Overall D · #610 of 841
361AntiochContra Costa County · 118,958 peopleD−better than 4% of U.S. towns·Overall D · #647 of 841
362National CitySan Diego County · 57,807 peopleD−better than 4% of U.S. towns·Overall D · #563 of 841
363SalinasMonterey County · 159,134 peopleD−better than 4% of U.S. towns·Overall D · #695 of 841
364PortervilleTulare County · 63,088 peopleD−better than 4% of U.S. towns·Overall D− · #714 of 841
365Buena ParkOrange County · 81,741 peopleD−better than 4% of U.S. towns·Overall C · #423 of 841
366GonzalesMonterey County · 8,313 peopleD−better than 4% of U.S. towns·Overall C− · #515 of 841
367ReedleyFresno County · 26,982 peopleD−better than 4% of U.S. towns·Overall D · #683 of 841
368RosemeadLos Angeles County · 49,410 peopleD−better than 3% of U.S. towns·Overall C− · #522 of 841
369RiverbankStanislaus County · 26,557 peopleD−better than 3% of U.S. towns·Overall C− · #508 of 841
370MantecaSan Joaquin County · 96,693 peopleD−better than 3% of U.S. towns·Overall C− · #516 of 841
371SoledadMonterey County · 26,357 peopleD−better than 3% of U.S. towns·Overall D · #588 of 841
372MontebelloLos Angeles County · 60,693 peopleD−better than 3% of U.S. towns·Overall D · #680 of 841
373WilliamsColusa County · 5,529 peopleD−better than 3% of U.S. towns·Overall D− · #712 of 841
374PittsburgContra Costa County · 77,542 peopleD−better than 3% of U.S. towns·Overall C− · #498 of 841
375HawthorneLos Angeles County · 82,741 peopleD−better than 3% of U.S. towns·Overall D · #634 of 841
376AzusaLos Angeles County · 47,447 peopleD−better than 3% of U.S. towns·Overall C− · #476 of 841
377ChowchillaMadera County · 18,730 peopleD−better than 3% of U.S. towns·Overall D− · #826 of 841
378West CovinaLos Angeles County · 105,301 peopleD−better than 3% of U.S. towns·Overall C · #387 of 841
379HemetRiverside County · 93,649 peopleD−better than 2% of U.S. towns·Overall D− · #777 of 841
380MaderaMadera County · 69,017 peopleD−better than 2% of U.S. towns·Overall D− · #776 of 841
381TulareTulare County · 73,907 peopleD−better than 2% of U.S. towns·Overall D− · #819 of 841
382ShafterKern County · 23,871 peopleD−better than 2% of U.S. towns·Overall D− · #713 of 841
383GreenfieldMonterey County · 21,138 peopleD−better than 2% of U.S. towns·Overall D− · #750 of 841
384HighlandSan Bernardino County · 57,614 peopleD−better than 2% of U.S. towns·Overall D · #597 of 841
385San JacintoRiverside County · 56,014 peopleD−better than 2% of U.S. towns·Overall D− · #757 of 841
386LathropSan Joaquin County · 42,783 peopleD−better than 2% of U.S. towns·Overall C− · #454 of 841
387Santa MariaSanta Barbara County · 111,390 peopleD−better than 2% of U.S. towns·Overall D− · #781 of 841
388HesperiaSan Bernardino County · 102,605 peopleD−better than 2% of U.S. towns·Overall D− · #740 of 841
389BellflowerLos Angeles County · 74,719 peopleD−better than 2% of U.S. towns·Overall D · #609 of 841
390Los BanosMerced County · 49,614 peopleD−better than 2% of U.S. towns·Overall D− · #732 of 841
391LindsayTulare County · 12,578 peopleD−better than 2% of U.S. towns·Overall D · #700 of 841
392PalmdaleLos Angeles County · 161,845 peopleD−better than 2% of U.S. towns·Overall D− · #796 of 841
393Moreno ValleyRiverside County · 214,263 peopleD−better than 2% of U.S. towns·Overall D · #652 of 841
394AdelantoSan Bernardino County · 38,798 peopleD−better than 2% of U.S. towns·Overall D− · #807 of 841
395GuadalupeSanta Barbara County · 8,846 peopleD−better than 2% of U.S. towns·Overall D · #594 of 841
396VictorvilleSan Bernardino County · 141,395 peopleD−better than 2% of U.S. towns·Overall D− · #789 of 841
397OxnardVentura County · 199,651 peopleD−better than 2% of U.S. towns·Overall D · #697 of 841
398Cathedral CityRiverside County · 52,375 peopleD−among the lowest in the U.S.·Overall D · #611 of 841
399San PabloContra Costa County · 31,678 peopleD−among the lowest in the U.S.·Overall D · #616 of 841
400Chula VistaSan Diego County · 275,533 peopleD−among the lowest in the U.S.·Overall C+ · #282 of 841
401OntarioSan Bernardino County · 187,013 peopleD−among the lowest in the U.S.·Overall D · #565 of 841
402KermanFresno County · 17,553 peopleD−among the lowest in the U.S.·Overall D− · #711 of 841
403IndioRiverside County · 94,269 peopleD−among the lowest in the U.S.·Overall D · #577 of 841
404CeresStanislaus County · 48,982 peopleD−among the lowest in the U.S.·Overall D · #702 of 841
405SelmaFresno County · 24,702 peopleD−among the lowest in the U.S.·Overall D · #681 of 841
406PomonaLos Angeles County · 147,807 peopleD−among the lowest in the U.S.·Overall D · #671 of 841
407FontanaSan Bernardino County · 221,223 peopleD−among the lowest in the U.S.·Overall C− · #468 of 841
408Desert Hot SpringsRiverside County · 34,009 peopleD−among the lowest in the U.S.·Overall D− · #739 of 841
409Jurupa ValleyRiverside County · 107,311 peopleD−among the lowest in the U.S.·Overall D · #653 of 841
410StantonOrange County · 40,161 peopleD−among the lowest in the U.S.·Overall C− · #512 of 841
411CalexicoImperial County · 38,623 peopleD−among the lowest in the U.S.·Overall D · #703 of 841
412El MonteLos Angeles County · 105,075 peopleD−among the lowest in the U.S.·Overall D · #668 of 841
413MontclairSan Bernardino County · 37,563 peopleD−among the lowest in the U.S.·Overall D · #689 of 841
414RialtoSan Bernardino County · 106,554 peopleD−among the lowest in the U.S.·Overall D · #693 of 841
415AvenalKings County · 13,479 peopleD−among the lowest in the U.S.·Overall D · #673 of 841
416ColtonSan Bernardino County · 53,383 peopleD−among the lowest in the U.S.·Overall D · #694 of 841
417ParamountLos Angeles County · 50,755 peopleD−among the lowest in the U.S.·Overall D · #669 of 841
418FirebaughFresno County · 8,774 peopleD−among the lowest in the U.S.·Overall D · #582 of 841
419NorwalkLos Angeles County · 97,104 peopleD−among the lowest in the U.S.·Overall C · #437 of 841
420Hawaiian GardensLos Angeles County · 13,373 peopleD−among the lowest in the U.S.·Overall C− · #490 of 841
421Santa AnaOrange County · 315,586 peopleD−among the lowest in the U.S.·Overall D · #599 of 841
422DinubaTulare County · 25,949 peopleD−among the lowest in the U.S.·Overall D− · #753 of 841
423Pico RiveraLos Angeles County · 58,915 peopleD−among the lowest in the U.S.·Overall C− · #517 of 841
424San BernardinoSan Bernardino County · 222,044 peopleD−among the lowest in the U.S.·Overall D− · #766 of 841
425La Habra HeightsLos Angeles County · 5,327 peopleD−among the lowest in the U.S.·Overall A− · #41 of 841
426PerrisRiverside County · 83,237 peopleD−among the lowest in the U.S.·Overall D− · #709 of 841
427La PuenteLos Angeles County · 36,423 peopleD−among the lowest in the U.S.·Overall C− · #461 of 841
428LivingstonMerced County · 14,690 peopleD−among the lowest in the U.S.·Overall D− · #735 of 841
429South El MonteLos Angeles County · 18,963 peopleD−among the lowest in the U.S.·Overall D− · #751 of 841
430ParlierFresno County · 14,622 peopleD−among the lowest in the U.S.·Overall D− · #795 of 841
431WascoKern County · 26,525 peopleD−among the lowest in the U.S.·Overall D− · #759 of 841
432Baldwin ParkLos Angeles County · 68,880 peopleD−among the lowest in the U.S.·Overall D · #555 of 841
433San JoaquinFresno County · 3,688 peopleD−among the lowest in the U.S.·Overall D− · #803 of 841
434LynwoodLos Angeles County · 63,512 peopleD−among the lowest in the U.S.·Overall D− · #771 of 841
435DelanoKern County · 52,334 peopleD−among the lowest in the U.S.·Overall D · #676 of 841
436ArvinKern County · 19,820 peopleD−among the lowest in the U.S.·Overall D− · #824 of 841
437South GateLos Angeles County · 90,071 peopleD−among the lowest in the U.S.·Overall D · #640 of 841
438CorcoranKings County · 22,358 peopleD−among the lowest in the U.S.·Overall D− · #774 of 841
439MendotaFresno County · 12,778 peopleD−among the lowest in the U.S.·Overall D− · #818 of 841
440McFarlandKern County · 14,709 peopleD−among the lowest in the U.S.·Overall D · #696 of 841
441Huntington ParkLos Angeles County · 51,544 peopleD−among the lowest in the U.S.·Overall D− · #738 of 841
442CoachellaRiverside County · 45,411 peopleD−among the lowest in the U.S.·Overall D · #619 of 841
443MaywoodLos Angeles County · 23,600 peopleD−among the lowest in the U.S.·Overall D · #678 of 841
444BellLos Angeles County · 31,625 peopleD−among the lowest in the U.S.·Overall D · #690 of 841
445Orange CoveFresno County · 9,811 peopleD−among the lowest in the U.S.·Overall C− · #521 of 841
446FarmersvilleTulare County · 10,326 peopleD−among the lowest in the U.S.·Overall D− · #768 of 841
T447Bell GardensLos Angeles County · 37,367 peopleD−among the lowest in the U.S.·Overall D− · #726 of 841
T447CudahyLos Angeles County · 21,445 peopleD−among the lowest in the U.S.·Overall D− · #737 of 841
Not ranked

399 towns without a civic life grade

Towns of 2,500+ that don’t have the figures this grade needs. Each town’s page says which ones are missing.

Quick answers

Questions people ask

Which California town has the most civic life?

Carmel-by-the-Sea (Monterey County) ranks first on civic life among 448 towns, with an A+; Sebastopol and Mount Shasta follow.

How are these towns ranked?

The Civic life grade, a character grade (not part of the overall): library visits per resident (IMLS), community nonprofits (IRS) and volunteering groups. Towns are sorted on the grade’s score; the letter and rank are the same as on each town’s page. How grades work.

Why isn’t my town on this list?

The list covers towns of 2,500+ residents with a civic life grade (448 in California). 399 towns of 2,500+ lack the figures and are listed above. Smaller towns have the grade on their page but no rank. Every town is on the California page.

Go deeper

More California lists

Every list ranks the same 2,500+ towns, so a town’s rank means the same thing on each.

All California rankings →
Other states

Towns with the most civic life in other states