
Ellis Street, Good Hope, California with San Jacinto Peak in background, 2025
Good Hope’s story
Good Hope in pictures
The archive holds 4 old photos and papers going back to 2025 and 5 maps from 1901 on.
Explore the history →Each edition grades its towns against each other only.
A town of 8,816.
Good Hope grades D− overall, 815th of 841 graded towns in California, mostly because of health and incomes. CDC estimates put its residents' health behind 91% of the country. The median household income is $57K, and 27% of residents live below the poverty line. 27% of residents live below the poverty line in Good Hope, where California’s towns sit at 10% and U.S. towns at 9.6%. On hazard risk, just 24 of California’s 1,064 towns do worse.
Where Good Hope’s working residents go each day. Line width shows the share.
Census LEHD 2023
Each subject compared with towns across the country (schools within California), ordered by how far Good Hope is from typical.
How TownRatings grades towns →
The archive holds 4 old photos and papers going back to 2025 and 5 maps from 1901 on.
Explore the history →Museums, parks, gardens and other places to visit around Good Hope. Close and well known come first.
 Big draw37 mi Theme parkDisneyland17.3M visitors a year
 Big draw35 mi Stadium & arenaAngel Stadium of Anaheim
 Big draw37 mi Theme parkDisney California Adventure10.1M visitors a year
 35 mi Stadium & arenaHonda Center
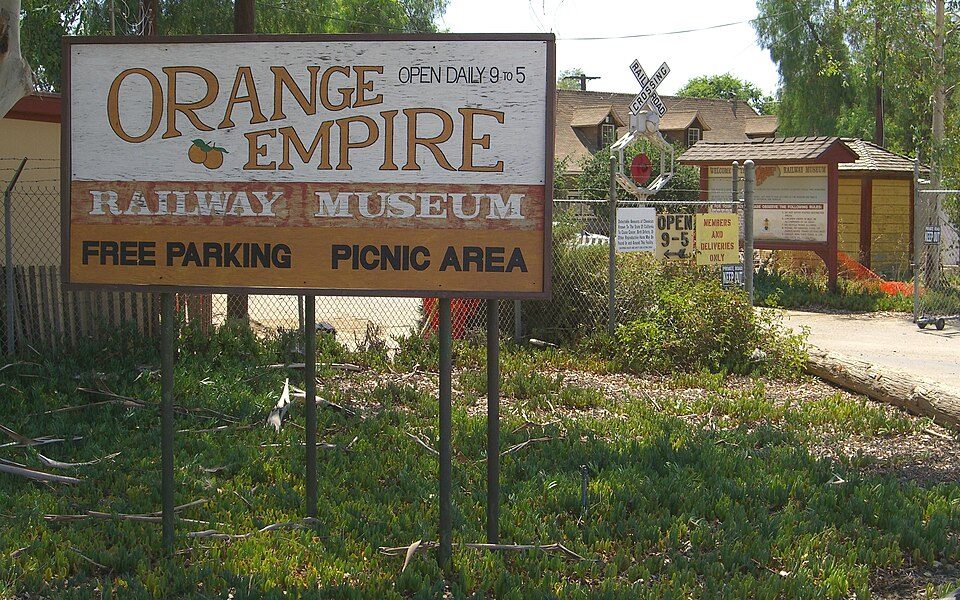 3 mi MuseumOrange Empire Railway Museum
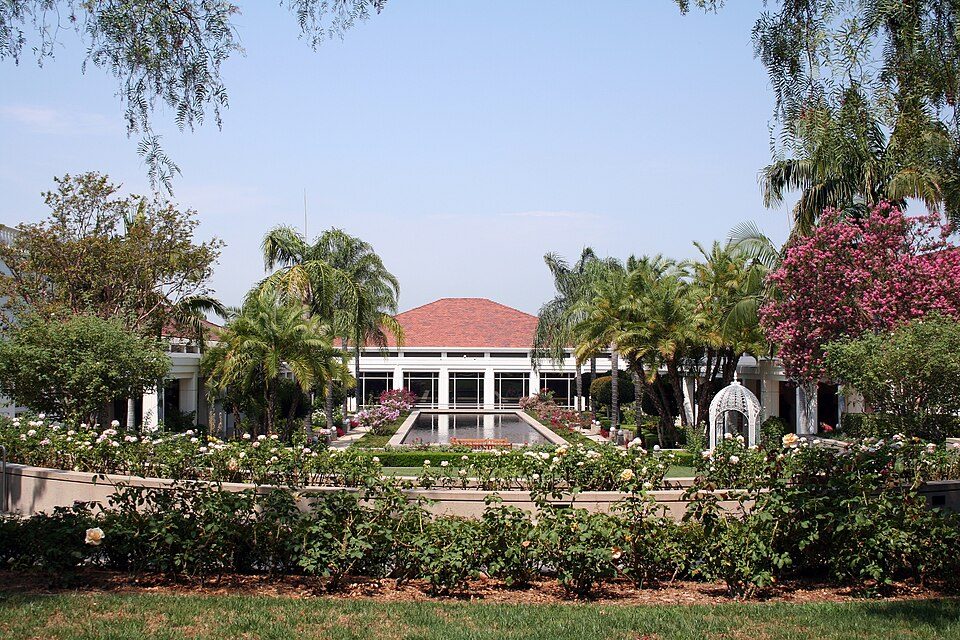 32 mi MuseumRichard Nixon Presidential Library and Museum
Disneyland: HarshLight from San Jose, CA, USA, CC BY 2.0 · Angel Stadium of Anaheim: Staff Sgt. Chad McMeen, Public domain · Disney California Adventure: CrispyCream27, CC BY-SA 4.0 · Honda Center: Arnold C (Buchanan-Hermit), Attribution · Orange Empire Railway Museum: The original uploader was Pretzelpaws at English Wikipedia., CC BY-SA 3.0 · Richard Nixon Presidential Library and Museum: The original uploader was Sorcha at English Wikipedia., CC BY-SA 2.5
Good Hope is unincorporated, so Riverside County and regional agencies provide most services.
EPA SDWIS (Oct 9, 2026) · HIFLD + EIA-861 2025 · Census 2020 ZCTAs · NCES 2024–25 · registration: vote.gov, updated Nov 18, 2024.
Ordered by what stands out in Good Hope.
Good Hope has a longer frost-free season than nearly all U.S. towns, but it has poverty well above the California rate and trails Mead Valley and its other neighbors on schools.
The FEMA risk score in Good Hope is 100 of 100.
FEMA National Risk Index · OpenFEMA
Each of its 3 graded neighbors has a higher School Grade than its C, Mead Valley highest at C+.
Its public schools are run by the Perris Elementary school district. Its two schools are below.
| School | Level | Students | Letter |
|---|---|---|---|
| Good Hope ElementaryLargest public elementary schoolGrades K–6 | Grades K–6 | 648 | – |
| California Ranch School PrivateLargest high schoolGrades 9–11 | Grades 9–11 | 6 | – |
NCES · EDFacts · graded within CA on state tests and graduation
43% of Good Hope adults have obesity. Good Hope beats the California average on 1 of 32 CDC measures and trails it on 22. 15% of Good Hope adults have diabetes.
| Good Hope | California towns | U.S. towns | |
|---|---|---|---|
| Fair or poor health (CDC PLACES) | 36% | 22% | 19% |
| Get no exercise (CDC PLACES) | 38% | 24% | 25% |
| Food insecurity (CDC PLACES) | 37% | 16% | 14% |
| Yearly checkup (CDC PLACES) | 67% | 72% | 79% |
| What stands out | Good Hope | CA |
|---|---|---|
| Fewer adults who have had cancer | 4.1% | 6.4% |
| More uninsured adults | 24.5% | 10.6% |
CDC PLACES 2025 · modeled estimates for adults · CMS · HRSA
Good Hope has 470 jobs for its 3,656 working residents: even if every job went to a resident, most would still commute out. Jobs based here fell from 1,068 in 2013 to 470.
Most working residents leave Good Hope for work: only 1% work in town. Good Hope’s average trip to work is 36 minutes. Jobs based in Good Hope fell to 470 in 2023, 598 fewer than in 2013.
| Good Hope | California towns | U.S. towns | |
|---|---|---|---|
| Average trip to work | 36 minutes | 28 minutes | 25 minutes |
| Median household income | $57,000 | $95,000 | $80,000 |
| Working residents who work in town | 1.4% | 6.6% | 8% |
Census LEHD 2023 · ACS
The Elsinore weather station, 7 miles away, records that the frost-free season runs about 329 days, longer than in 96% of U.S. towns. The Elsinore weather station, 7 miles away, records that about 123 days a year reach 90°, more than in 98% of U.S. towns.
Good Hope has warm winters and hot summers, with very little rain. July afternoons reach 93°, January nights drop to 42° and snow is almost unheard of.
NOAA U.S. Climate Normals, 1991–2020
| Good Hope | California towns | U.S. towns | |
|---|---|---|---|
| Miles of trail per square mile | 0.5 miles per square mile | 1.0 | 0.4 |
| Conserved land | 6.2% | 4.2% | 4.3% |
| Biggest places to walk | Trails | Acres |
|---|---|---|
| 1. Good Hope Park | — | 3 |
Trails & parks © OpenStreetMap contributors · Conserved land: USGS PAD-US
The median property tax bill is $1,926, against $5,124 across California, another input to its cost-of-living grade.
56% of households own their home in Good Hope.
| Good Hope | California towns | U.S. towns | |
|---|---|---|---|
| Households that own their home | 56% | 64% | 73% |
| Median rent | $1,528 a month | $1,898 a month | $1,185 a month |
Census ACS, 2020–24 · Zillow Home Value Index · Redfin Data Center
4 within 15 miles of the center of Good Hope
About 5 of every 100 Good Hope residents are enrolled in college, against 8 across California.
Census-designated place in California, United States
Good Hope is a census-designated place in the Inland Empire region of Riverside County, California. Good Hope sits at an elevation of 1,624 feet (495 m). The 2020 United States census reported Good Hope's population was 9,468.
From Wikipedia, licensed CC BY-SA 4.0 · facts via Wikidata (CC0)
3 towns share a border with Good Hope.
All 3 graded towns on its borders grade higher than its D−; Perris (D−) is closest.
| Town | CA rank | Overall | Cost | Safety | Schools | Health |
|---|---|---|---|---|---|---|
| Good Hope | #815 | D− | C | — | C | D |
| Perris | #709 | D− | D | C− | C+ | C− |
| Meadowbrook | #663 | D | C | — | C+ | D |
| Mead Valley | #650 | D | D | — | C+ | C− |
Good Hope, Meadowbrook and Mead Valley report no FBI crime data of their own. Compare Good Hope with a neighbor →
Short answers, built from the data on this page.
Good Hope grades D− overall, in the bottom 2% of U.S. towns and #815 of 841 in California. It grades D for health and C for schools. Hazard risk is its weak spot, with a D−.
The typical home is worth about $392,000, 49% below the California typical home. Cost of living, which also weighs rents, property taxes and how many households pay 30% or more of their income for housing, grades C.


