
Stevenson Ranch - Agrestic Intro, 2006
Stevenson Ranch’s story
39 years in pictures
The archive holds 5 old photos and papers going back to 2006 and 8 maps from 1903 on.
- 1987Stevenson Ranch is settled
Each edition grades its towns against each other only.

Population 20,990: a town settled in 1987.
Plenty in its favour, and one clear drawback. Its strongest is health (A): CDC estimates put its residents' health ahead of 94% of the country. With a B overall, Stevenson Ranch is better than just over three fifths of U.S. towns and ranks 134th of 841 in California. Add schools to its strengths: its schools rank ahead of 86% of California towns. What holds it back is cost of living (D−): the typical home is worth about $1.1 million, 11.3 years of the Los Angeles metro’s $96K median household income. No town in California scores lower than Stevenson Ranch on history. The town’s going rate for rent is $2,841 a month, above both California’s towns ($1,895 a month) and U.S. towns ($1,185 a month). FEMA rates its natural-hazard risk higher than 90% of U.S. communities, with earthquakes at the top.
Figures: health, CDC PLACES · schools, state test and graduation results · home values, Zillow · incomes, Census ACS, 2020–24 · FEMA National Risk Index · National Register of Historic Places.
Where Stevenson Ranch beats most towns, and one thing worth knowing.
| Widest gap | Stevenson Ranch | CA |
|---|---|---|
| Fewer uninsured adults | 4.7% | 10.6% |
| School | Grades | Students |
|---|---|---|
| Pico Canyon Elementary | K–6 | 851 |
| Stevenson Ranch Elementary | K–6 | 764 |
| Oak Hills Elementary | K–6 | 660 |
17,557 counted in 2010 and 20,178 in 2020.
U.S. Census 2010 & 2020 counts
Each subject compared with towns across the country (schools within California), ordered by how far Stevenson Ranch is from typical.
How TownRatings grades towns →
The archive holds 5 old photos and papers going back to 2006 and 8 maps from 1903 on.
Museums, parks, gardens and other places to visit around Stevenson Ranch. Close and well known come first.
 Big draw24 mi LandmarkHollywood Walk of Fame10.0M visitors a year
 Big draw3 mi Theme parkSix Flags Magic Mountain3.3M visitors a year
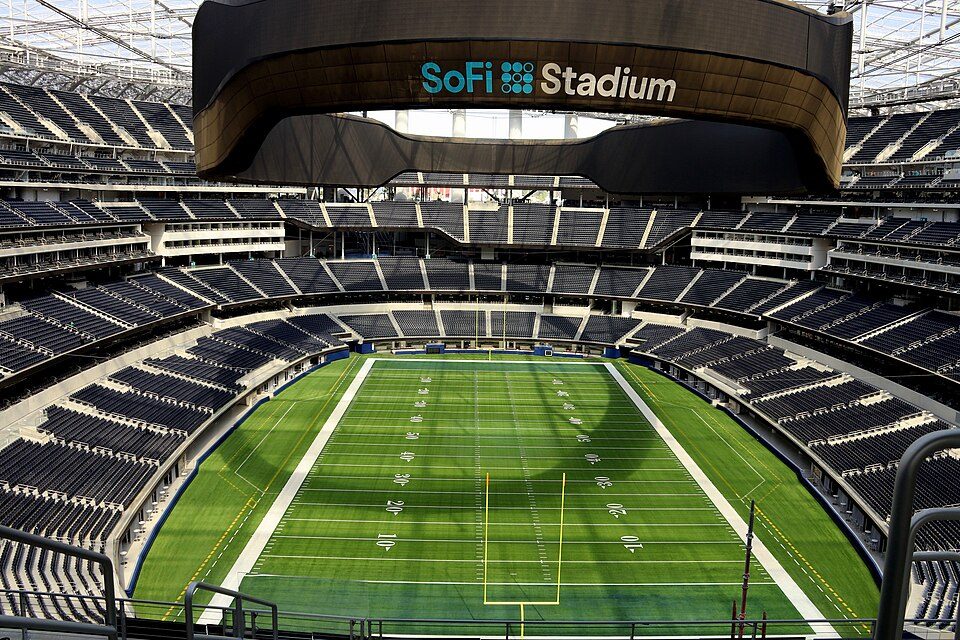 Big draw33 mi Stadium & arenaSoFi Stadium
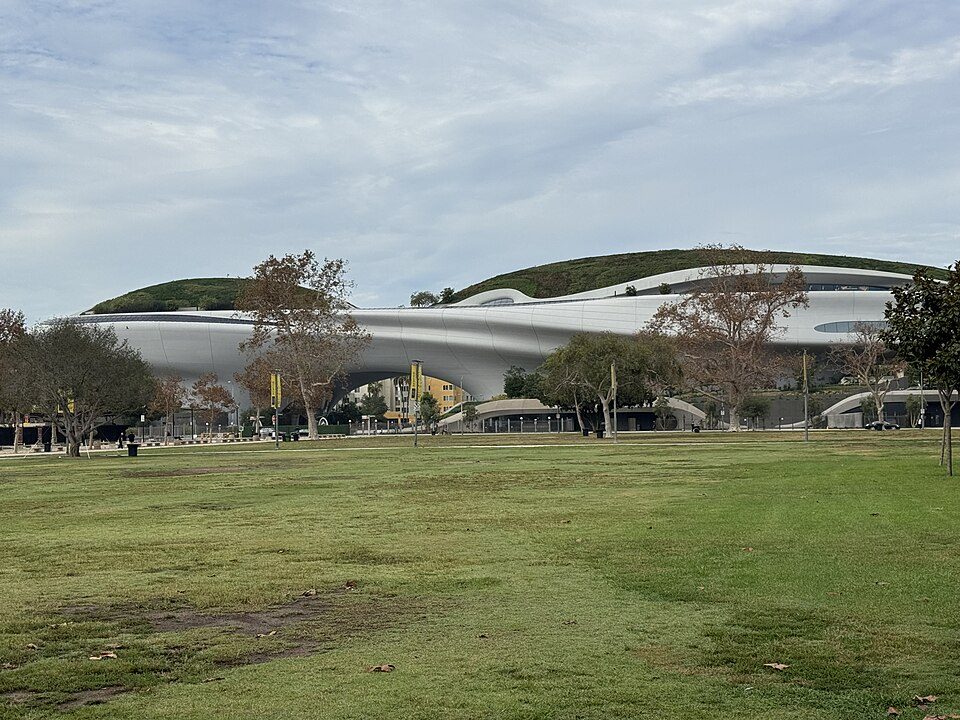 Big draw31 mi MuseumLucas Museum of Narrative Art
 Big draw23 mi LandmarkHollywood Sign
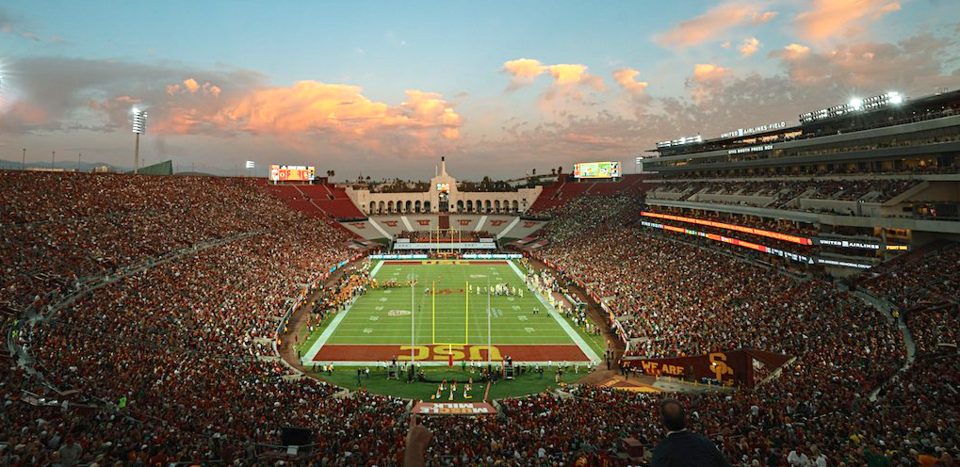 Big draw31 mi Stadium & arenaLos Angeles Memorial Coliseum
Hollywood Walk of Fame: BenSherman, Public domain · Six Flags Magic Mountain: Alton, CC BY 3.0 · SoFi Stadium: Thank You (21 Millions+) views, CC BY 2.0 · Lucas Museum of Narrative Art: Kriddl, CC0 · Hollywood Sign: Thomas Wolf, www.foto-tw.de, CC BY-SA 3.0 · Los Angeles Memorial Coliseum: CanonStarGal, CC BY-SA 4.0
Stevenson Ranch is unincorporated, so Los Angeles County and regional agencies provide most services.
EPA SDWIS (Oct 9, 2026) · HIFLD + EIA-861 2025 · Census 2020 ZCTAs · NCES 2024–25 · registration: vote.gov, updated Nov 18, 2024.
Ordered by what stands out in Stevenson Ranch.
Stevenson Ranch has milder winter nights than nearly all U.S. towns and has less no health insurance than most of California, but it has homes that cost more against local pay than most of California.
Its widest gap with California is no health insurance: 4.7% of those 18–64 have no health insurance, against 10.6% statewide. Against the 2,263 U.S. towns with household incomes like Stevenson Ranch’s, it is healthier than 66%, a smaller edge than it has nationally: part of it comes with its incomes.
8.4% of Stevenson Ranch adults smoke cigarettes. In Stevenson Ranch, 26% of adults have high blood pressure, and 11% report frequent physical distress.
| Stevenson Ranch | California towns | U.S. towns | |
|---|---|---|---|
| Obesity (CDC PLACES) | 22% | 29% | 35% |
| High blood pressure (CDC PLACES) | 26% | 31% | 35% |
| Frequent physical distress (CDC PLACES) | 11% | 14% | 14% |
| Feel lonely (CDC PLACES) | 38% | 36% | 33% |
| What stands out | Stevenson Ranch | CA |
|---|---|---|
| Fewer uninsured adults | 4.7% | 10.6% |
| Fewer older adults who have lost all their teeth | 5% | 10.6% |
CDC PLACES 2025 · modeled estimates for adults · CMS · HRSA
That grade comes with a D− for cost of living: the typical home is worth about $1.09M.
The largest public high school is West Ranch High, with 1,777 students. Public schools: the William S. Hart Union High school district. Three of its 6 schools are below, each with the reason it’s listed.
| School | Level | Students | Letter |
|---|---|---|---|
| Pico Canyon ElementaryLargest public elementary schoolGrades K–6 | Grades K–6 | 851 | A |
| West Ranch HighLargest public high schoolGrades 9–12 | Grades 9–12 | 1,777 | – |
| Stevenson Ranch ElementaryTop results in townGrades K–6 | Grades K–6 | 764 | A+ |
NCES · EDFacts · graded within CA on state tests and graduation
Federal aid has come to Stevenson Ranch households in 6 declared disasters; the latest was in 2025. 48% of the town’s expected losses from natural hazards come from earthquakes, followed by inland flooding at 47%.
FEMA disaster declarations and aid · FEMA National Risk Index · OpenFEMA
Trails total 6.7 miles in 7 parks and preserves. The biggest park or preserve is Santa Clarita City Open Space, at 93 acres. Stevenson Ranch’s trail network density stands at 1.1 miles per square mile.
| Stevenson Ranch | California towns | U.S. towns | |
|---|---|---|---|
| Miles of trail per square mile | 1.1 miles per square mile | 1.0 | 0.4 |
| Conserved land | 7.2% | 4.2% | 4.3% |
| Biggest places to walk | Trails | Acres |
|---|---|---|
| 1. Pico Canyon Park | 0.8 mi | 21 |
| 2. Santa Clarita City Open Space | 0.4 mi | 93 |
| 3. Dr Richard H Rioux Memorial Park | 0.3 mi | 17 |
Trails & parks © OpenStreetMap contributors · Conserved land: USGS PAD-US
The average commute for its 9,590 working residents takes 36.3 minutes, against 28.7 across California. 26.3% of workers work from home, against 17.2% across California.
Among workers in Stevenson Ranch, 26% work remotely from home. Commuting out is the norm here: 3% of working residents work locally. Between 2013 and 2023, jobs in the town rose by 495, to 3,786. Also worth knowing: its median household income is $158,000.
| Stevenson Ranch | California towns | U.S. towns | |
|---|---|---|---|
| Median household income | $158,000 | $95,000 | $80,000 |
| Work from home | 26% | 14% | 11% |
| Average trip to work | 36 minutes | 28 minutes | 25 minutes |
| Below the poverty line | 4.2% | 10% | 9.6% |
Census LEHD 2023 · ACS
January nights average 43.3°, milder than in 96% of U.S. towns; July afternoons average 92.9°.
The typical July afternoon high for Stevenson Ranch comes to 93°F. Snow is a rarity.
| Stevenson Ranch | California towns | U.S. towns | |
|---|---|---|---|
| July high | 93°F | 89°F | 85°F |
| January low | 43°F | 40°F | 22°F |
NOAA U.S. Climate Normals, 1991–2020
At 11.3 years of the Los Angeles metro’s $96K median household income, the typical home costs more against local pay than in 83% of California towns; that ratio is one input to its D− for cost of living.
Homes sold in Stevenson Ranch spent a median 39 days on the market. In Stevenson Ranch, 64% of households are owner-occupiers.
| Stevenson Ranch | California towns | U.S. towns | |
|---|---|---|---|
| Median rent | $2,841 a month | $1,895 a month | $1,185 a month |
| Households that own their home | 64% | 64% | 73% |
Census ACS, 2020–24 · Zillow Home Value Index · Redfin Data Center
8 within 15 miles of the center of Stevenson Ranch
About 7 of every 100 Stevenson Ranch residents are enrolled in college, about the same as California.
Where Stevenson Ranch’s working residents go each day. Line width shows the share.
Census LEHD 2023
Unincorporated community in California, United States
Stevenson Ranch is an unincorporated community in the Santa Clarita Valley of Los Angeles County, California. Stevenson Ranch is set in the foothills of the Santa Susana Mountains and lies west of Interstate 5 and the city of Santa Clarita. Stevenson Ranch encompasses about 6.4 square miles (17 km2). About 1,000 acres (4.0 km2) are set aside as parks, recreation areas, and open space. A master-planned community, it was approved by the county Board of Supervisors in 1985. The population was 20,178 at the time of the 2020 census. For statistical purposes, the Census Bureau has designated it a census-designated place (CDP). It is home to Stevenson Ranch, Pico Canyon, and Oak Hills elementary s…
From Wikipedia, licensed CC BY-SA 4.0 · facts via Wikidata (CC0)
One town shares a border with Stevenson Ranch.
| Town | CA rank | Overall | Cost | Safety | Schools | Health |
|---|---|---|---|---|---|---|
| Stevenson Ranch | #134 | B | D− | — | A | A |
| Santa Clarita | #152 | B | D− | B− | A | A− |
Stevenson Ranch reports no FBI crime data of its own. Compare Stevenson Ranch with a neighbor →
Short answers, built from the data on this page.
For most people who can afford it, yes. Stevenson Ranch grades B overall, better than 61% of U.S. towns and #134 of 841 in California. It grades A for health and A for schools. Cost of living is its weak spot, with a D−.
Yes. The typical home is worth about $1,086,000, 43% above the California typical home. Cost of living, which also weighs rents, property taxes and how many households pay 30% or more of their income for housing, grades D−.


