Running SpringsCA
A town of 4,917, settled in 1927.
Is Running Springs a good place to live?
FEMA rates its natural-hazard risk higher than 99% of U.S. communities, with wildfire at the top. Overall it grades C−, ranked 529th of 841 in California. It is more walkable than 85% of U.S. towns. Its weakest subject is cost of living: the typical home is worth about $337K, 3.8 years of the Riverside metro’s $90K median household income. Running Springs’ average trip to work is 40 minutes, where California’s towns sit at 28 minutes and U.S. towns at 25 minutes. San Bernardino National Forest, at 2,684 acres with 5 miles of trail, is the biggest park or preserve.
What makes Running Springs stand out
Where Running Springs beats most towns, and one thing worth knowing.
95% of working residents leave Running Springs for work
Where Running Springs’s working residents go each day. Line width shows the share.
Census LEHD 2023
How Running Springs grades
Each subject compared with towns across the country (schools within California), ordered by how far Running Springs is from typical.
Its grades run from A for walkability (better than 85% of comparable towns) to D− for hazard risk (better than 1%), so the C− overall blends very different results.
How TownRatings grades towns →
Joshua Tree National Park and 38 more within 40 miles
Museums, parks, gardens and other places to visit around Running Springs. Close and well known come first.
 Big draw38 mi National ParkJoshua Tree National Park2.9M visitors a year
 8 mi LakeBig Bear Lake
 18 mi MountainSan Gorgonio Mountain
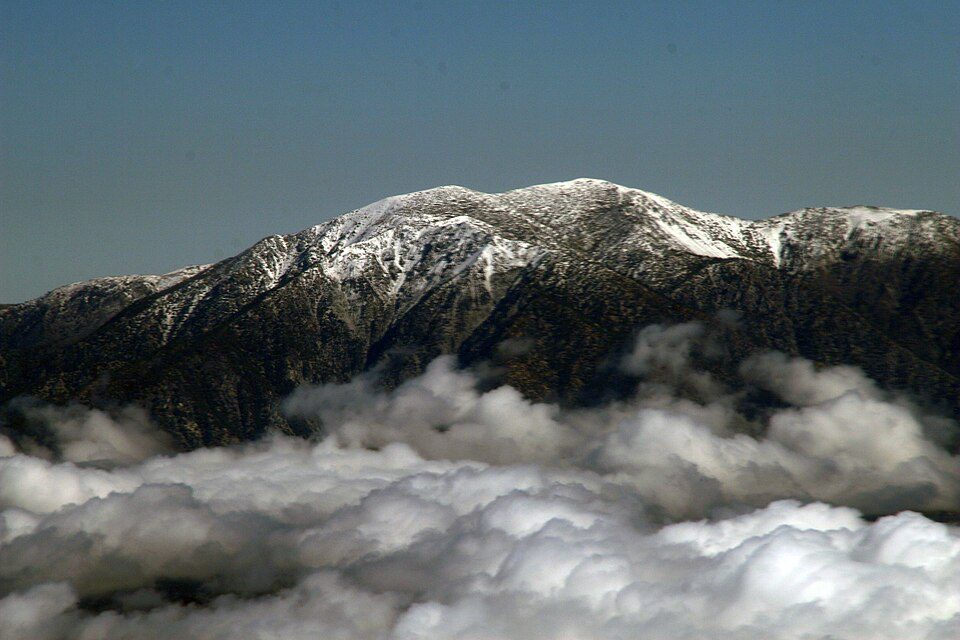 32 mi MountainMount San Antonio
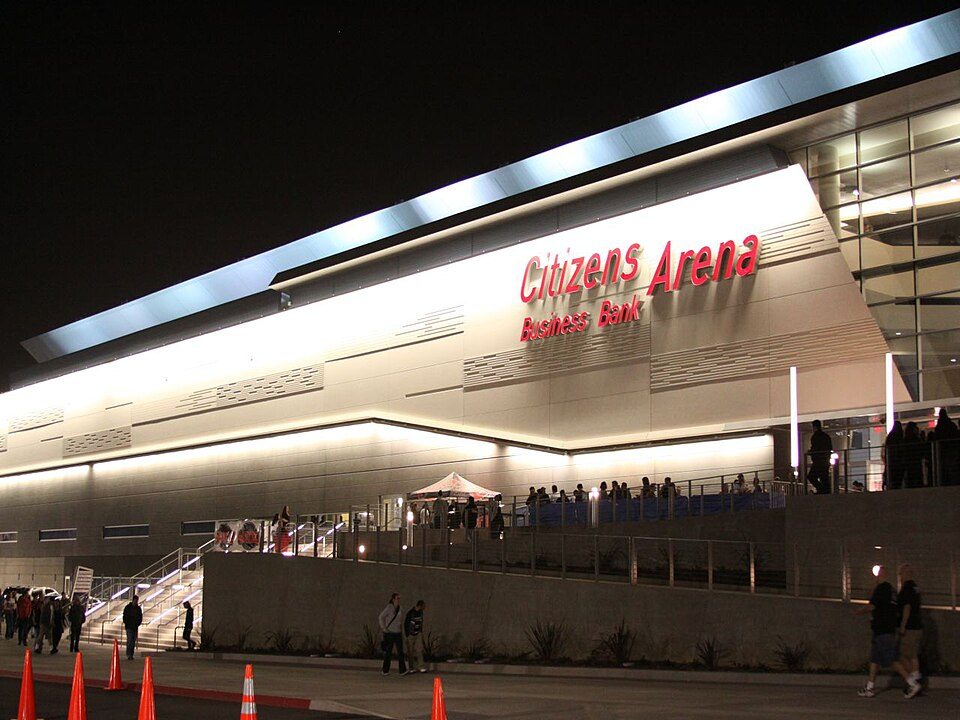 28 mi Stadium & arenaToyota Arena
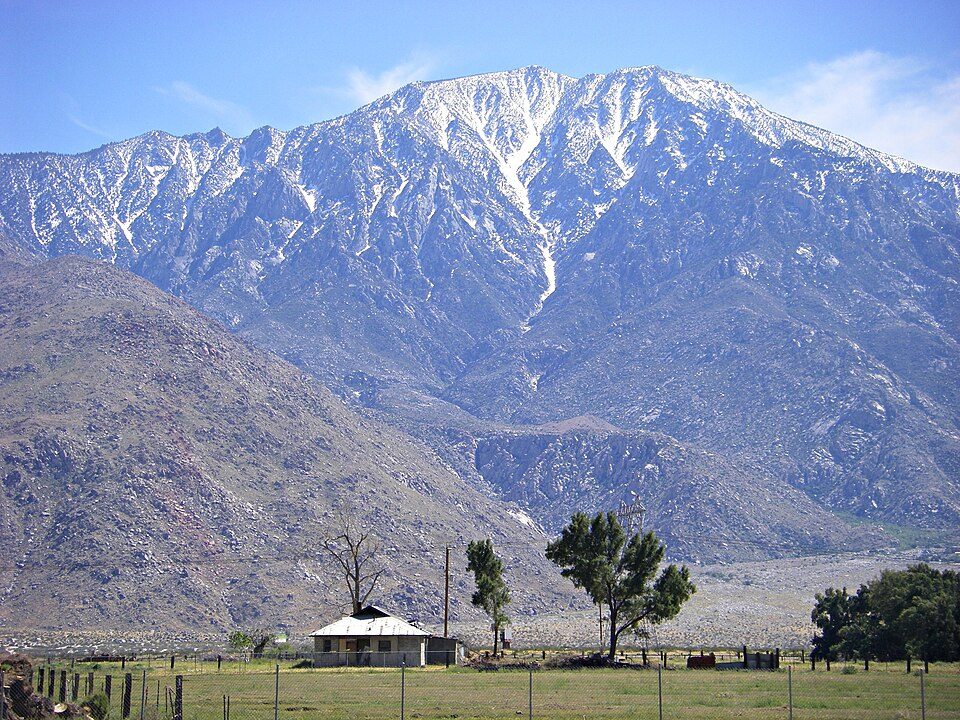 37 mi MountainSan Jacinto Peak
Photo credits
Joshua Tree National Park: Sergiy Galyonkin, CC BY-SA 4.0 · Big Bear Lake: H.G. Judd, CC BY-SA 3.0 · San Gorgonio Mountain: Doc Searls, CC BY-SA 2.0 · Mount San Antonio: The original uploader was Tillman at English Wikipedia., CC BY-SA 2.0 · Toyota Arena: jondoeforty1, CC BY 2.0 · San Jacinto Peak: Wattewyl, CC BY 3.0


Moving to Running Springs: who provides what
Running Springs is unincorporated, so San Bernardino County and regional agencies provide most services.
EPA SDWIS (Oct 9, 2026) · HIFLD + EIA-861 2025 · Census 2020 ZCTAs · NCES 2024–25 · registration: vote.gov, updated Nov 18, 2024.
The data
Ordered by what stands out in Running Springs.
Running Springs keeps more of its land conserved than most of California, has home values still below their peak and has milder winter nights than most of the country, though not than most of California.
Running Springs faces a very high natural-hazard risk, led by wildfire
FEMA National Risk Index · OpenFEMA
Running Springs’ grade for cost of living is a D
The typical value, about $337K, is 12% below its July 2022 peak. 71.9% of renter households pay 30% or more of their income for housing, against 55.3% across California.
Running Springs’ median rent is $1,804 a month. The typical Running Springs home is worth about $337,000, down 4.1% in a year, 56% below the California typical home.
| Running Springs | California towns | U.S. towns | |
|---|---|---|---|
| Median rent | $1,804 a month | $1,898 a month | $1,185 a month |
| Households that own their home | 74% | 64% | 73% |
Typical home value
Census ACS, 2020–24 · Zillow Home Value Index · Redfin Data Center
Nearly a third of Running Springs is conserved land
Its 823 conserved acres are a larger share of the town than in 93% of California towns.
The trail density in Running Springs is 1.2 miles per square mile.
| Biggest places to walk | Trails | Acres |
|---|---|---|
| 1. San Bernardino National Forest | 5 mi | 2,684 |
Trails & parks © OpenStreetMap contributors · Conserved land: USGS PAD-US
Most working residents commute out of Running Springs
Running Springs has 382 jobs for its 2,172 working residents: even if every job went to a resident, most would still commute out. The average commute takes 40.3 minutes, against 28.7 across California.
Most working residents leave Running Springs for work: only 5% work in town. 16% of Running Springs residents live below the poverty line. Since 2013, Running Springs has lost 54 jobs, to 382 in 2023.
| Running Springs | California towns | U.S. towns | |
|---|---|---|---|
| Below the poverty line | 16% | 10% | 9.6% |
| Working residents who work in town | 4.8% | 6.6% | 8% |
| Median household income | $82,000 | $95,000 | $80,000 |
Where working residents work
Census LEHD 2023 · ACS
A typical January night in Running Springs is 30°F, against 41°F in California’s towns and 22°F across U.S. towns
January nights average 29.7°: milder than most of the country, but colder than 89% of California places with climate records; July afternoons average 80.5°.
Running Springs has mild winters and pleasant summers.
| Running Springs | California towns | U.S. towns | |
|---|---|---|---|
| July high | 81°F | 89°F | 85°F |
| January low | 30°F | 41°F | 22°F |
Typical low → high °F
NOAA U.S. Climate Normals, 1991–2020
Fewer young adults than California overall
Adults 18 to 34 are 18% of residents (24% statewide). 26% of residents are under 18 in Running Springs. 31% of adults 25 and older have a bachelor’s degree or more, vs 37% across California.
| Running Springs | California towns | U.S. towns | |
|---|---|---|---|
| Under 18 | 26% | 22% | 22% |
| Median age | 37.9 years | 39.1 years | 40.5 years |
Ages · share of residents
Education · adults 25 and older
Women and men · all residents
50% women, 50% men
That’s an even split within the survey’s margin of ±3.5 points. Across California, 50.1% of residents are women.
| Running Springs | CA | U.S. | |
|---|---|---|---|
| Under 10 | 15% | 11.4% | 11.6% |
| 10 to 17 | 10.5% | 10.5% | 10.3% |
| 18 to 24 | 7.4% | 9.1% | 9.1% |
| 25 to 34 | 11% | 14.8% | 13.7% |
| 35 to 44 | 15.8% | 13.9% | 13.2% |
| 45 to 54 | 8.7% | 12.5% | 12.2% |
| 55 to 64 | 14.5% | 12.1% | 12.7% |
| 65 to 74 | 12.8% | 9.2% | 10.2% |
| 75 and older | 4.4% | 6.5% | 7% |
| No diploma | 5.6% | 15.3% | 10.4% |
| High school | 23.3% | 20.5% | 26% |
| Some college | 28.2% | 19.3% | 19.1% |
| Associate’s | 12.4% | 7.9% | 8.8% |
| Bachelor’s | 20.9% | 22.7% | 21.6% |
| Graduate | 9.6% | 14.4% | 14.1% |
U.S. Census Bureau · ACS 2020-2024 5-year estimates · in a town of 4,900, single groups can be off by several points
Residents of Running Springs are healthier than 60% of U.S. towns
Running Springs beats the California average on 8 of 32 CDC measures and trails it on 8.
| Running Springs | California towns | U.S. towns | |
|---|---|---|---|
| Yearly checkup (CDC PLACES) | 73% | 72% | 79% |
| Get no exercise (CDC PLACES) | 21% | 24% | 25% |
| High blood pressure (CDC PLACES) | 36% | 31% | 35% |
| Obesity (CDC PLACES) | 32% | 29% | 35% |
| What stands out | Running Springs | CA |
|---|---|---|
| Fewer uninsured adults | 7.1% | 10.6% |
| Fewer adults facing housing insecurity | 11.4% | 14.9% |
| More adults who have had cancer | 9.1% | 6.4% |
CDC PLACES 2025 · modeled estimates for adults · CMS · HRSA
Everything we know about Running Springs
Colleges nearby
5 within 15 miles of the center of Running Springs
About 7 of every 100 Running Springs residents are enrolled in college, about the same as California.
About Running Springs
Census-designated place in California, United States
Running Springs is a census-designated place (CDP) in San Bernardino County, California, United States. The population was 5,268 at the 2020 census, up from 4,862 at the 2010 census. Running Springs is situated 17 miles (27 km) west of the city of Big Bear Lake. Running Springs is home to the 3,400-acre (1,400 ha) National Children's Forest, which offers interpretive programs, educational tours and more. Snow Valley Mountain Resort was established here in the 1920s and was the first ski resort in the San Bernardino Mountains.
From Wikipedia, licensed CC BY-SA 4.0 · facts via Wikidata (CC0)
- Area
- 4.2 sq mi
- Elevation
- 6,109 ft
- ZIP code
- 92382
- Area code
- 909
Questions about Running Springs
Short answers, built from the data on this page.
Is Running Springs, CA a good place to live?
Running Springs grades C− overall, better than 17% of U.S. towns and #529 of 841 in California. It grades B for health and C+ for schools. Hazard risk is its weak spot, with a D−.
Is Running Springs, CA expensive?
Yes. Cost of living, which also weighs rents, property taxes and how many households pay 30% or more of their income for housing, grades D.