
CanyonLakeCAEntrance, 2006
Canyon Lake’s story
46 years in pictures
Census counts: 2,039 in 1980, 11,082 in 2020. The archive holds 11 old photos and papers going back to 2006 and 4 maps from 1953 on.
- 1980Canyon Lake is settled
Each edition grades its towns against each other only.

A town of 11,113, settled in 1980.
The typical home is worth about $704K, 7.8 years of the Riverside metro’s $90K median household income. Overall it grades C+, 285th of 841 graded towns in California. It reports less crime per resident than 78% of U.S. towns. Its weakest subject is hazard risk: FEMA rates its natural-hazard risk higher than 86% of U.S. communities, with inland flooding at the top. Canyon Lake’s average trip to work is 48 minutes, against 28 minutes in California’s towns and 25 minutes across U.S. towns. On history, just 6 of California’s 1,063 towns do worse.
Where Canyon Lake beats most towns, and one thing worth knowing.
Where Canyon Lake’s working residents go each day. Line width shows the share.
Census LEHD 2023
Each subject compared with towns across the country (schools within California), ordered by how far Canyon Lake is from typical.
How TownRatings grades towns →
Census counts: 2,039 in 1980, 11,082 in 2020. The archive holds 11 old photos and papers going back to 2006 and 4 maps from 1953 on.
Who provides power, water and the rest in Canyon Lake, and how to reach them.
EPA SDWIS (Oct 9, 2026) · HIFLD + EIA-861 2025 · Census 2020 ZCTAs · NCES 2024–25 · registration: vote.gov, updated Nov 18, 2024.
Ordered by what stands out in Canyon Lake.
Canyon Lake fares better on crime within California than nationally, has a longer frost-free season than nearly all U.S. towns and sends most of its workers to Lake Elsinore and beyond.
6.3 miles of trail in 10 parks and preserves. The trail density in Canyon Lake is 1.4 miles per square mile.
| Canyon Lake | California towns | U.S. towns | |
|---|---|---|---|
| Miles of trail per square mile | 1.4 miles per square mile | 1.0 | 0.4 |
| Conserved land | 0.7% | 4.3% | 4.3% |
| Biggest places to walk | Trails | Acres |
|---|---|---|
| 1. Holiday Harbor Park | — | 5 |
| 2. Sierra Park | — | 4 |
| 3. Indian Beach Park | — | 3 |
Trails & parks © OpenStreetMap contributors · Conserved land: USGS PAD-US
FEMA National Risk Index · OpenFEMA
At 9 crimes per 1,000 residents a year, it reports less crime than 97% of California’s graded towns. Reported crimes fell from 95 to 59 over the last three FBI years, a drop beyond ordinary year-to-year swings.
Canyon Lake’s violent crime rate is 0.3 per 1,000 residents.
| Canyon Lake | California towns | U.S. towns | |
|---|---|---|---|
| Violent crimes per 1,000 (2025) | 0.3 per 1,000 residents | 2.9 | 1.6 |
| Property crimes per 1,000 (2025) | 5 per 1,000 residents | 13.4 | 9.9 |
FBI crime data, 2025 · crimes reported to police
Canyon Lake has 1,247 jobs for its 4,882 working residents: even if every job went to a resident, most would still commute out. The average commute takes 48.2 minutes, against 28.7 across California.
Most working residents leave Canyon Lake for work: only 4% work in town. Jobs based in Canyon Lake grew to 1,247 in 2023, 203 more than in 2013. 7.3% of Canyon Lake residents live below the poverty line.
| Canyon Lake | California towns | U.S. towns | |
|---|---|---|---|
| Median household income | $127,000 | $95,000 | $80,000 |
| Below the poverty line | 7.3% | 10% | 9.6% |
| Working residents who work in town | 3.7% | 6.6% | 8% |
Census LEHD 2023 · ACS
People 65 and older are 26% of residents (16% statewide); adults 18 to 34 are 15% of residents (24% statewide). 31% of adults 25 and older have a bachelor’s degree or more, vs 37% across California.
| Canyon Lake | California towns | U.S. towns | |
|---|---|---|---|
| Aged 65 or older | 26% | 16% | 18% |
| Median age | 47 years | 39 years | 40.5 years |
| Under 18 | 23% | 22% | 22% |
51% women, 49% men
That’s an even split within the survey’s margin of ±2.8 points. Across California, 50.1% of residents are women.
| Canyon Lake | CA | U.S. | |
|---|---|---|---|
| Under 10 | 10.5% | 11.4% | 11.6% |
| 10 to 17 | 12.4% | 10.5% | 10.3% |
| 18 to 24 | 5.1% | 9.1% | 9.1% |
| 25 to 34 | 10% | 14.8% | 13.7% |
| 35 to 44 | 8.4% | 13.9% | 13.2% |
| 45 to 54 | 13.4% | 12.5% | 12.2% |
| 55 to 64 | 14.2% | 12.1% | 12.7% |
| 65 to 74 | 16% | 9.2% | 10.2% |
| 75 and older | 10.1% | 6.5% | 7% |
| No diploma | 5.2% | 15.3% | 10.4% |
| High school | 24.8% | 20.5% | 26% |
| Some college | 27.6% | 19.3% | 19.1% |
| Associate’s | 11.7% | 7.9% | 8.8% |
| Bachelor’s | 18.8% | 22.7% | 21.6% |
| Graduate | 11.9% | 14.4% | 14.1% |
U.S. Census Bureau · ACS 2020-2024 5-year estimates
The Elsinore weather station, 5 miles away, records that the frost-free season runs about 329 days, longer than in 96% of U.S. towns. The Elsinore weather station, 5 miles away, records that about 123 days a year reach 90°, more than in 98% of U.S. towns.
Canyon Lake has warm winters and hot summers, with very little rain. July afternoons reach 92°, January nights drop to 42° and snow is almost unheard of.
NOAA U.S. Climate Normals, 1991–2020
Against the 4,867 U.S. towns with household incomes like Canyon Lake’s, it is less healthy than 87%: its national edge comes with its incomes.
Canyon Lake beats the California average on 11 of 32 CDC measures and trails it on 10. 25% of adults have been diagnosed with depression in Canyon Lake.
| Canyon Lake | California towns | U.S. towns | |
|---|---|---|---|
| Depression (CDC PLACES) | 25% | 22% | 23% |
| Yearly checkup (CDC PLACES) | 75% | 72% | 79% |
| High blood pressure (CDC PLACES) | 36% | 31% | 35% |
| Obesity (CDC PLACES) | 35% | 29% | 35% |
| What stands out | Canyon Lake | CA |
|---|---|---|
| Fewer uninsured adults | 6.2% | 10.6% |
| Fewer adults facing food insecurity | 12.7% | 17.9% |
| More adults who have had cancer | 9.5% | 6.4% |
CDC PLACES 2025 · modeled estimates for adults · CMS · HRSA
The typical Canyon Lake home is worth about $704,000, up 2.2% in a year, 8% below the California typical home.
| Canyon Lake | California towns | U.S. towns | |
|---|---|---|---|
| Median rent | $2,608 a month | $1,895 a month | $1,185 a month |
| Households that own their home | 85% | 64% | 73% |
| Renters paying 30%+ of income on rent | 40% | 55% | 48% |
Zillow Home Value Index · Redfin Data Center
Museums, parks, gardens and other places to visit around Canyon Lake. Close and well known come first.
 Big draw39 mi Theme parkDisneyland17.3M visitors a year
 Big draw36 mi Stadium & arenaAngel Stadium of Anaheim
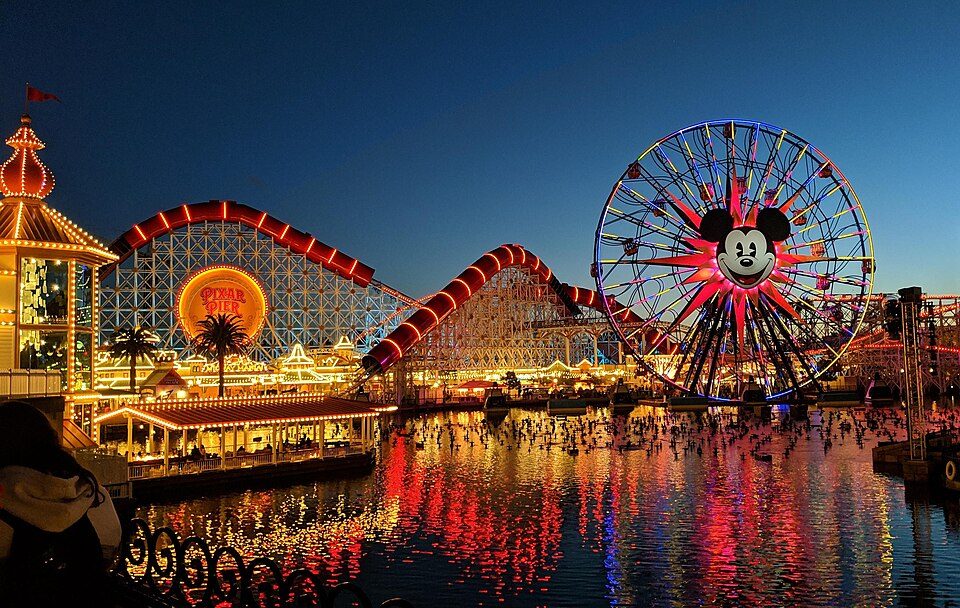 Big draw39 mi Theme parkDisney California Adventure10.1M visitors a year
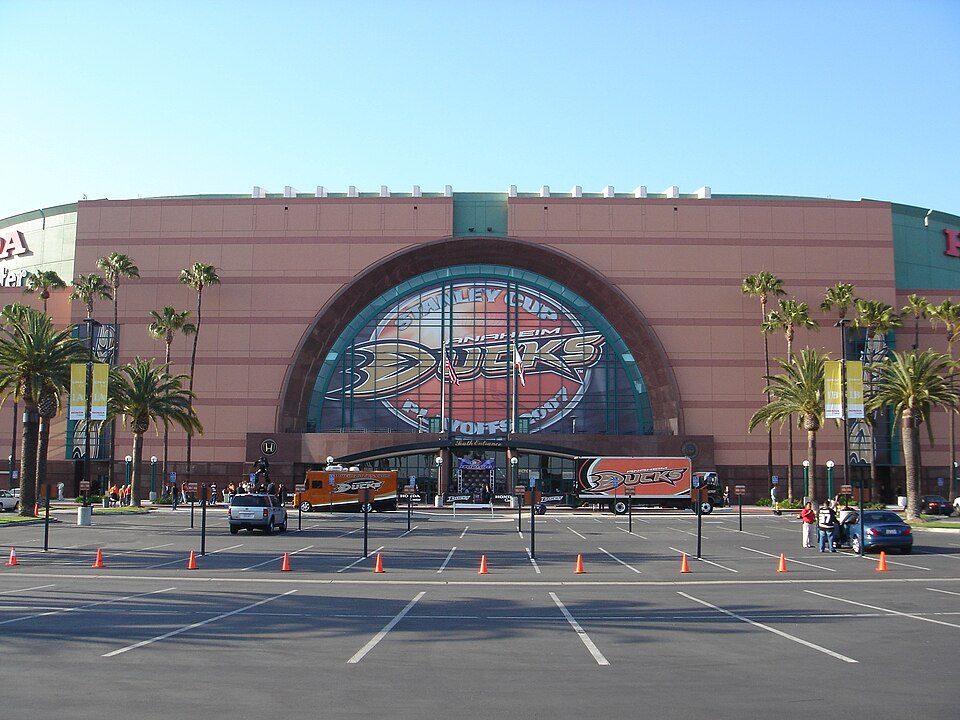 36 mi Stadium & arenaHonda Center
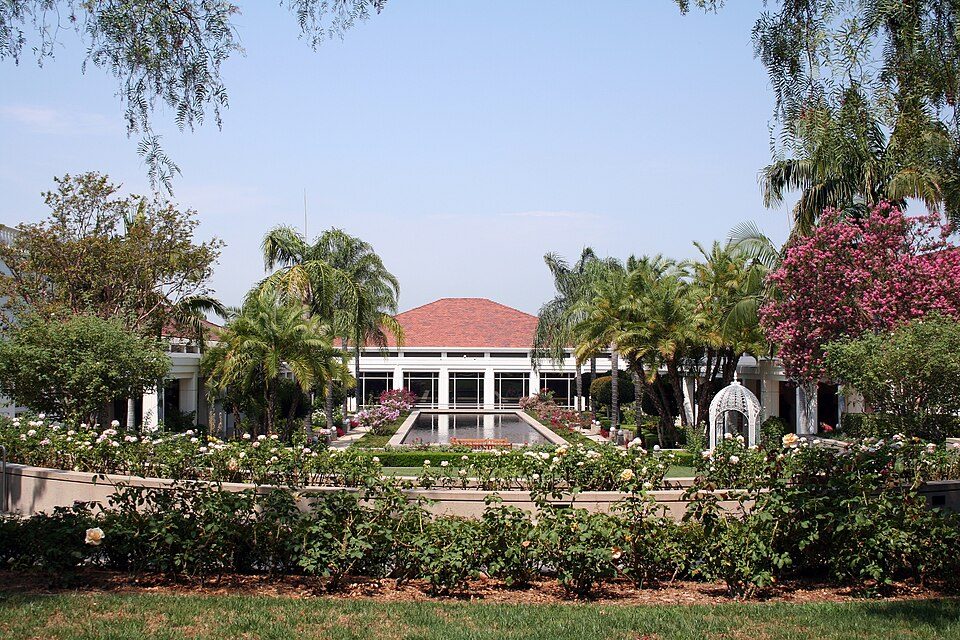 35 mi MuseumRichard Nixon Presidential Library and Museum
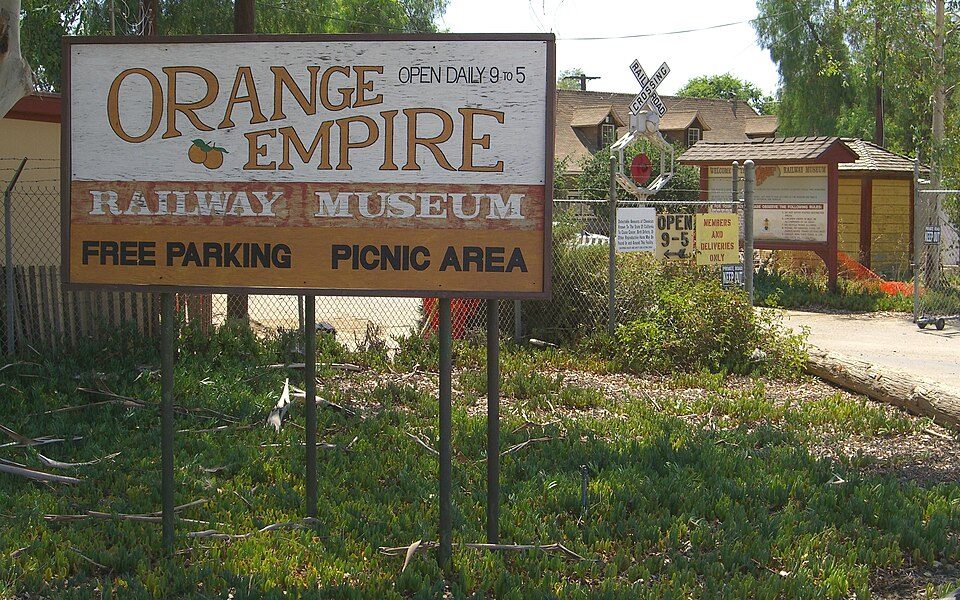 5 mi MuseumOrange Empire Railway Museum
Disneyland: HarshLight from San Jose, CA, USA, CC BY 2.0 · Angel Stadium of Anaheim: Staff Sgt. Chad McMeen, Public domain · Disney California Adventure: CrispyCream27, CC BY-SA 4.0 · Honda Center: Arnold C (Buchanan-Hermit), Attribution · Richard Nixon Presidential Library and Museum: The original uploader was Sorcha at English Wikipedia., CC BY-SA 2.5 · Orange Empire Railway Museum: The original uploader was Pretzelpaws at English Wikipedia., CC BY-SA 3.0
2 within 15 miles of the center of Canyon Lake
About 4 of every 100 Canyon Lake residents are enrolled in college, against 8 across California.
City in California, United States
Canyon Lake is a city and gated community in the Inland Empire region of Riverside County, California, United States, located on Canyon Lake reservoir. Canyon Lake began as a master-planned community developed by the Corona Land Company in 1968. The City of Canyon Lake was incorporated on December 1, 1990. As of the 2020 census, Canyon Lake had a population of 11,082. Railroad Canyon Dam was built in 1927, and impounds the San Jacinto River to fill the reservoir, which covers 383 acres (1.55 km2) and has 14.9 miles (24.0 km) of shoreline.
From Wikipedia, licensed CC BY-SA 4.0 · facts via Wikidata (CC0)
3 towns share a border with Canyon Lake.
It grades higher overall than all 3 graded towns on its borders; Menifee (C−) comes closest.
| Town | CA rank | Overall | Cost | Safety | Schools | Health |
|---|---|---|---|---|---|---|
| Canyon Lake | #285 | C+ | D− | A− | B− | B |
| Lake Elsinore | #580 | D | D− | C | B− | C+ |
| Menifee | #449 | C− | D− | B | B | B− |
| Meadowbrook | #663 | D | C | — | C+ | D |
Meadowbrook reports no FBI crime data of its own. Compare Canyon Lake with a neighbor →
Short answers, built from the data on this page.
Canyon Lake grades C+ overall, better than 39% of U.S. towns and #285 of 841 in California. It grades B for health, A− for safety and B− for schools. Cost of living is its weak spot, with a D−.
Yes. Cost of living, which also weighs rents, property taxes and how many households pay 30% or more of their income for housing, grades D−.


