
Laquintadusk, 2006
La Quinta’s story
96 years in pictures
Census counts: 3,328 in 1980, 37,558 in 2020. The archive holds 7 old photos and papers going back to 2006 and 4 maps from 1941 on.
- 1930La Quinta is settled
Each edition grades its towns against each other only.

A town of 39,440, settled in 1930.
La Quinta earns a D, 566th among California's 841 graded towns. One bright spot: it has 120 miles of trail. La Quinta’s July high is 107°F, above both the California town median (89°F) and the median of U.S. towns (85°F). La Quinta has 1 place on the National Register. Homes are expensive, about $739K for a typical one and 8.2 times the Riverside metro’s $90K median household income.
Where La Quinta beats most towns, and one thing worth knowing.
17.5% of the town is conserved land, across 16 parks and preserves.
Each subject compared with towns across the country (schools within California), ordered by how far La Quinta is from typical.
How TownRatings grades towns →
Census counts: 3,328 in 1980, 37,558 in 2020. The archive holds 7 old photos and papers going back to 2006 and 4 maps from 1941 on.
Who provides power, water and the rest in La Quinta, and how to reach them.
EPA SDWIS (Oct 9, 2026) · HIFLD + EIA-861 2025 · Census 2020 ZCTAs · NCES 2024–25 · registration: vote.gov, updated Nov 18, 2024.
Ordered by what stands out in La Quinta.
La Quinta is a second-home town, has more 90° days than nearly all U.S. towns and has home values still below their peak.
La Quinta’s trail density is 3.4 miles per square mile. Santa Rosa Wilderness, at 952 acres with 1.4 miles of trail, is the biggest park or preserve.
| Biggest places to walk | Trails | Acres |
|---|---|---|
| 1. Santa Rosa and San Jacinto Mountains National Monument | 5.6 mi | 4,589 |
| 2. Cove Oasis | 2.1 mi | 449 |
| 3. Santa Rosa Wilderness | 1.4 mi | 952 |
Trails & parks © OpenStreetMap contributors · Conserved land: USGS PAD-US
Its public schools are run by the Desert Sands Unified school district. Two of its 9 schools are below, each with why it’s listed. The largest public high school is La Quinta High, with 2,425 students.
| School | Level | Students | Letter |
|---|---|---|---|
| La Quinta MiddleLargest public middle schoolGrades 6–8 | Grades 6–8 | 709 | C− |
| La Quinta HighLargest public high schoolGrades 9–12 | Grades 9–12 | 2,425 | B+ |
NCES · EDFacts · graded within CA on state tests and graduation
Expected storm and flood damage is higher than in 85% of U.S. communities. Since 2004, 38 flood insurance claims have been paid out in La Quinta.
FEMA flood insurance claims · FEMA National Risk Index · OpenFEMA
27.7% of homes are seasonal or vacation homes, against 2.4% statewide, which helps explain the older median age.
People 65 and older are 32% of residents (16% statewide); adults 18 to 34 are 16% of residents (24% statewide). The median age in La Quinta is 53.3 years. La Quinta has grown 4.5% since 2020, to 39,440 residents in the Census Bureau’s 2025 estimate.
| La Quinta | California towns | U.S. towns | |
|---|---|---|---|
| Aged 65 or older | 32% | 16% | 18% |
| Median age | 53.3 years | 39 years | 40.5 years |
| Under 18 | 17% | 22% | 22% |
| Bachelor’s degree or more, 25+ | 40% | 29% | 29% |
49% women, 51% men
That’s an even split within the survey’s margin of ±1.8 points. Across California, 50.1% of residents are women.
| La Quinta | CA | U.S. | |
|---|---|---|---|
| Under 10 | 9.8% | 11.4% | 11.6% |
| 10 to 17 | 6.7% | 10.5% | 10.3% |
| 18 to 24 | 6.1% | 9.1% | 9.1% |
| 25 to 34 | 9.4% | 14.8% | 13.7% |
| 35 to 44 | 10.7% | 13.9% | 13.2% |
| 45 to 54 | 9.2% | 12.5% | 12.2% |
| 55 to 64 | 16.4% | 12.1% | 12.7% |
| 65 to 74 | 17.6% | 9.2% | 10.2% |
| 75 and older | 14% | 6.5% | 7% |
| No diploma | 7.3% | 15.3% | 10.4% |
| High school | 21.4% | 20.5% | 26% |
| Some college | 22% | 19.3% | 19.1% |
| Associate’s | 9.4% | 7.9% | 8.8% |
| Bachelor’s | 24.4% | 22.7% | 21.6% |
| Graduate | 15.6% | 14.4% | 14.1% |
Census population estimates, 2025 · U.S. Census Bureau · ACS 2020-2024 5-year estimates
Reported crimes fell from 1,015 to 745 over the last three FBI years, a drop beyond ordinary year-to-year swings.
Within California, it does better than 57% of towns.
| La Quinta | California towns | U.S. towns | |
|---|---|---|---|
| Property crimes per 1,000 (2025) | 16.9 per 1,000 residents | 13.3 | 9.9 |
| Violent crimes per 1,000 (2025) | 1.5 per 1,000 residents | 2.9 | 1.6 |
FBI crime data, 2025 · crimes reported to police
The Indio Fire Stn weather station, 6 miles away, records that about 184 days a year reach 90°, more than in 100% of U.S. towns. January nights average 44.5°, milder than in 97% of U.S. towns; July afternoons average 106.6°.
La Quinta has warm winters and scorching summers, with very little rain. Snow is almost unheard of.
NOAA U.S. Climate Normals, 1991–2020
Most working residents leave La Quinta for work: only 13% work in town. Jobs based in La Quinta grew to 11,429 in 2023, 1,377 more than in 2013. 18% of La Quinta workers work from home.
| La Quinta | California towns | U.S. towns | |
|---|---|---|---|
| Work from home | 18% | 14% | 11% |
| Working residents who work in town | 13% | 6.6% | 8% |
| Median household income | $99,000 | $95,000 | $80,000 |
| Average trip to work | 26 minutes | 28 minutes | 25 minutes |
Census LEHD 2023 · ACS
Against the 8,714 U.S. towns with household incomes like La Quinta’s, it is less healthy than 63%: its national edge comes with its incomes.
La Quinta beats the California average on 13 of 32 CDC measures and trails it on 8. 39% of adults have high blood pressure in La Quinta.
| La Quinta | California towns | U.S. towns | |
|---|---|---|---|
| Binge drink (CDC PLACES) | 13% | 16% | 16% |
| High blood pressure (CDC PLACES) | 39% | 31% | 35% |
| Frequent mental distress (CDC PLACES) | 15% | 17% | 17% |
| Yearly checkup (CDC PLACES) | 77% | 72% | 79% |
| What stands out | La Quinta | CA |
|---|---|---|
| Fewer adults facing food insecurity | 13.9% | 17.9% |
| Fewer adults facing housing insecurity | 11.8% | 14.9% |
| More adults who have had cancer | 10.8% | 6.4% |
CDC PLACES 2025 · modeled estimates for adults · CMS · HRSA
The typical value, about $739K, is 9% below its July 2022 peak.
The typical La Quinta home is worth about $739,000, up 0.5% in a year, close to the California typical home.
| La Quinta | California towns | U.S. towns | |
|---|---|---|---|
| Median rent | $1,785 a month | $1,898 a month | $1,185 a month |
| Households that own their home | 76% | 64% | 73% |
Zillow Home Value Index · Redfin Data Center
Museums, parks, gardens and other places to visit around La Quinta. Close and well known come first.
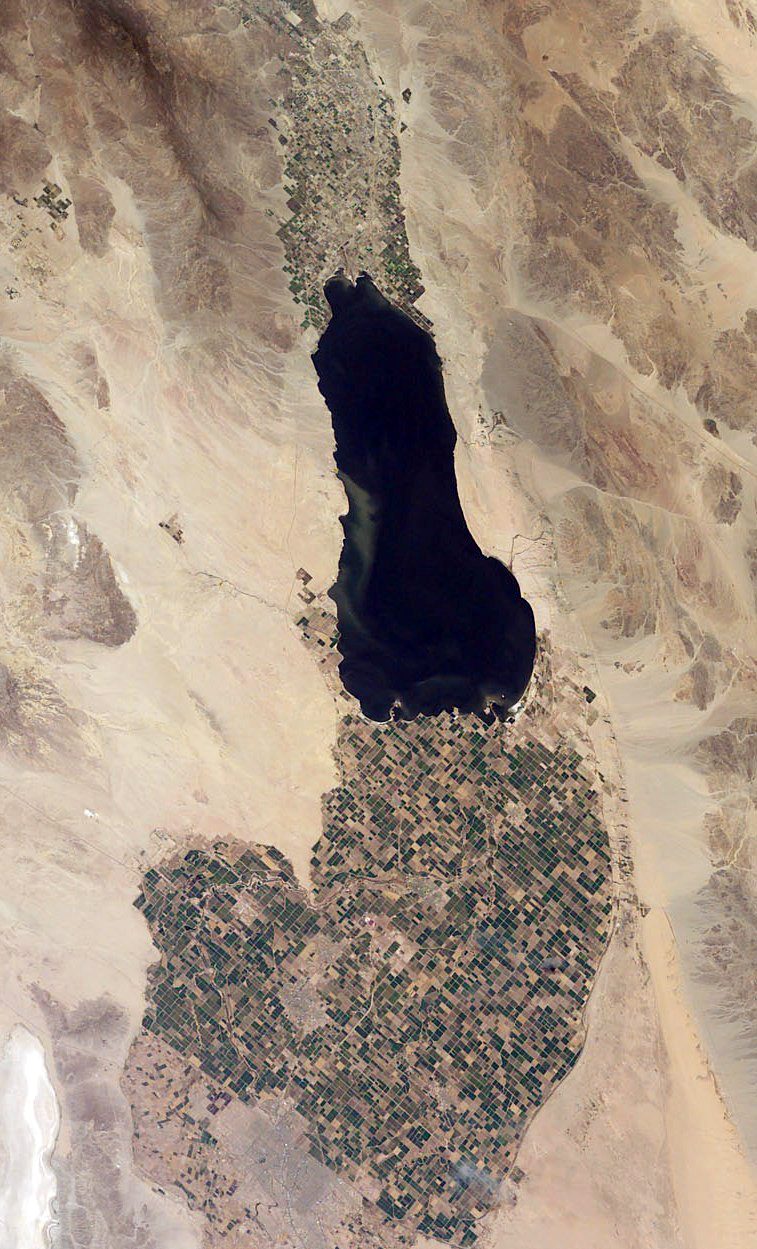 Big draw32 mi LakeSalton Sea
 Big draw15 mi National ParkJoshua Tree National Park2.9M visitors a year
 11 mi Stadium & arenaAcrisure Arena
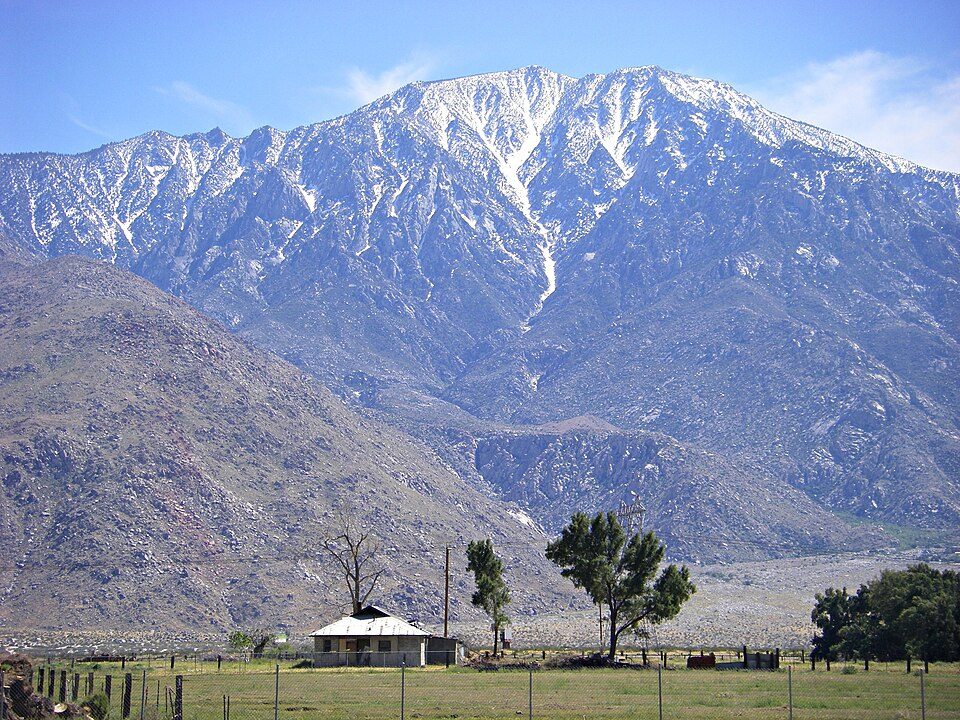 27 mi MountainSan Jacinto Peak
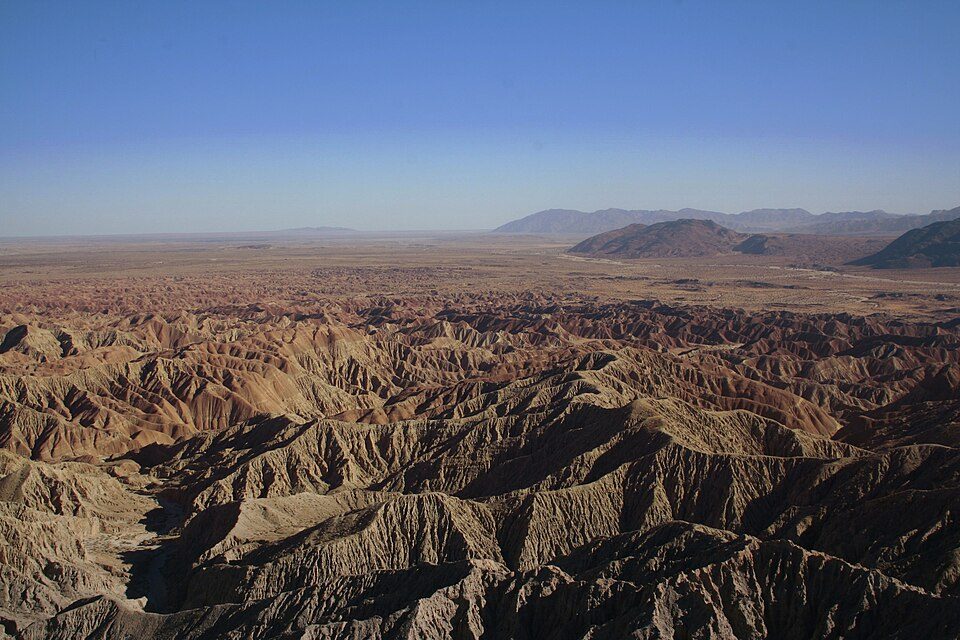 27 mi State parkAnza-Borrego Desert State Park16 mi LandmarkForest Lawn Cemetery
Salton Sea: NASA, Public domain · Joshua Tree National Park: Sergiy Galyonkin, CC BY-SA 4.0 · Acrisure Arena: TheAHL, CC BY 2.0 · San Jacinto Peak: Wattewyl, CC BY 3.0 · Anza-Borrego Desert State Park: No machine-readable author provided. Miskatonic assumed (based on copyright clai, CC BY 2.5
2 within 15 miles of the center of La Quinta
About 6 of every 100 La Quinta residents are enrolled in college, against 8 across California.
City in California, United States
La Quinta (Spanish for "the country estate") is a desert resort city in Riverside County, California, United States. Located between Indian Wells and Indio, it is one of the nine cities of the Coachella Valley. The population was 37,558 at the 2020 census, up from 37,467 at the 2010 census. Golf courses include La Quinta Resort and Club, a resort dating to 1926, where director Frank Capra wrote the screenplay for Lost Horizon, and SilverRock Golf Resort, which hosts the annual Bob Hope Chrysler Classic PGA golf tournament.
From Wikipedia, licensed CC BY-SA 4.0 · facts via Wikidata (CC0)
4 towns share a border with La Quinta.
| Town | CA rank | Overall | Cost | Safety | Schools | Health |
|---|---|---|---|---|---|---|
| La Quinta | #566 | D | D− | C | C+ | B |
| Indio | #577 | D | D | C+ | B | C |
| Indian Wells | #213 | B− | C− | C+ | B | B+ |
| Bermuda Dunes | #433 | C | D | — | B | B |
| Vista Santa Rosa | — | — | C | — | C− | C− |
Vista Santa Rosa has fewer than 2,500 residents, so it gets subject grades but no overall grade. Bermuda Dunes and Vista Santa Rosa report no FBI crime data of their own. Compare La Quinta with a neighbor →
Short answers, built from the data on this page.
La Quinta grades D overall, better than 14% of U.S. towns and #566 of 841 in California. It grades B for health, C for safety and C+ for schools. Cost of living is its weak spot, with a D−.
Within California, it does better than 57% of towns.
Yes. Cost of living, which also weighs rents, property taxes and how many households pay 30% or more of their income for housing, grades D−.


