Good on most counts; one lags. It does especially well on health: residents are healthier than 92% of U.S. towns on CDC estimates. Walkability is a strength too: it is more walkable than 98% of U.S. towns. What counts against it is cost of living: the typical home is worth about $915K, 6.7 years of the San Francisco metro’s $136K median household income. Hazard risk is weaker too (D): FEMA rates its natural-hazard risk higher than 88% of U.S. communities, with earthquakes at the top. The overall grade comes out at B, better than nearly three fifths of U.S. towns. In the ranking it comes 143rd of 841 in California. The biggest park or preserve is Wildcat Canyon Regional Park, at 30 acres.
Figures: health, CDC PLACES · home values, Zillow · incomes, Census ACS, 2020–24 · FEMA National Risk Index · OpenStreetMap.
Its grades run from A+ for walkability (better than 98% of comparable towns) to D for hazard risk (better than 8%), so the B overall blends very different results.
Ordered by what stands out in East Richmond Heights.
East Richmond Heights has milder winter nights than nearly all U.S. towns, has less no health insurance than most of California and sends most of its workers to San Francisco and beyond.
There are 1.9 miles of trail across 2 parks and preserves. In East Richmond Heights, the trail network density is 3.2 miles per square mile, above both California’s towns (1.0) and U.S. towns (0.4).
The public schools here belong to the West Contra Costa Unified school district. Two of its 3 schools are shown below, with the reason for each. Enrollment at East Richmond Heights’s public school: 510 students.
Its widest gap with California is no health insurance: 4.7% of those 18–64 have no health insurance, against 10.6% statewide. Against the 4,081 U.S. towns with household incomes like East Richmond Heights’s, it is healthier than 76%, a smaller edge than it has nationally: part of it comes with its incomes.
Among adults in East Richmond Heights, 15% binge drink. 7.5% of East Richmond Heights adults smoke cigarettes, below both the California town median (11%) and the median of U.S. towns (14%). The town does better than the California average on 18 of 32 CDC measures and worse on 2.
92%healthier than U.S. townsAHealth Grade
East Richmond Heights
California towns
U.S. towns
Frequent mental distress (CDC PLACES)
14%
17%
17%
Smoke cigarettes (CDC PLACES)
7.5%
11%
14%
Frequent physical distress (CDC PLACES)
11%
14%
14%
Fair or poor health (CDC PLACES)
15%
22%
19%
32 measures vs. California
18 better12 too close to call2 worse
What stands out
East Richmond Heights
CA
Fewer uninsured adults
4.7%
10.6%
Fewer adults facing food insecurity
8.2%
17.9%
More adults who have had cancer
9%
6.4%
Alta Bates Summit Medical Center - Alta Bates Camp
Paid flood insurance claims in East Richmond Heights since 2024: 3. Expected losses in East Richmond Heights break down as 68% from earthquakes and 30% from inland flooding.
East Richmond Heights has 179 jobs for its 1,622 working residents: even if every job went to a resident, most would still commute out. The average commute takes 37.1 minutes, against 28.7 across California.
East Richmond Heights’ average trip to work is 37 minutes. Most working residents leave East Richmond Heights for work: only 1% work in town. It had 179 jobs in 2023, down 29 from 2013. For residents in the town, the share who live below the poverty line is 5.3%.
1%work in town
East Richmond Heights
California towns
U.S. towns
Average trip to work
37 minutes
28 minutes
25 minutes
Median household income
$135,000
$95,000
$80,000
Below the poverty line
5.3%
10%
9.6%
Working residents who work in town
0.9%
6.6%
8%
Where working residents work
In East Richmond Heights1%
San Francisco18%
Oakland13%
Berkeley12%
Richmond6%
12 mi
median commute distance
179
jobs based in East Richmond Heights
A commuter town
jobs vs. working residents
A+
Walkability grade: more walkable than 98% of U.S. towns
For East Richmond Heights, the rent at the middle of the market is $2,071 a month. In East Richmond Heights, 85% of households live in a home they own.
Unincorporated community in California, United States
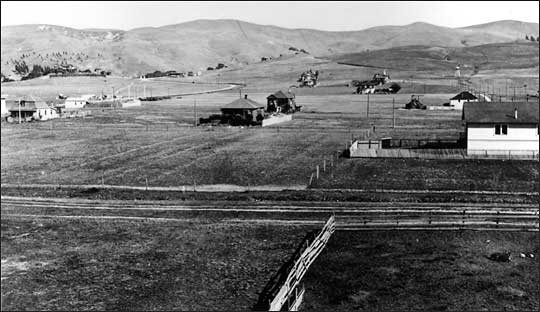
East Richmond Heights is an unincorporated community and census-designated place (CDP) in western Contra Costa County, California, United States. Its population was 3,460 at the 2020 census.
Is East Richmond Heights, CA a good place to live?
For most people who can afford it, yes. East Richmond Heights grades B overall, better than 59% of U.S. towns and #143 of 841 in California. It grades A for health and C+ for schools. Hazard risk is its weak spot, with a D.
Is East Richmond Heights, CA expensive?
Yes. The typical home is worth about $915,000, 20% above the California typical home. Cost of living, which also weighs rents, property taxes and how many households pay 30% or more of their income for housing, grades C−.