Towns, villages and London boroughs · England, Scotland, Wales and Northern Ireland
Best places to live in the UK. Explore every town in depth.
Each town gets detailed pages on 12 subjects, drawn from 28 public data sets: 14.1 million crime records, 277,000 listed buildings and monuments, 23,500 schools and 28.1 million property sales. How deep the data goes →
98Counties & council areas
2,160Towns graded
7,377Places
Browse by nation
Start with a nation
Each nation’s page has its counties or council areas, its biggest and best-graded towns, and a map. England has the most graded towns, 1,917.

UK rankings
All UK rankings →The best-graded towns in the UK
Discover the UK’s highest-rated towns and cities. These are the top 10 among 2,138 ranked places with populations of 2,500 or more, based on quality of life, affordability, schools, safety, and other measures.
See how each town compares within its county or council area, or explore our full UK rankings.
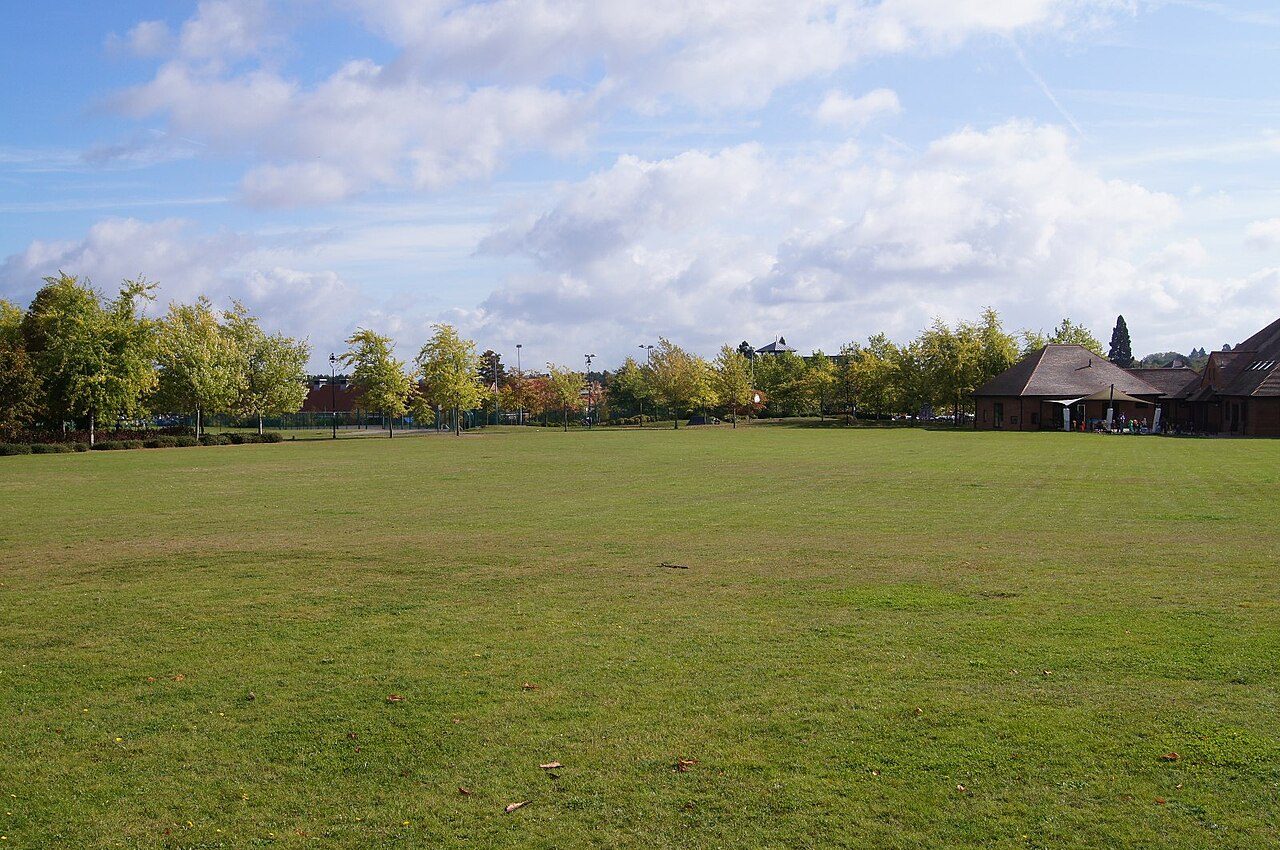
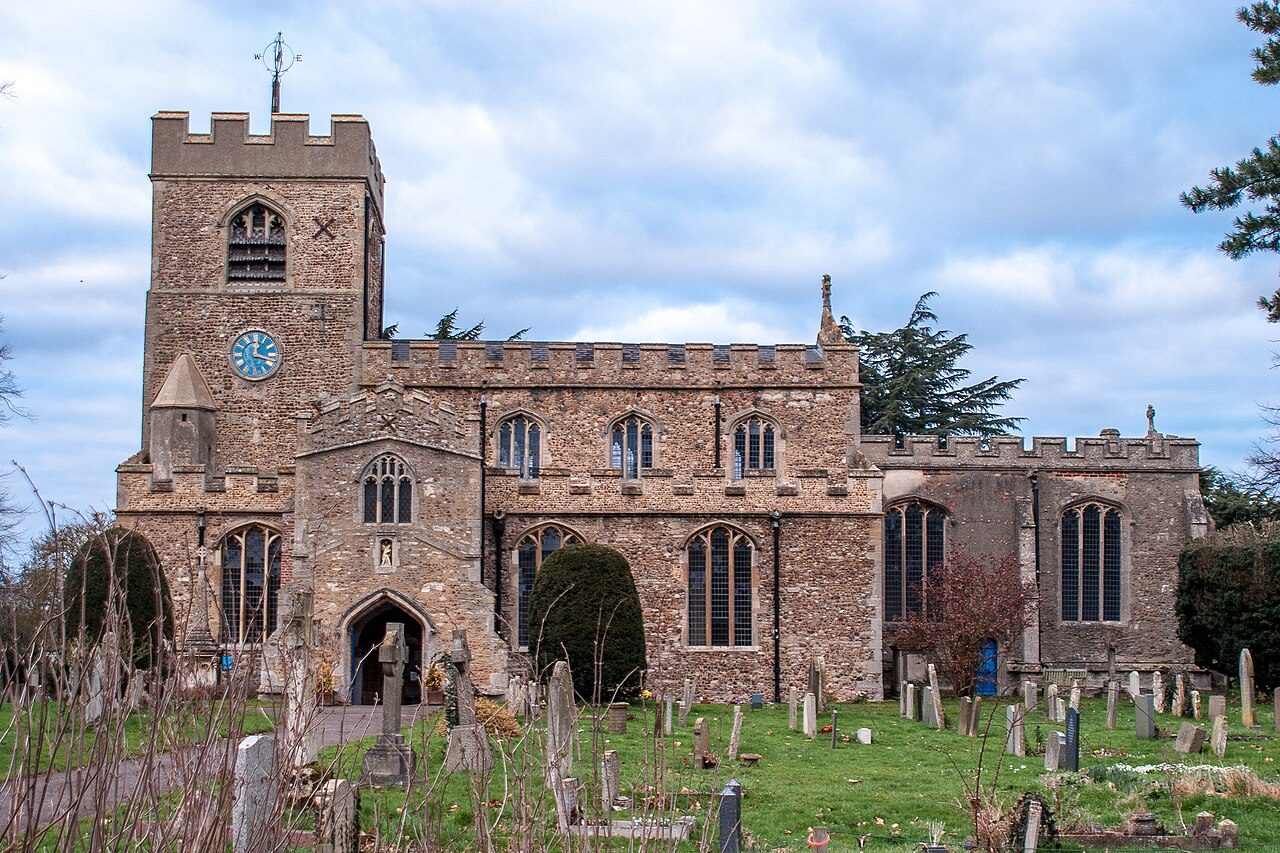

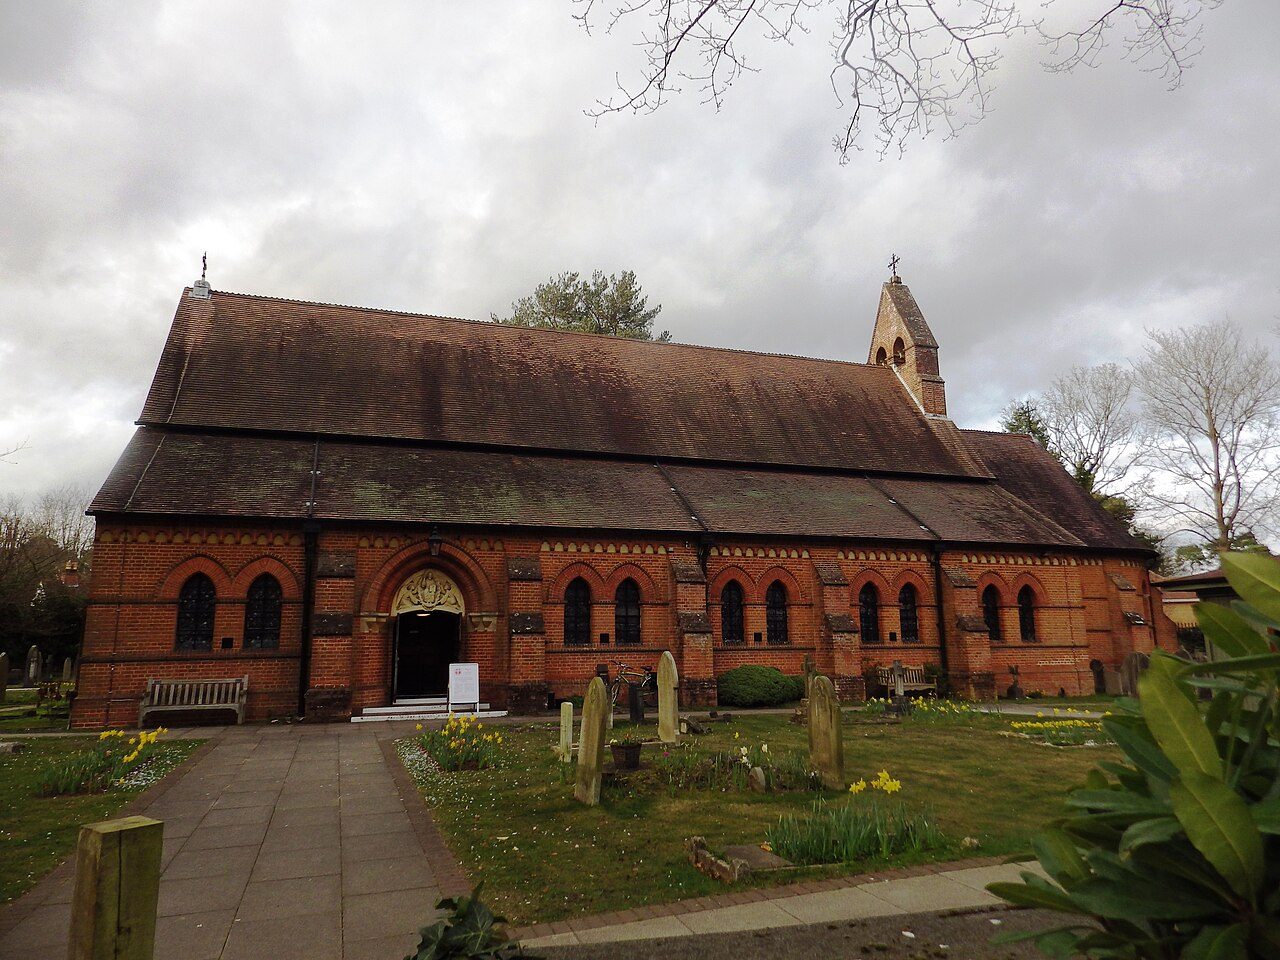
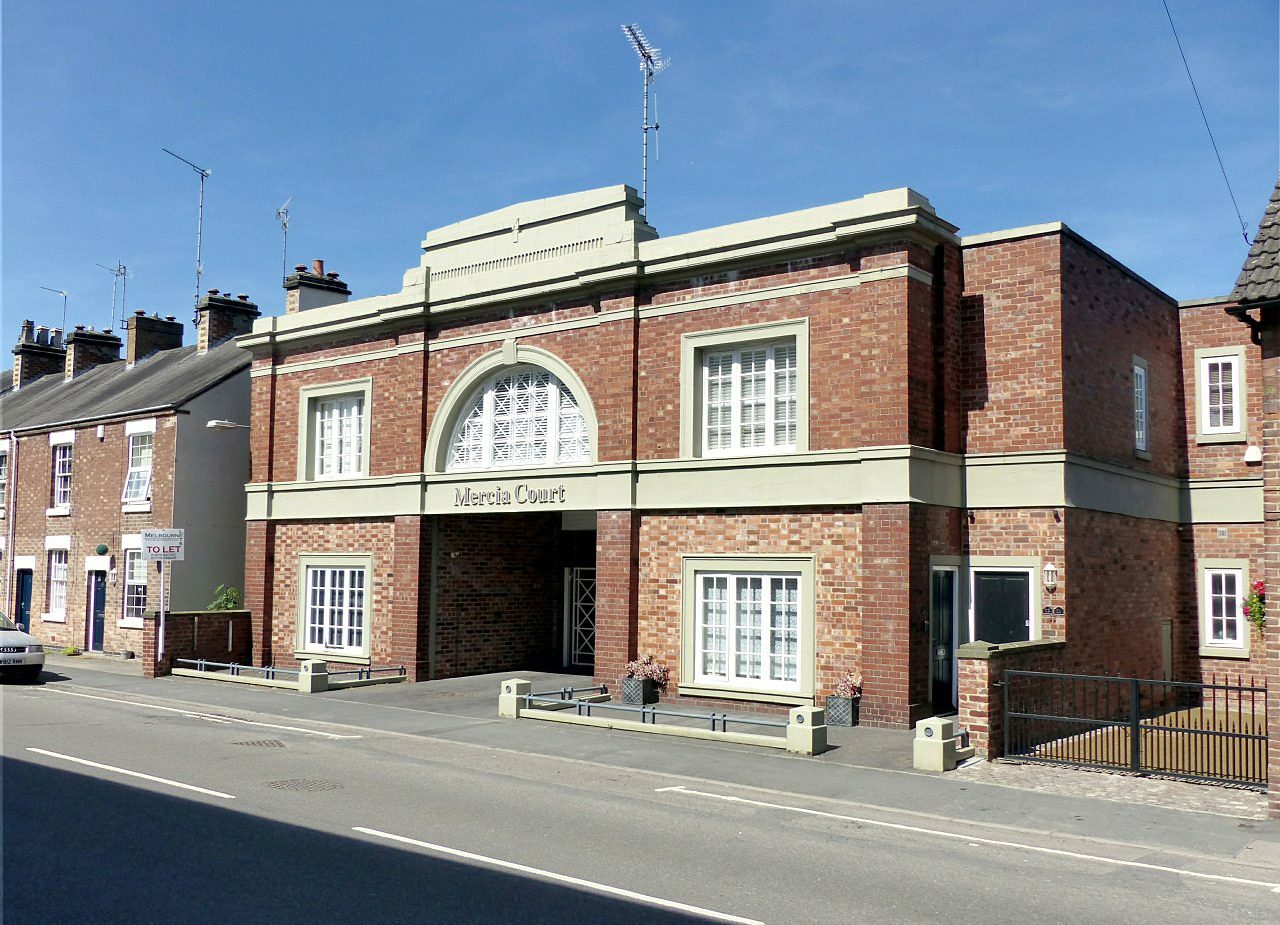
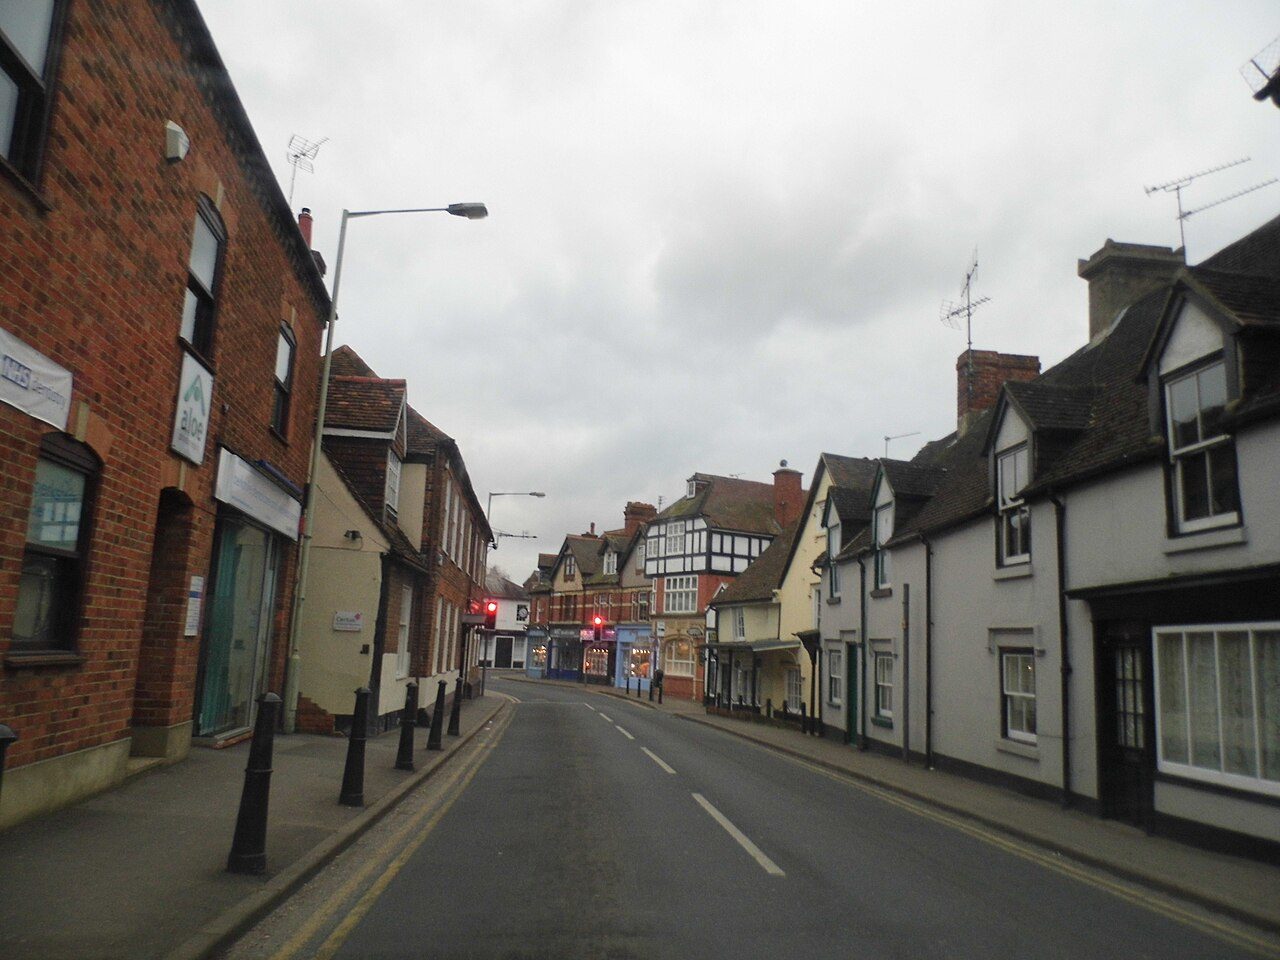
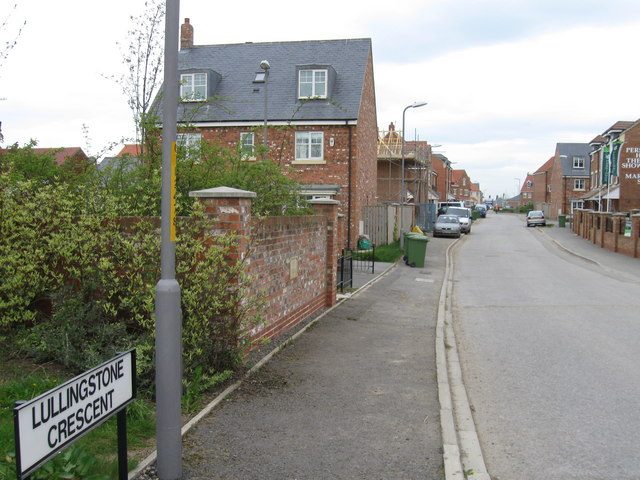
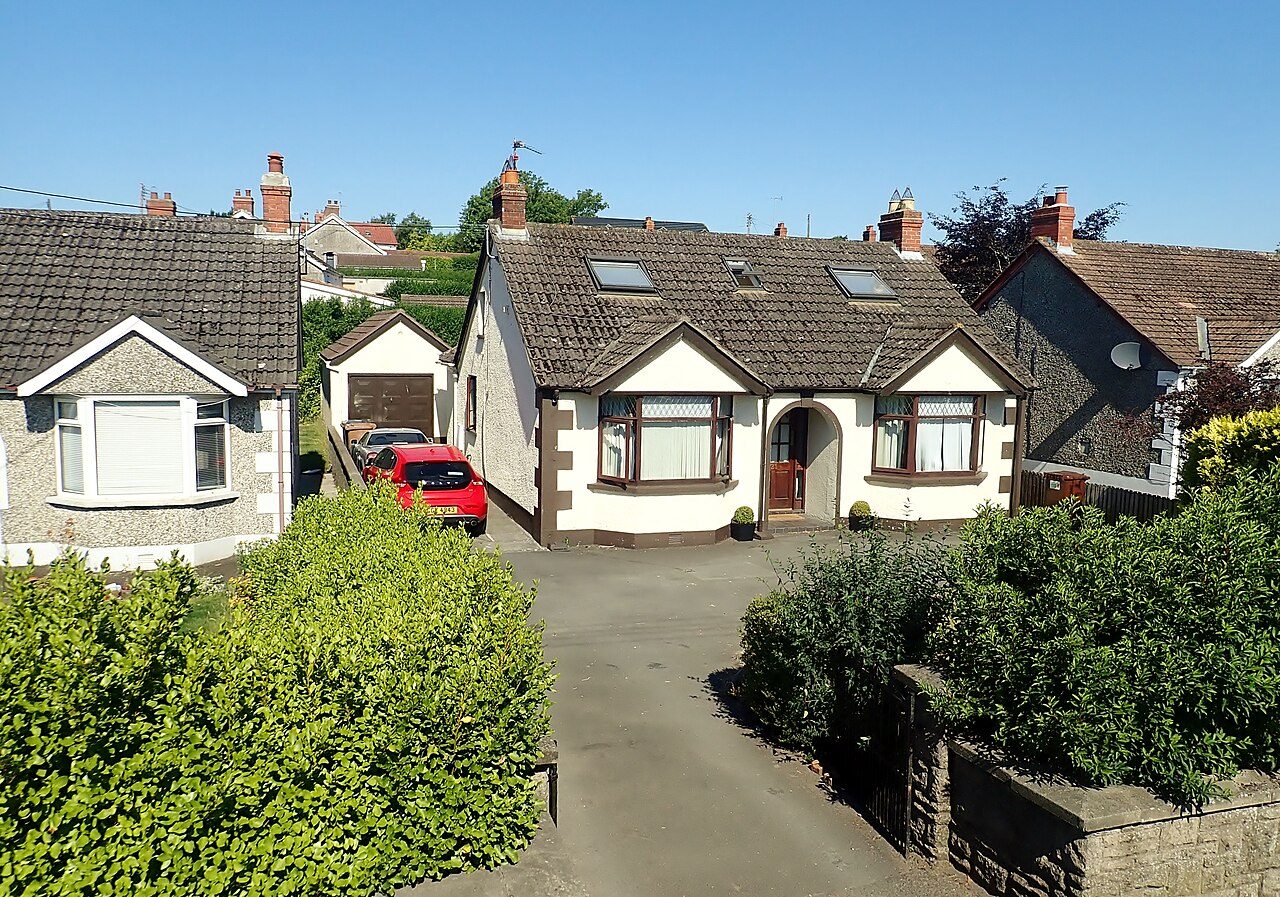
A note about our rankings: Our rankings cover 2,138 towns and cities across the UK. Another 22 places, primarily military garrisons and university campuses, receive grades but aren’t ranked. Scotland’s 296 towns aren’t included in the overall rankings yet because the detailed crime data needed for a Safety grade isn’t available. You can still explore individual Scottish towns, with grades for cost of living, schools, health, walkability, and flood risk. We expect to include them once new deprivation data becomes available. Northern Ireland’s 63 towns are included, with overall grades based on the five categories for which reliable data is available. Jobs and Flood Risk grades are excluded because the necessary local data isn’t published.
Most affordable
Cost of living grade: house prices and rents against local income

Safest
Crimes recorded by police.uk per resident
- 1
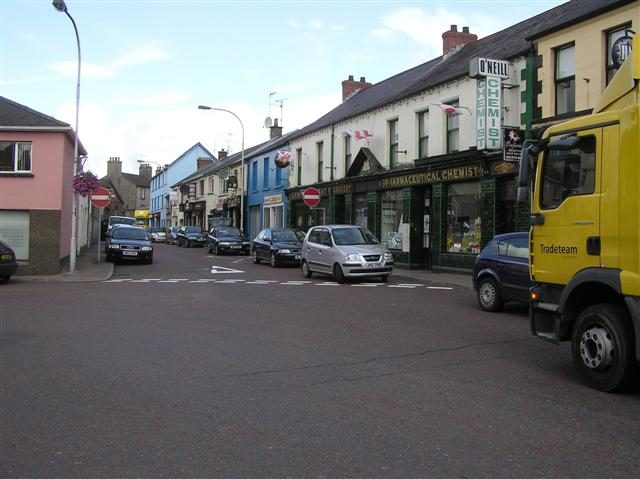
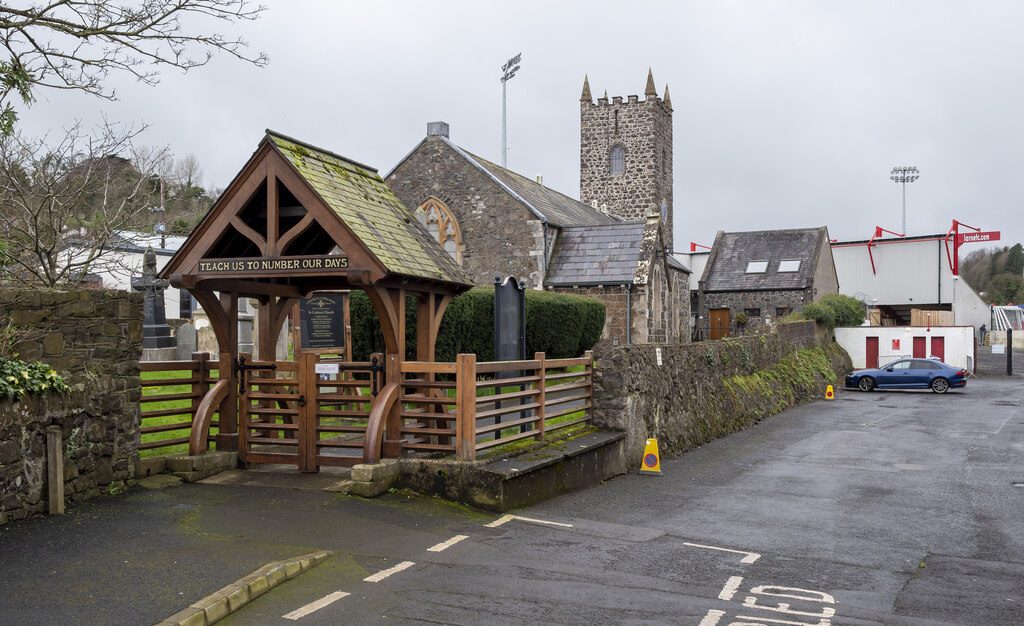
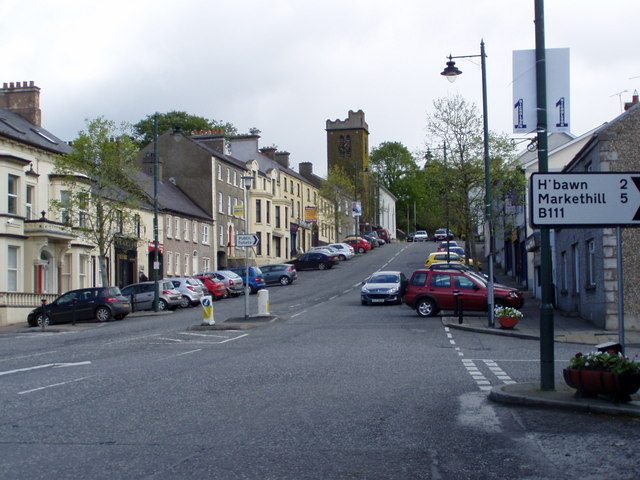 RichhillArmagh City, Banbridge and CraigavonA+
- 2
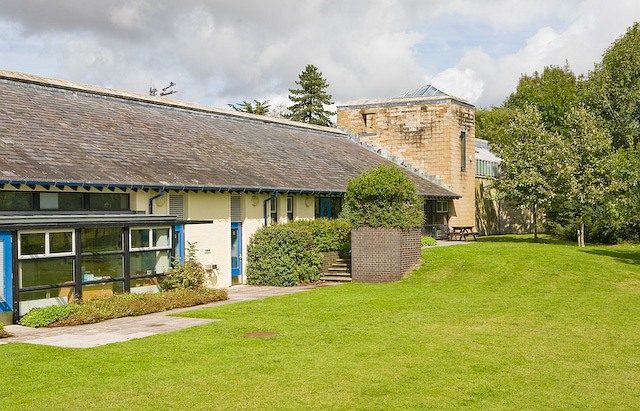 South WonstonHampshireA+
- 3
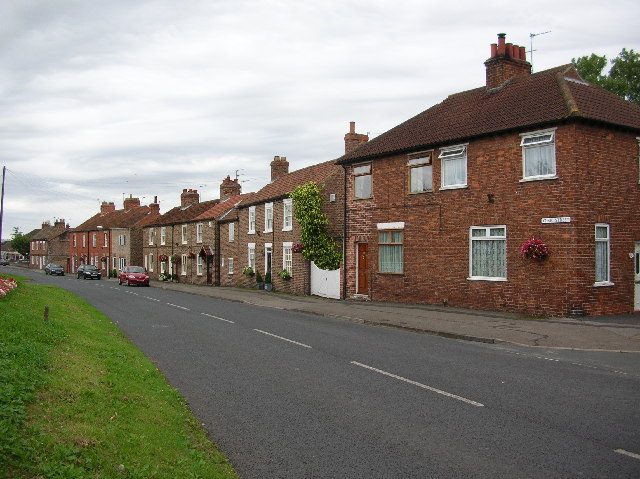 DunningtonNorth YorkshireA+
Best big cities
Overall grade, the 96 graded towns and cities of 100,000+
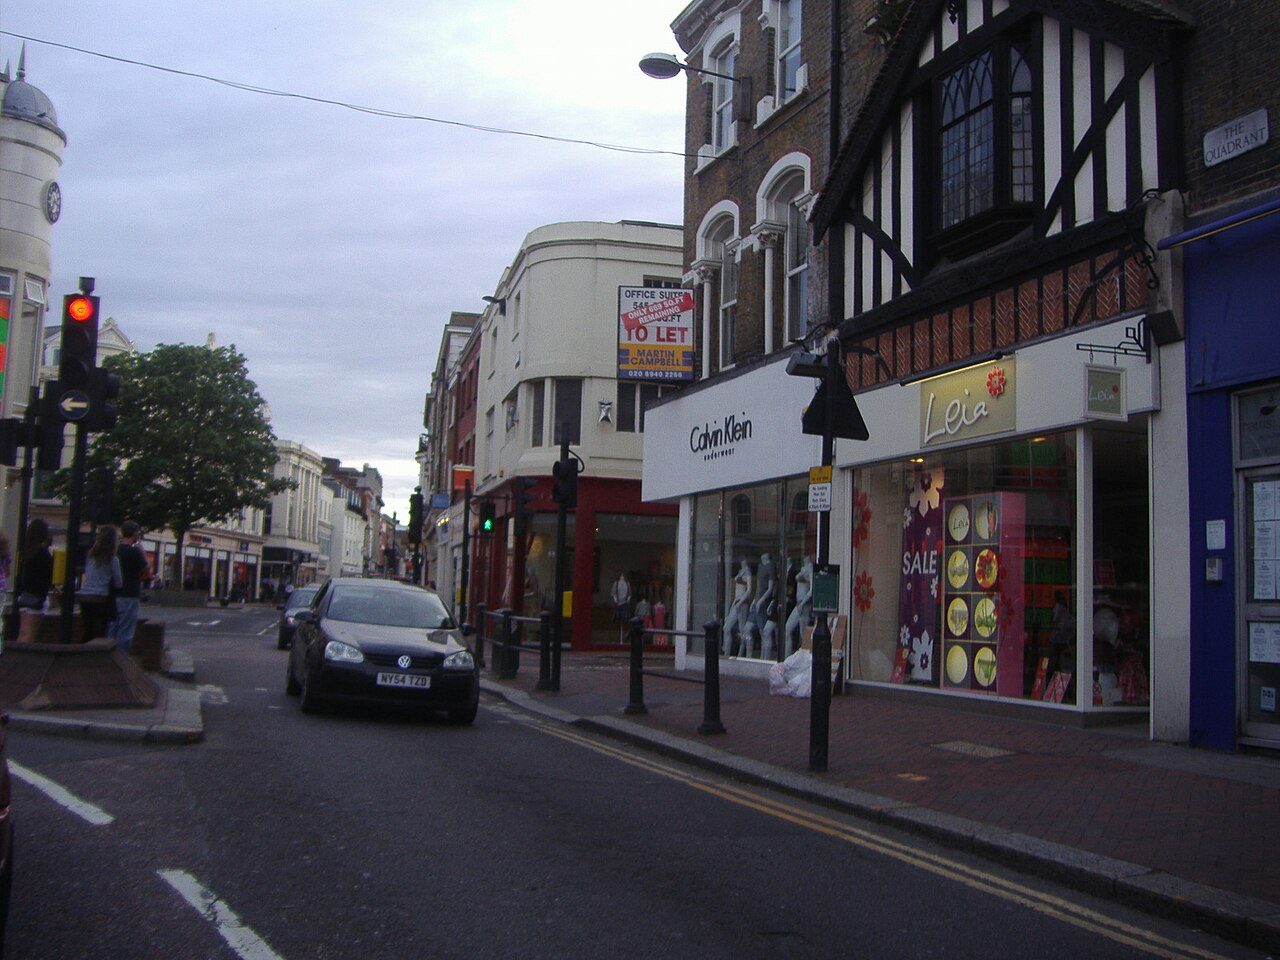
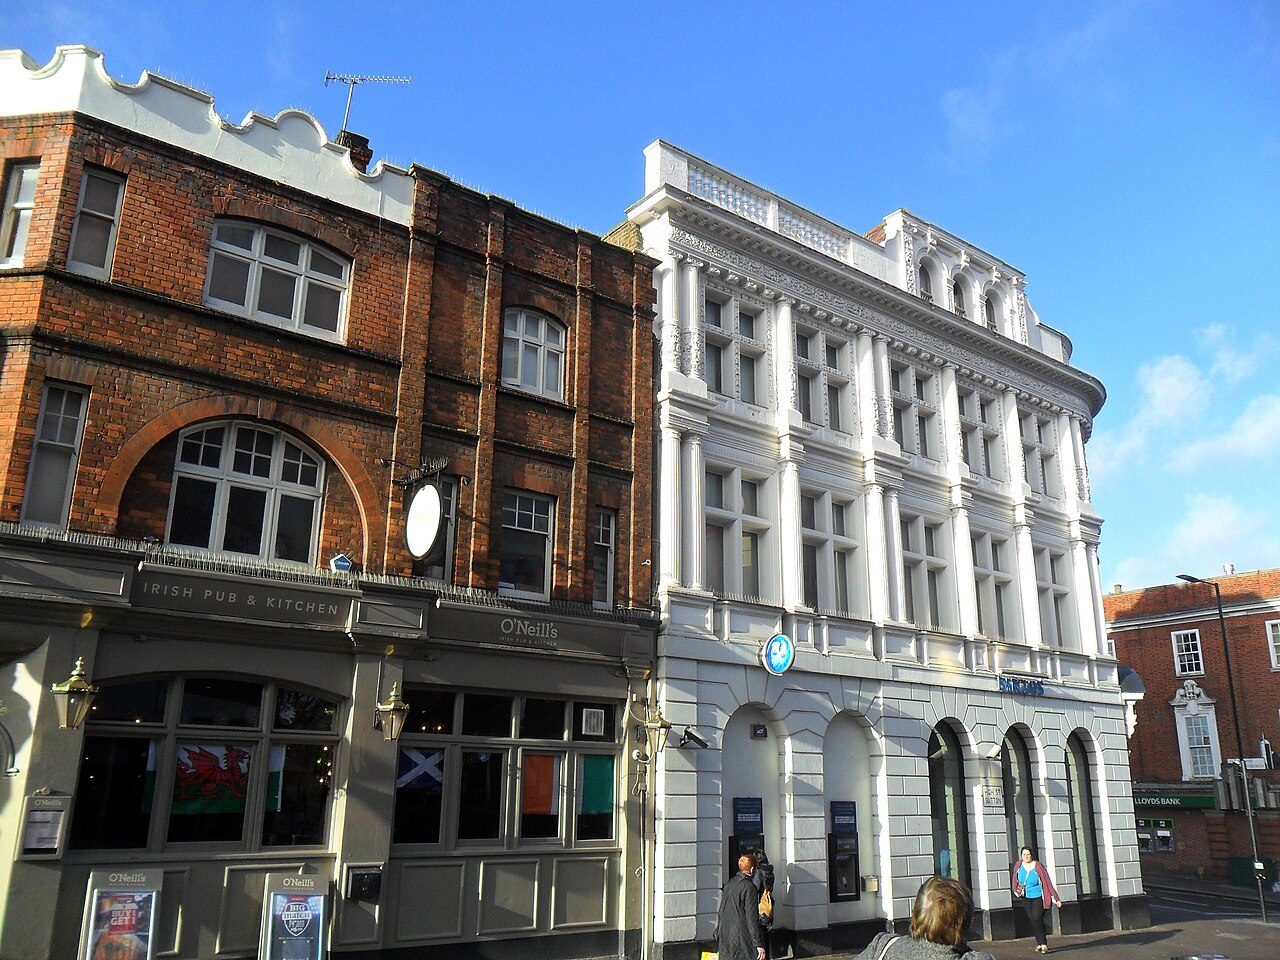

Compare towns
Compare any towns →Next door can be a world apart
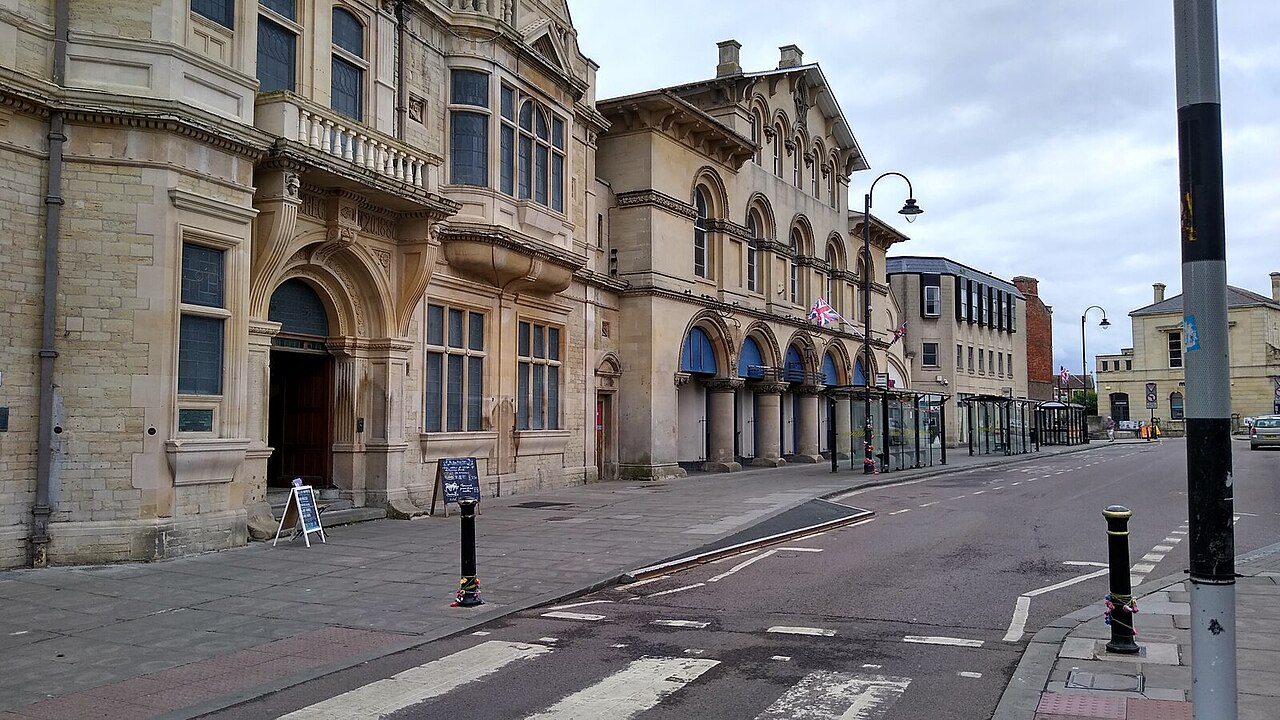
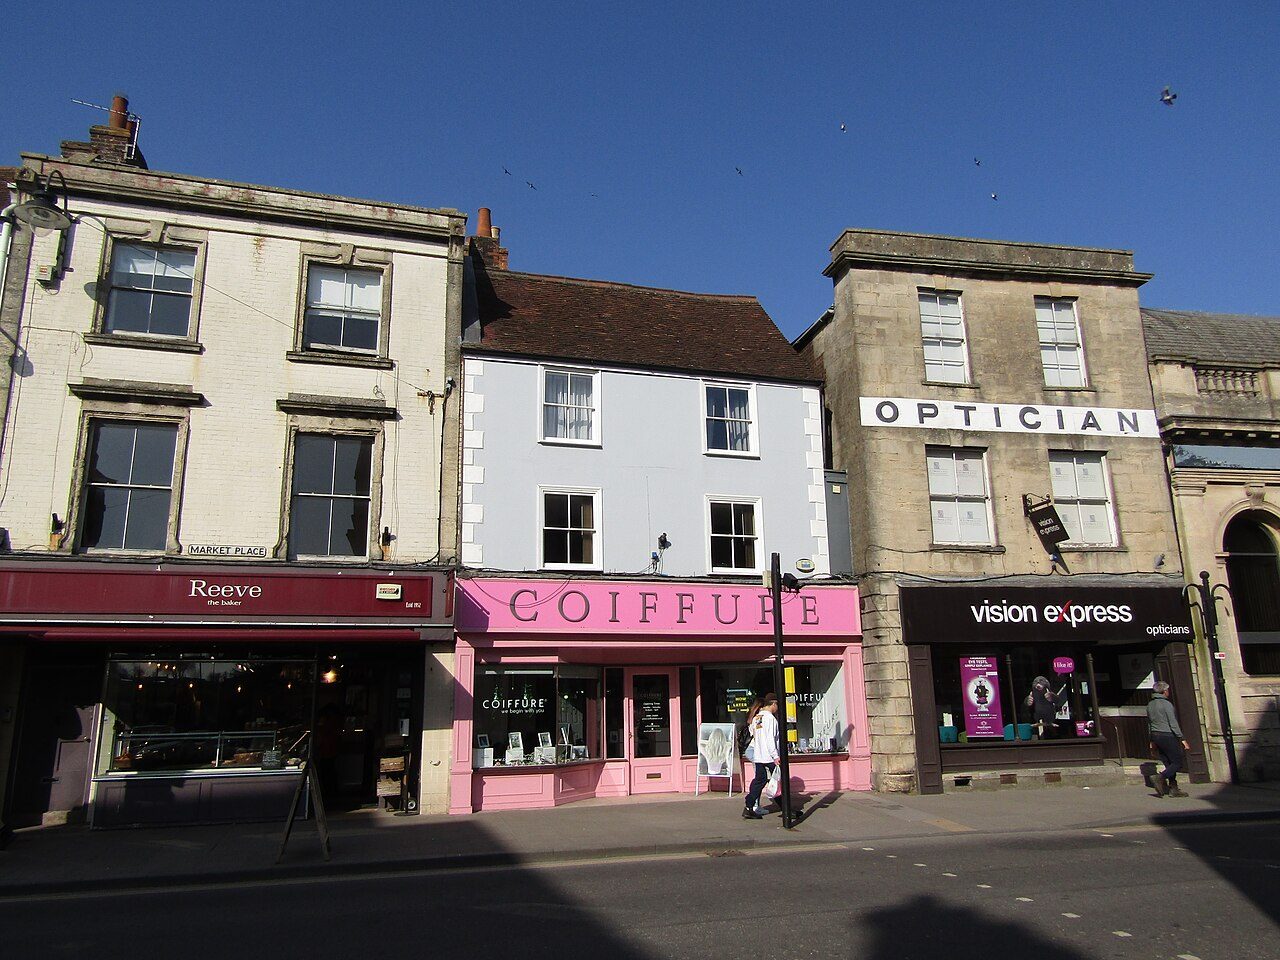
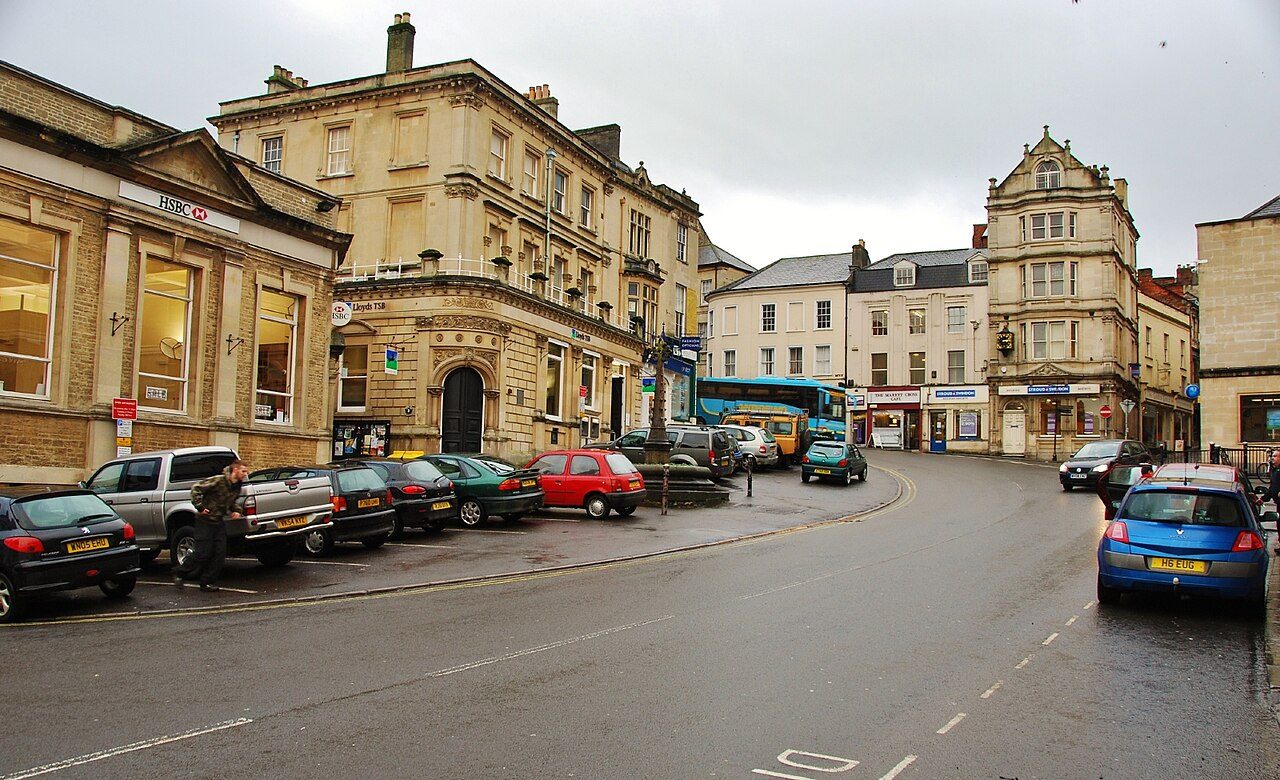
Set up to four towns side by side: house prices, schools, safety, commutes and more, row by row. Here’s Westbury beside its neighbours.
Town history
See Port Talbot’s history →Each town has a past. We went and found it.
Old photos and postcards, old maps and town plans, and every listed building and scheduled monument inside the town.
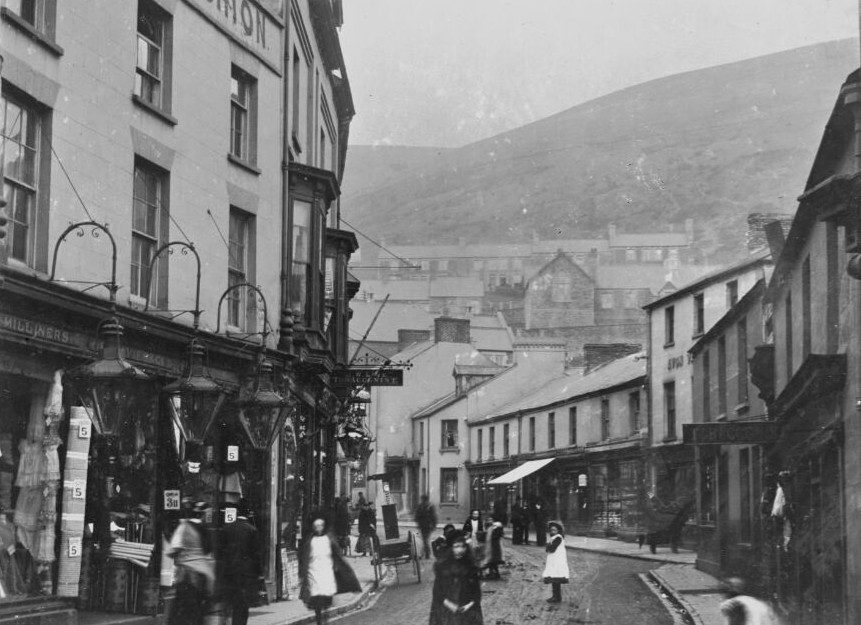
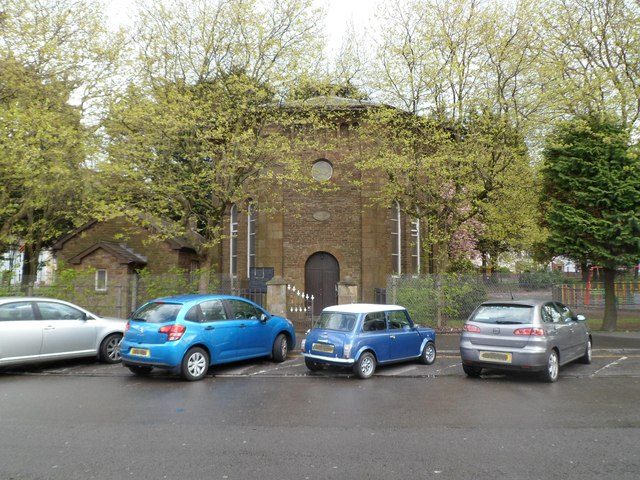
High Street, Port Talbot II; Beulah Calvinistic Methodist Chapel.
Photo: National Library of Wales · Public domain · Photo: Jaggery · CC BY-SA 2.0
History town of the day
Port Talbot, West Glamorgan
32 listed buildings3 old photos
Port Talbot’s History Grade is a B: 32 listed buildings; 26% of homes built before 1919.
Open Port Talbot’s history →From the archiveOldest first · open one to see that town’s history
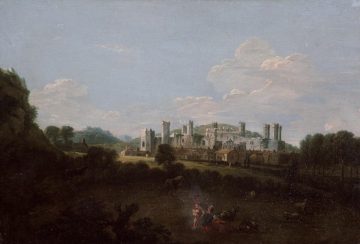 c. 1730CaernarfonProspect of Caernarfon Castle from north
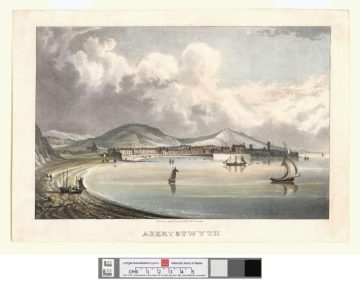 c. 1840AberystwythAberystwyth
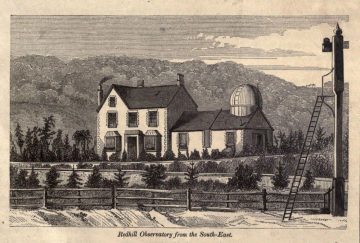 1857Redhillhouse and observatory of the British astronomer Richard Christopher Carrington …
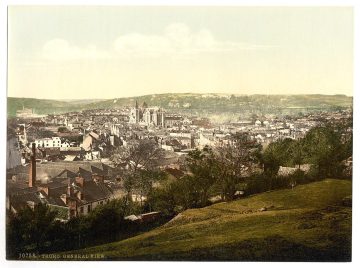 c. 1890TruroTruro, general view, Cornwall, England
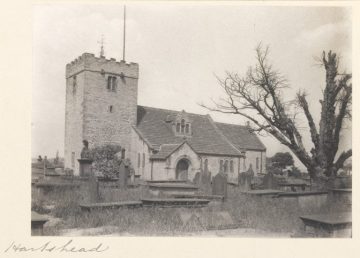 c. 1904LiversedgePhotograph of the exterior of Hartshead Church, near Liversedge, West Yorkshire
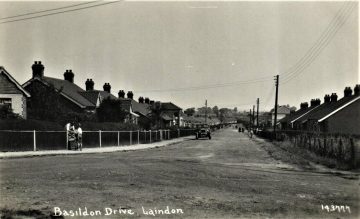 1930BasildonLaindon near Basildon. Basildon Drive - 143777. 1930 ESSEX POSTCARD
Old photos & postcardsPublic-domain photos from before 1950, via Wikimedia Commons
Old maps & town plansOrdnance Survey and older plans, where we found one
Listed buildingsEvery Grade I, II* and II entry from Historic England and Cadw
Landmark photosThe Grade I and II* buildings, photographed
Listed buildings: Historic England (National Heritage List for England) and Cadw. Photos and maps via Wikimedia Commons and Geograph; credits are on each town’s History page.
Attractions
Where people go
Museums, castles, gardens and days out: 8,556 places to visit across the UK, each with its own page and the towns around it.
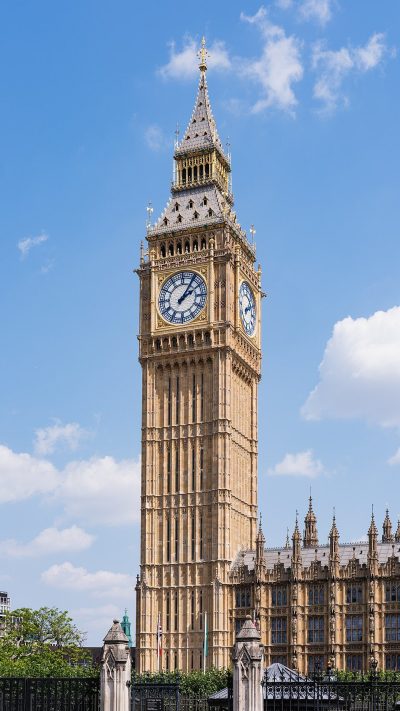
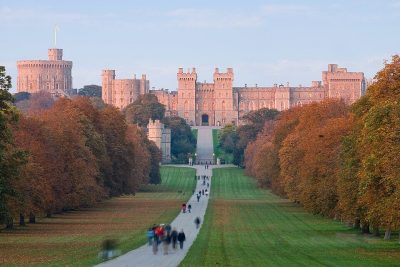
 1Museum · in CamdenBritish Museum5.8M visitors a year (2023)
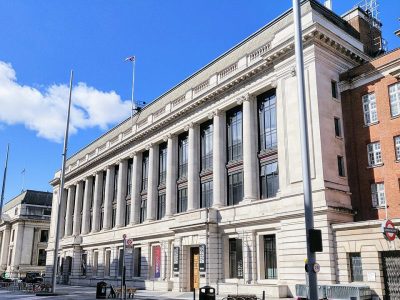 2Museum · in Kensington and ChelseaScience Museum3M visitors a year (2012)
 3Castle · in Tower HamletsTower of London2.7M visitors a year (2016)
 4Theme parkAlton Towers Resort2.5M visitors a year (2024)
 5Museum · in GreenwichNational Maritime Museum2.4M visitors a year
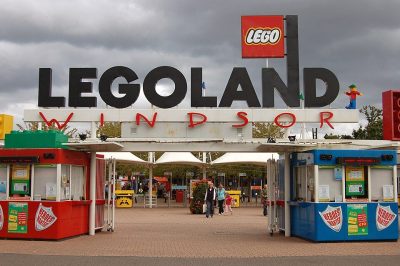 6Theme park · in WindsorLegoland Windsor2.3M visitors a year (2024)
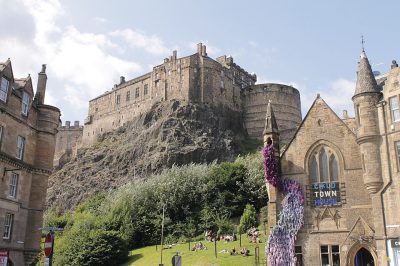
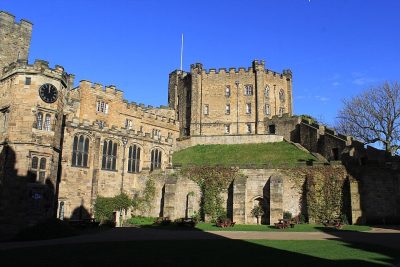
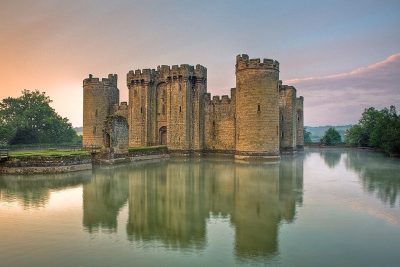 1Museum · in CamdenBritish Museum5.8M visitors a year (2023)
 2Art gallery · in WestminsterNational Gallery709K visitors a year (2021)
 3Art gallery · in SouthwarkTate Modern1.2M visitors a year (2021)
 4Museum · in Kensington and ChelseaVictoria and Albert Museum858K visitors a year (2021)
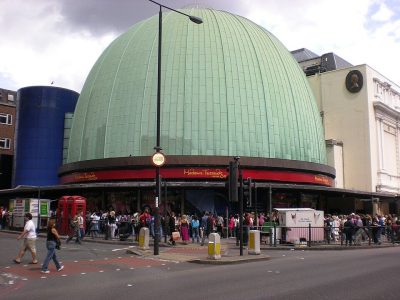 5Museum · in WestminsterMadame Tussauds
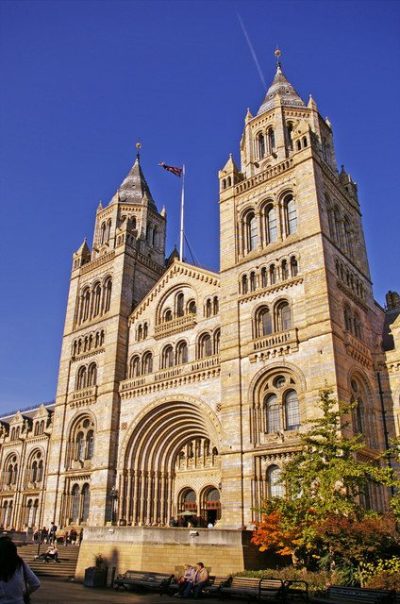 6Museum · in Kensington and ChelseaNatural History Museum1.6M visitors a year (2021)
Photos: each place’s Wikidata image, from Wikimedia Commons under the licence below (our copy, resized).
Photo credits (18)
- British Museum: Ham, CC BY-SA 3.0, Wikimedia Commons
- Tower of London: Bob Collowan, CC BY-SA 3.0, Wikimedia Commons
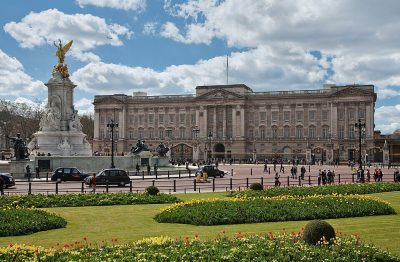
- Buckingham Palace: Diliff, CC BY-SA 3.0, Wikimedia Commons
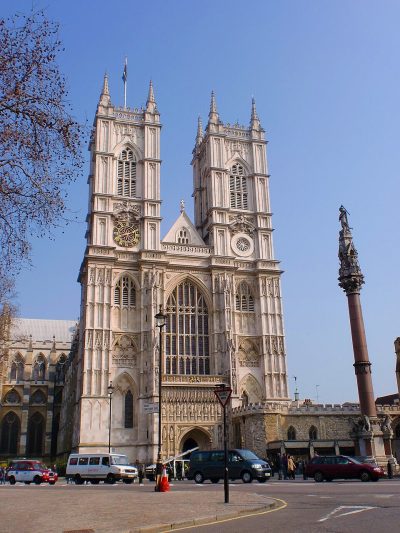
- Westminster Abbey: Σπάρτακος, CC BY-SA 3.0, Wikimedia Commons
- Elizabeth Tower: Christian David, CC BY-SA 4.0, Wikimedia Commons
- Windsor Castle: Diliff, CC BY 2.5, Wikimedia Commons
- Science Museum: Shadowssettle, CC BY-SA 4.0, Wikimedia Commons
- Alton Towers Resort: Dunderklumpen, CC BY-SA 3.0, Wikimedia Commons
- National Maritime Museum: Katie Chan, CC BY-SA 3.0, Wikimedia Commons
- Legoland Windsor: Rob Young profile, CC BY 2.0, Wikimedia Commons
- Edinburgh Castle: Stephencdickson, CC BY-SA 4.0, Wikimedia Commons
- Durham Castle: Carla Brain, CC BY-SA 2.0, Wikimedia Commons
- Bodiam Castle: Antony McCallum, CC BY-SA 3.0, Wikimedia Commons
- National Gallery: Diego Delso, CC BY-SA 4.0, Wikimedia Commons
- Tate Modern: Christine Matthews, CC BY-SA 2.0, Wikimedia Commons
- Victoria and Albert Museum: Diliff, CC BY-SA 3.0, Wikimedia Commons
- Madame Tussauds: Citizen59, CC BY-SA 3.0, Wikimedia Commons
- Natural History Museum: Christine Matthews, CC BY-SA 2.0, Wikimedia Commons
Town of the day
Open Westbury →Westbury: 150 listed buildings, 1 of them Grade I
Westbury grades B− overall against UK towns: better than 47% of UK towns, and #24 of 30 in Wiltshire. Its strongest subject is cost of living (A−): median sale £260,000, 4.3 years of area income; rent £1,082 a month. Its weakest is schools (C−): primary results beat 4% of towns in England; secondary results beat 48% of towns in England.
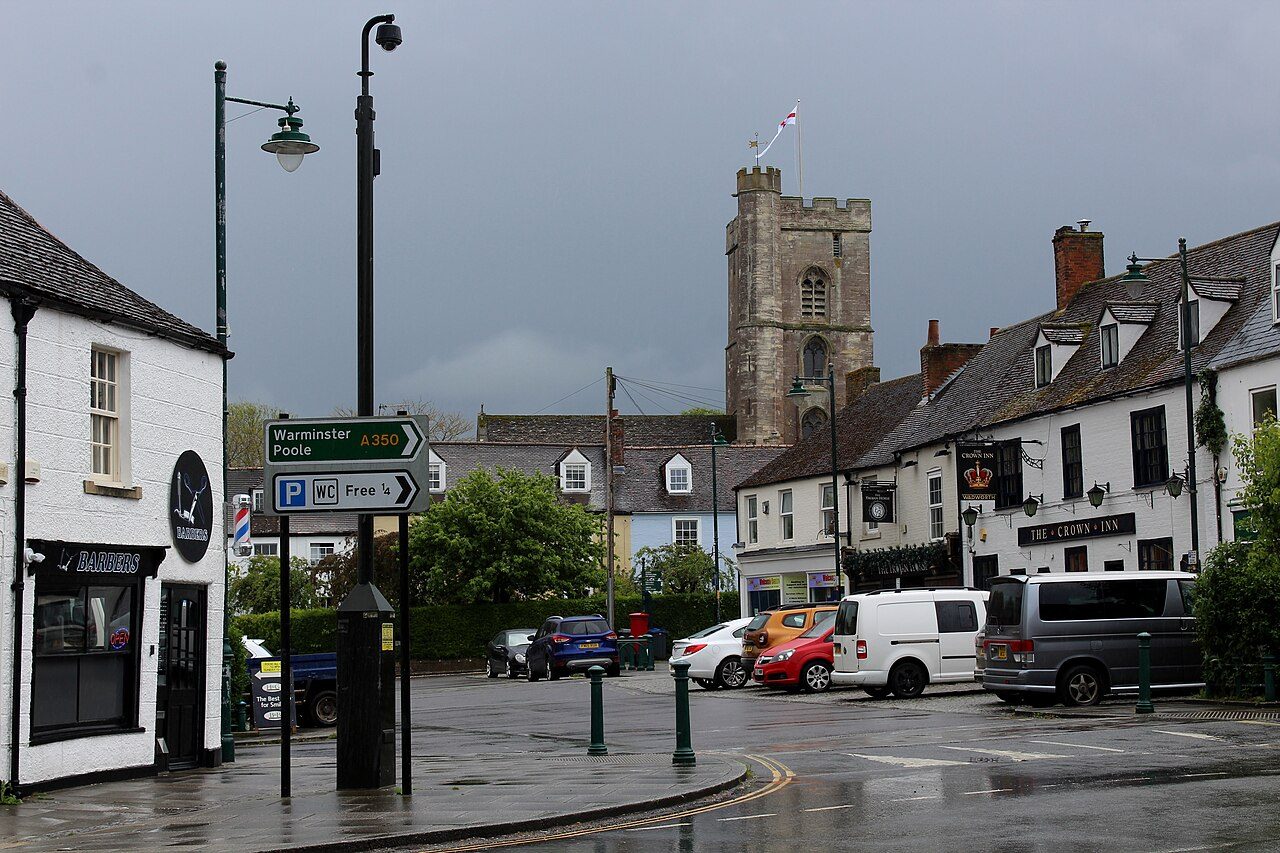 WestburyWiltshire, EnglandA town of 16,394 in Wiltshire, South West. 15% of commuters walk, cycle or take public transport.Health83.1 yearsLife expectancy for women (79.9 for men)History150Listed buildings, 1 of them Grade IB−Overall#24 of 30 in WiltshireC+SafetyC−SchoolsCHealthA−Cost of livingB+HistorySee all of Westbury →
County report cards
Open the full map →How the 98 counties and council areas compare
65 of the 98 have an overall grade, from up to 8 subjects. Mid Ulster comes first and Dyfed last; 17 are in the A band and 10 in the D band. Scotland’s 32 council areas get one once Safety can be graded there (the deprivation index due at the end of 2026). Greater Manchester has none yet: no police.uk data, so no Safety grade.
ABCDNo gradeHover or tap a shape for its name; click it, or tap it again, to open it.
- 1Mid Ulster#1 MagheraA+
- 2Rutland#1 UppinghamA+
- 3Fermanagh and Omagh#1 LisnaskeaA+
- 4Lisburn and Castlereagh#1 CarryduffA+
- 5Hertfordshire#1 Moor ParkA
- 6Newry, Mourne and Down#1 Warrenpoint and BurrenA
- 7Oxfordshire#1 GoringA
- 8Surrey#1 WreccleshamA
- 9Berkshire#1 TwyfordA
- 10Cambridgeshire#1 Bar HillA
- 11Buckinghamshire#1 Marlow BottomA−
- 12Wiltshire#1 RudloeA−
- 13West Sussex#1 SouthwaterA−
- 14Warwickshire#1 KenilworthA−
- 15Hampshire#1 Elvetham HeathA−
- 16Essex#1 Saffron WaldenA−
- 17North Yorkshire#1 Ingleby BarwickA−
- 18Dorset#1 West ParleyB+
- 19Ards and North Down#1 BallygowanB+
- 20Armagh City, Banbridge and Craigavon#1 DromoreB+
- 21Leicestershire#1 Great GlenB+
- 22Gloucestershire#1 Leonard Stanley and King's StanleyB+
- 23London#1 Richmond upon ThamesB+
- 24Cheshire#1 KelsallB
- 25Antrim and Newtownabbey#1 CrumlinB
- 26Kent#1 HildenboroughB
- 27Mid and East Antrim#1 AhoghillB
- 28Nottinghamshire#1 West BridgfordB
- 29Somerset#1 BackwellB
- 30Causeway Coast and Glens#1 DungivenB
- 31Bedfordshire#1 SilsoeB−
- 32Northumberland#1 CorbridgeB−
- 33Suffolk#1 KesgraveB−
- 34Belfast#1 Metropolitan LisburnB−
- 35Norfolk#1 PoringlandB−
- 36Northamptonshire#1 BrixworthB−
- 37Devon#1 IvybridgeC+
- 38Shropshire#1 Bayston HillC+
- 39Tyne and Wear#1 CleadonC+
- 40West Yorkshire#1 RippondenC+
- 41Worcestershire#1 HagleyC+
- 42Lincolnshire#1 Witham St HughsC+
- 43County Durham#1 EgglescliffeC
- 44East Sussex#1 HeathfieldC
- 45East Riding of Yorkshire#1 North FerribyC
- 46Derbyshire#1 ReptonC
- 47Staffordshire#1 GnosallC
- 48Lancashire#1 LongtonC
- 49Cornwall#1 St AgnesC
- 50Gwynedd#1 Llanfair PwllgwyngyllC−
- 51Herefordshire#1 LedburyC−
- 52Clwyd#1 PenyfforddC−
- 53West Midlands#1 Dickens HeathC−
- 54Bristol#1 AvonmouthC−
- 55Derry City and Strabane#1 NewbuildingsC−
- 56South Glamorgan#1 CowbridgeD
- 57South Yorkshire#1 TickhillD
- 58Cumbria#1 Grange-over-SandsD
- 59Merseyside#1 GreasbyD
- 60Isle of Wight#1 BembridgeD
- 61Powys#1 KnightonD
- 62Mid Glamorgan#1 Church VillageD
- 63West Glamorgan#1 BishopstonD−
- 64Gwent#1 RogerstoneD−
- 65Dyfed#1 LlangennechD−
No overall grade
- –Aberdeen CityNo overall grade until Safety can be graded in Scotland
- –AberdeenshireNo overall grade until Safety can be graded in Scotland
- –AngusNo overall grade until Safety can be graded in Scotland
- –Argyll and ButeNo overall grade until Safety can be graded in Scotland
- –City of EdinburghNo overall grade until Safety can be graded in Scotland
- –ClackmannanshireNo overall grade until Safety can be graded in Scotland
- –Dumfries and GallowayNo overall grade until Safety can be graded in Scotland
- –Dundee CityNo overall grade until Safety can be graded in Scotland
- –East AyrshireNo overall grade until Safety can be graded in Scotland
- –East DunbartonshireNo overall grade until Safety can be graded in Scotland
- –East LothianNo overall grade until Safety can be graded in Scotland
- –East RenfrewshireNo overall grade until Safety can be graded in Scotland
- –FalkirkNo overall grade until Safety can be graded in Scotland
- –FifeNo overall grade until Safety can be graded in Scotland
- –Glasgow CityNo overall grade until Safety can be graded in Scotland
- –Greater ManchesterNo police.uk data, so no Safety grade
- –HighlandNo overall grade until Safety can be graded in Scotland
- –InverclydeNo overall grade until Safety can be graded in Scotland
- –MidlothianNo overall grade until Safety can be graded in Scotland
- –MorayNo overall grade until Safety can be graded in Scotland
- –Na h-Eileanan SiarNo overall grade until Safety can be graded in Scotland
- –North AyrshireNo overall grade until Safety can be graded in Scotland
- –North LanarkshireNo overall grade until Safety can be graded in Scotland
- –Orkney IslandsNo overall grade until Safety can be graded in Scotland
- –Perth and KinrossNo overall grade until Safety can be graded in Scotland
- –RenfrewshireNo overall grade until Safety can be graded in Scotland
- –Scottish BordersNo overall grade until Safety can be graded in Scotland
- –Shetland IslandsNo overall grade until Safety can be graded in Scotland
- –South AyrshireNo overall grade until Safety can be graded in Scotland
- –South LanarkshireNo overall grade until Safety can be graded in Scotland
- –StirlingNo overall grade until Safety can be graded in Scotland
- –West DunbartonshireNo overall grade until Safety can be graded in Scotland
- –West LothianNo overall grade until Safety can be graded in Scotland
Inside a town
What a town’s pages cover
Take a look at these pages in Westbury, today’s town.
SafetyCrime reported to police.uk, per resident, graded against UK towns.Westbury’s safety →Cost of livingWhat homes sell for, rents, council tax, and what you can afford.Westbury’s cost of living →Work & commuteIncomes, jobs, benefits claims, and how people get to work.Westbury’s work & commute →SchoolsEvery state school, its results and Ofsted rating.Westbury’s schools →HealthLife expectancy, health in the Census, GPs and hospitals nearby.Westbury’s health →Flood & hazardsHomes at risk of flooding from rivers and the sea.Westbury’s flood & hazards →Who lives hereAges, households, where people were born, and how they travel.Westbury’s who lives here →HistoryOld photos, old maps and every listed building.Westbury’s history →OutdoorsParks, green space, National Parks and National Landscapes nearby.Westbury’s outdoors →ClimateA year of weather: rain, sunshine, frost and summer highs.Westbury’s climate →Town HallCouncils, councillors and MPs, and who to call.Westbury’s town hall →Wiltshire rankingsEvery graded town in Wiltshire, ranked, with Westbury among them.Wiltshire rankings →
The map
Open the full map →All 7,377 places on one map
Zoom into your corner of the UK. Each dot is a town you can open.
Scroll to zoom · drag to pan · click a town to open it
Mapping the UK…
The UK, one map
Click any dot to open that town.
—towns in view
How grades work
One letter, the same everywhere
Each subject compares a town with every UK town of 1,000 or more, from public data (police.uk crime, the 2021 Census, HM Land Registry and NISRA sales, school results, NHS and NISRA health figures, Environment Agency flood maps). The overall grade blends seven of them for towns of 2,500 or more. UK towns are graded against each other only, never against American towns. Each town page shows the figures behind its letters.
How grades work →- A+top 5%
- A85–95
- A−75–85
- B+65–75
- B55–65
- B−45–55
- C+35–45
- C25–35
- C−15–25
- D5–15
- D−bottom 5%
Browse by area
Find a town by county or council area
England and Wales by the ceremonial counties people use (“Exeter, Devon”), Scotland and Northern Ireland by council area, London by borough, each with its report-card grade.
England 47
- London’s boroughs33 gradedB+
- Bedfordshire33 gradedB−
- Berkshire30 gradedA
- Bristol2 gradedC−
- Buckinghamshire39 gradedA−
- Cambridgeshire51 gradedA
- Cheshire46 gradedB
- Cornwall35 gradedC
- County Durham52 gradedC
- Cumbria23 gradedD
- Derbyshire59 gradedC
- Devon47 gradedC+
- Dorset32 gradedB+
- East Riding of Yorkshire25 gradedC
- East Sussex26 gradedC
- Essex81 gradedA−
- Gloucestershire48 gradedB+
- Greater Manchester106 places
- Hampshire77 gradedA−
- Herefordshire5 gradedC−
- Hertfordshire50 gradedA
- Isle of Wight10 gradedD
- Kent87 gradedB
- Lancashire66 gradedC
- Leicestershire50 gradedB+
- Lincolnshire64 gradedC+
- Merseyside25 gradedD
- Norfolk52 gradedB−
- North Yorkshire56 gradedA−
- Northamptonshire31 gradedB−
- Northumberland20 gradedB−
- Nottinghamshire49 gradedB
- Oxfordshire40 gradedA
- Rutland3 gradedA+
- Shropshire20 gradedC+
- Somerset49 gradedB
- South Yorkshire63 gradedD
- Staffordshire47 gradedC
- Suffolk35 gradedB−
- Surrey66 gradedA
- Tyne and Wear34 gradedC+
- Warwickshire34 gradedA−
- West Midlands35 gradedC−
- West Sussex40 gradedA−
- West Yorkshire91 gradedC+
- Wiltshire34 gradedA−
- Worcestershire22 gradedC+
Scotland 32
- Aberdeen City6 towns
- Aberdeenshire23 towns
- Angus7 towns
- Argyll and Bute5 towns
- City of Edinburgh3 towns
- Clackmannanshire8 towns
- Dumfries and Galloway10 towns
- Dundee City1 town
- East Ayrshire13 towns
- East Dunbartonshire7 towns
- East Lothian11 towns
- East Renfrewshire10 towns
- Falkirk14 towns
- Fife26 towns
- Glasgow City1 town
- Highland16 towns
- Inverclyde5 towns
- Midlothian7 towns
- Moray5 towns
- Na h-Eileanan Siar1 town
- North Ayrshire11 towns
- North Lanarkshire24 towns
- Orkney Islands1 town
- Perth and Kinross8 towns
- Renfrewshire11 towns
- Scottish Borders11 towns
- Shetland Islands1 town
- South Ayrshire6 towns
- South Lanarkshire16 towns
- Stirling7 towns
- West Dunbartonshire8 towns
- West Lothian13 towns
Wales 8
Northern Ireland 11
- Antrim and Newtownabbey5 gradedB
- Ards and North Down6 gradedB+
- Armagh City, Banbridge and Craigavon7 gradedB+
- Belfast2 gradedB−
- Causeway Coast and Glens7 gradedB
- Derry City and Strabane5 gradedC−
- Fermanagh and Omagh3 gradedA+
- Lisburn and Castlereagh5 gradedA+
- Mid Ulster5 gradedA+
- Mid and East Antrim8 gradedB
- Newry, Mourne and Down10 gradedA
Questions about TownRatings UK
What is the best place to live in the UK?
Among 2,138 ranked towns and cities of 2,500 or more, Bar Hill, Cambridgeshire ranks first, with its best grades in health and jobs & income. Each is ranked on the national list and within its own county or council area.
Is my town graded?
Towns of 2,500 or more get an overall grade (2,160 do). Places of 1,000 to 2,499 get subject grades only; smaller villages have their page without grades.
Where do the grades come from?
Public data under the Open Government Licence: police.uk street-level crime, the 2021 Census, HM Land Registry sales, ONS rents and incomes, Department for Education results, NHS health indicators and Environment Agency flood maps. Each town page names its sources.
What about Scotland and Northern Ireland?
Both are here, with less to grade so far. Northern Ireland’s 63 towns have an overall grade built from five subjects: no small-area income figures or open flood maps are published there, so there is no Jobs or Flood risk grade. Scotland’s 296 towns are graded on cost of living, schools, health, walkability and flood risk; their overall grades come with the Scottish Index of Multiple Deprivation at the end of 2026, which brings the figures for a Safety grade.
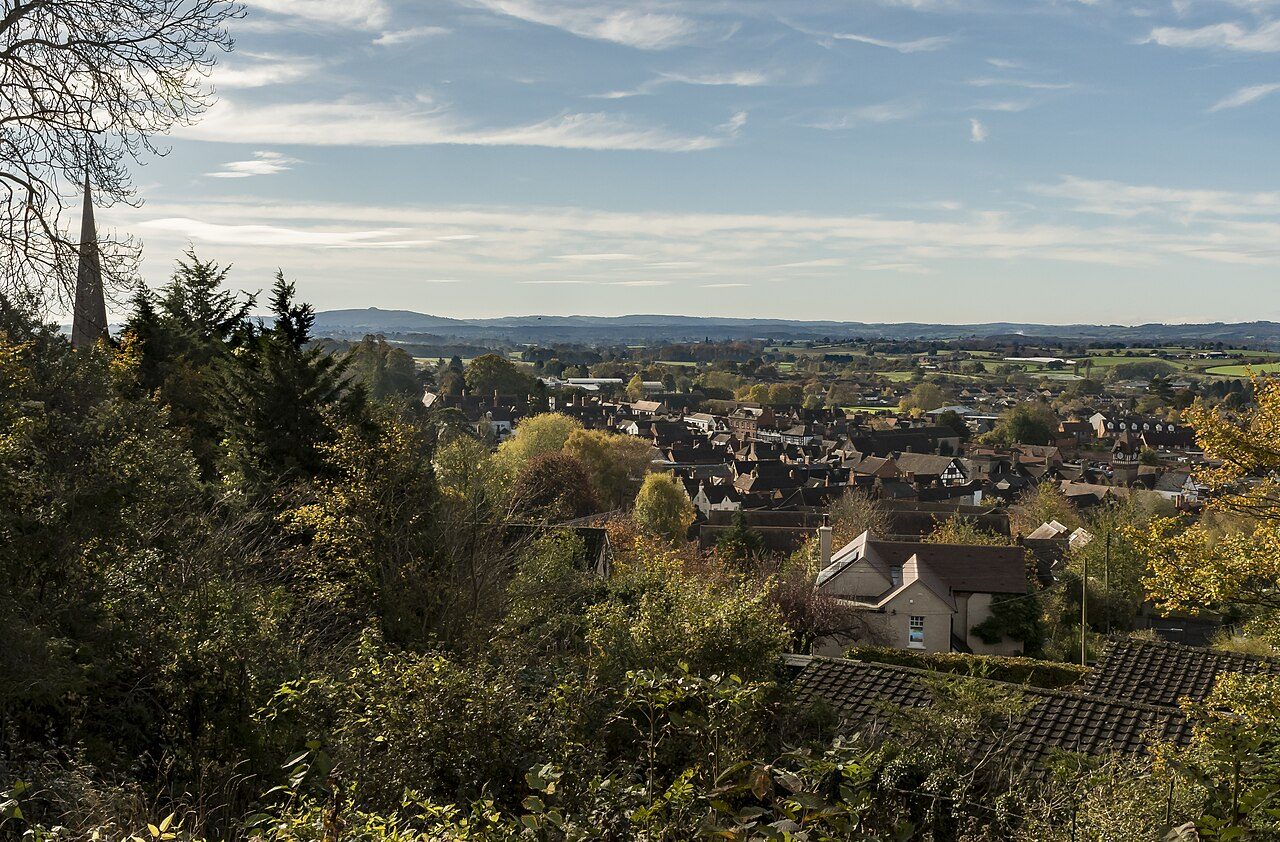
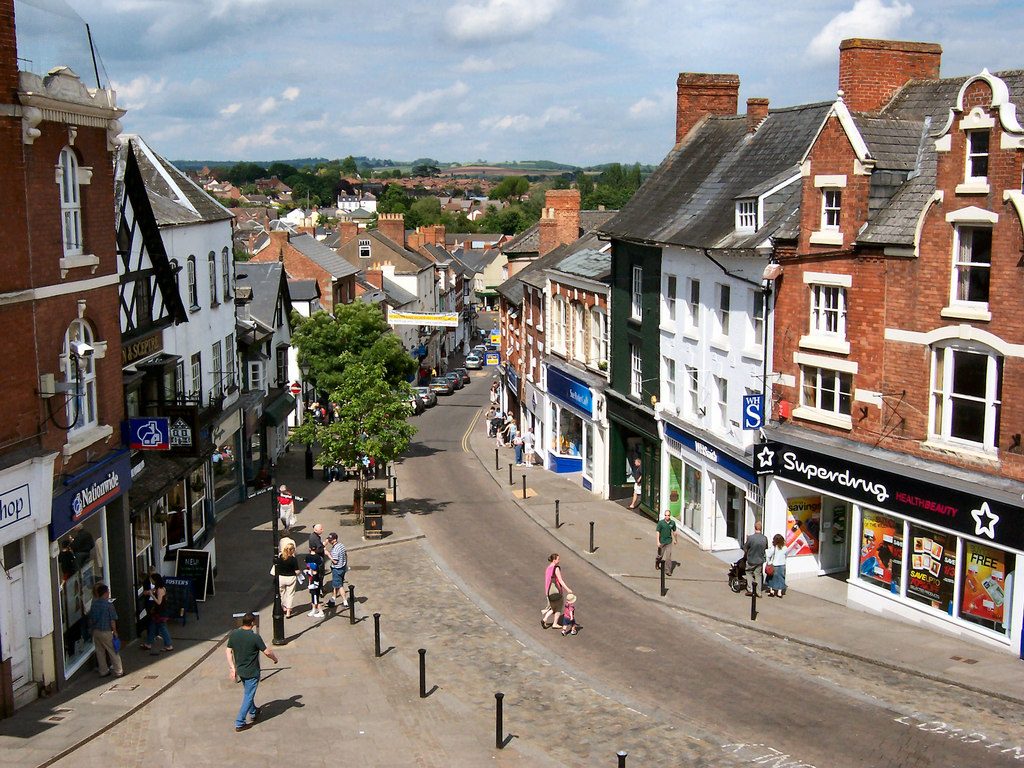
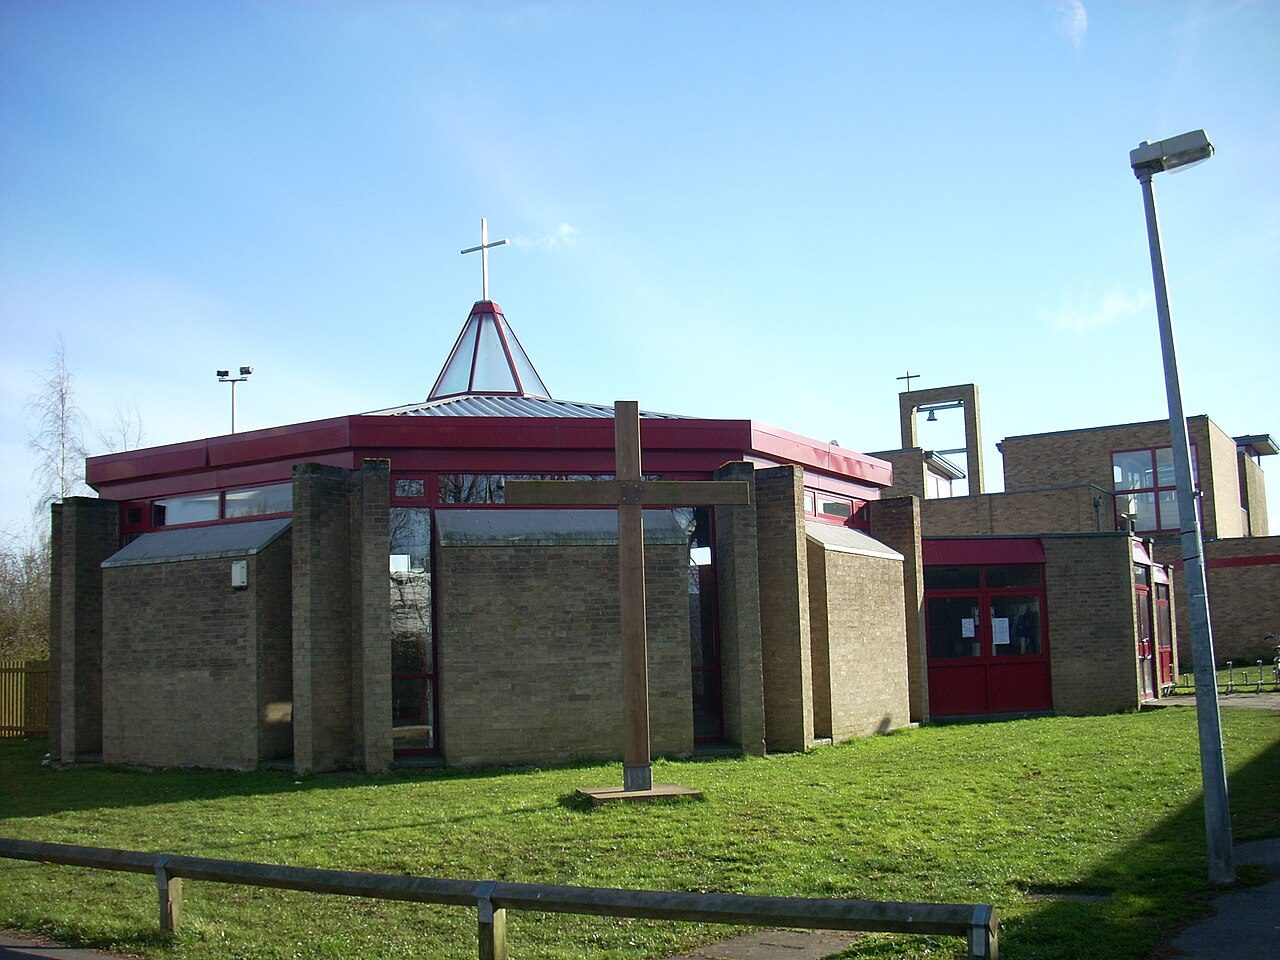
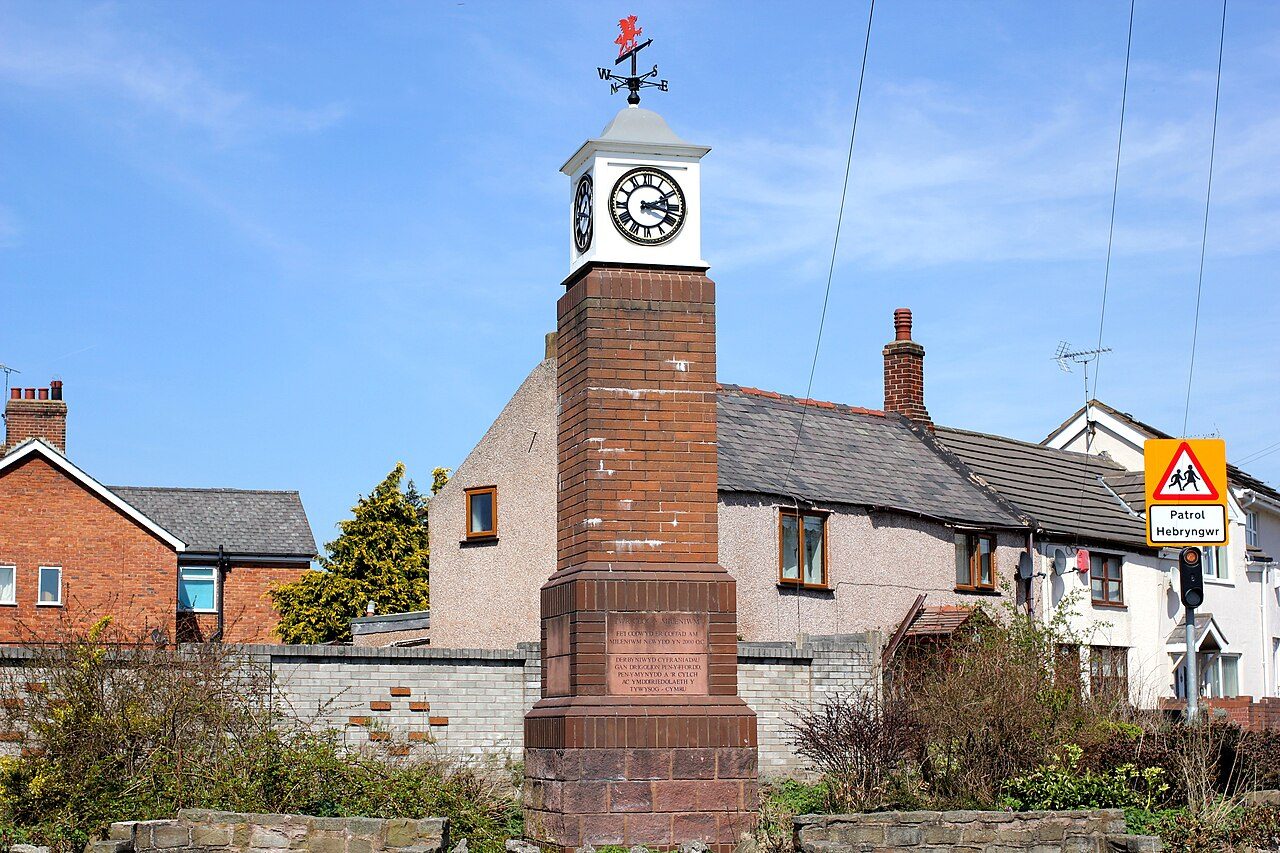
Photos: Ledbury, Julian P Guffogg (CC BY-SA 2.0) · Ross-on-Wye, David Dixon (CC BY-SA 2.0) · Bar Hill, Cruccone (CC BY 3.0) · Glasgow, Ian Hawfinch (CC BY-SA 2.0) · Penyffordd, Jeff Buck (CC BY-SA 2.0) · Carryduff, Eric Jones (CC BY-SA 2.0) · Elvetham Heath, Mr Ignavy (CC BY-SA 2.0) · Girton, Ben Wilkinson (CC BY 3.0) · West Bridgford, Alan Murray-Rust (CC BY-SA 2.0) · Keyworth, Richard Vince (CC BY-SA 2.0) · Fleet, Stuart Shepherd (CC BY-SA 2.0) · Repton, Alan Murray-Rust (CC BY-SA 2.0) · Twyford, David Howard (CC BY-SA 2.0) · Ingleby Barwick, Alex McGregor (CC BY-SA 2.0) · Coalisland, Kenneth Allen (CC BY-SA 2.0) · Dungannon, Kenneth Allen (CC BY-SA 2.0) · Larne, Rossographer (CC BY-SA 2.0) · Richhill, HENRY CLARK (CC BY-SA 2.0) · South Wonston, Peter Facey (CC BY-SA 2.0) · Dunnington, DS Pugh (CC BY-SA 2.0) · Richmond upon Thames, David Howard (CC BY-SA 2.0) · Sutton, A P Monblat (CC BY-SA 3.0) · Kingston upon Thames, Colin Smith (CC BY-SA 2.0) · Westbury, Chris Heaton (CC BY-SA 2.0) · Trowbridge, David Gearing (CC BY-SA 2.0) · Warminster, Colin Smith (CC BY-SA 2.0) · Frome, Mr Eugene Birchall (CC BY-SA 2.0), via Wikimedia Commons.
Grades compare UK towns with each other only; American towns are graded in their own edition. TownRatings for America →
Sources: TownRatings grades: our own summary of the data, ranked against UK towns only · ONS Census 2021, output areas summed to the ONS 2022 built-up area · HM Land Registry Price Paid (standard sales, September 2023 to August 2026) · data.police.uk street-level crime, 36 months to August 2026, points inside the built-up-area boundary · ONS small-area life expectancy and healthy life expectancy, 2019 to 2023 (England and Wales), OHID Fingertips small-area indicators (England) and Census 2021 health, adjusted for age · DfE Get Information about Schools (16 October 2026), Key Stage 2 performance tables (2023–2025, three-year average) and Key Stage 4 (2025/26, provisional); Ofsted state-funded school inspections as at 30 September 2026 · Historic England, National Heritage List for England (listed buildings, scheduled monuments, registered parks and gardens, battlefields, World Heritage Sites), October 2026, inside the ONS 2022 built-up-area boundary. All under the Open Government Licence v3.0.
Contains public sector information licensed under the Open Government Licence v3.0. Contains HM Land Registry data © Crown copyright and database right 2026. Contains OS data © Crown copyright and database right 2026 (ONS boundaries). Northern Ireland: Source: NISRA; contains Land & Property Services data and Ordnance Survey of Northern Ireland information, © Crown copyright, licensed under the Open Government Licence v3.0. Scotland: contains National Records of Scotland data, Registers of Scotland data and SEPA data, © Crown copyright / © SEPA 2025, licensed under the Open Government Licence v3.0.