85 years in pictures
Census counts: 2,028 in 1950, 27,959 in 2020. The archive holds 16 old photos and papers going back to 2005 and 2 maps from 1953 on.
- 1941Ridgecrest is settled
Each edition grades its towns against each other only.

Ridgecrest is a solid, middle-of-the-road choice. It grades C− overall, 535th among California's 841 graded towns, with no subject far below average. Its best mark is health: residents are healthier than 60% of U.S. towns on CDC estimates. Expect to pay for it: homes are expensive, about $266K for a typical one and 3.8 times the Bakersfield metro’s $70K median household income. 43% of working residents work locally in Ridgecrest, above both California’s towns (6.6%) and U.S. towns (8%). Only 45 of California’s 1,063 towns score lower on history. Ridgecrest is home to Cerro Coso Community College.
Where Ridgecrest beats most towns.
Each subject compared with towns across the country (schools within California), ordered by how far Ridgecrest is from typical.
How TownRatings grades towns →

Census counts: 2,028 in 1950, 27,959 in 2020. The archive holds 16 old photos and papers going back to 2005 and 2 maps from 1953 on.
Who provides power, water and the rest in Ridgecrest, and how to reach them.
EPA SDWIS (Oct 9, 2026) · HIFLD + EIA-861 2025 · Census 2020 ZCTAs · NCES 2024–25 · registration: vote.gov, updated Nov 18, 2024.
Ordered by what stands out in Ridgecrest.
Ridgecrest fares better on crime within California than nationally, has more 90° days than nearly all U.S. towns and has commutes shorter than most of California.
The median property tax bill is $2,448, against $5,124 across California, another input to its cost-of-living grade.
Homes sold in Ridgecrest spent a median 35 days on the market. Zillow values the typical Ridgecrest home at about $266,000, down 1.4% in a year, 65% below the California typical home. Nearly three in five households are owner-occupiers locally.
| Ridgecrest | California towns | U.S. towns | |
|---|---|---|---|
| Households that own their home | 59% | 64% | 73% |
| Median rent | $1,186 a month | $1,898 a month | $1,185 a month |
Zillow Home Value Index · Redfin Data Center
Of its 19 schools, two are listed below, each with the reason. Its public schools are run by the Sierra Sands Unified school district. Public school enrollment in Ridgecrest: 2,288 students across 6 schools.
| School | Level | Students | Letter |
|---|---|---|---|
| Murray MiddleLargest public middle schoolGrades 6–8 | Grades 6–8 | 643 | B− |
| Burroughs HighLargest public high schoolGrades 9–12 | Grades 9–12 | 1,536 | A− |
NCES · EDFacts · graded within CA on state tests and graduation
Ridgecrest’s trail network density comes in at 1.6 miles per square mile. 35 miles of trail in 7 parks and preserves. The biggest place to walk is Leroy Jackson Park, 78 acres with 1.3 miles of trail.
| Ridgecrest | California towns | U.S. towns | |
|---|---|---|---|
| Miles of trail per square mile | 1.6 miles per square mile | 1.0 | 0.4 |
| Conserved land | 0.9% | 4.3% | 4.3% |
| Biggest places to walk | Trails | Acres |
|---|---|---|
| 1. Leroy Jackson Park | 1.3 mi | 78 |
| 2. Petroglyph Park | — | 12 |
| 3. Stauffer Park | — | 11 |
Trails & parks © OpenStreetMap contributors · Conserved land: USGS PAD-US
At 33.5 crimes per 1,000 residents a year, it reports more crime than 61% of California’s graded towns.
Ridgecrest’s violent offense rate is 5.6 per 1,000 residents. Its property offense rate comes in at 8.4 per 1,000 residents.
| Ridgecrest | California towns | U.S. towns | |
|---|---|---|---|
| Violent crimes per 1,000 (2025) | 5.6 per 1,000 residents | 2.9 | 1.6 |
| Property crimes per 1,000 (2025) | 8.4 per 1,000 residents | 13.4 | 9.9 |
FBI crime data, 2025 · crimes reported to police
Paid flood insurance claims in Ridgecrest since 1984: 22. Compared with 78% of U.S. communities, expected storm and flood damage locally is higher. 55% of the town’s expected losses from natural hazards come from earthquakes, followed by inland flooding at 39%. Households locally have drawn federal disaster aid in 3 declared disasters, most recently in 2023.
FEMA flood insurance claims · FEMA disaster declarations and aid · FEMA National Risk Index · OpenFEMA
The Inyokern weather station, 9 miles away, records that about 137 days a year reach 90°, more than in 99% of U.S. towns. July afternoons average 103.2°, hotter than in 100% of U.S. towns; January nights average 33.7°.
Snow is a rarity. The midsummer high for Ridgecrest comes to 103°F.
| Ridgecrest | California towns | U.S. towns | |
|---|---|---|---|
| July high | 103°F | 89°F | 85°F |
| January low | 34°F | 41°F | 22°F |
NOAA U.S. Climate Normals, 1991–2020
The average commute for its 8,362 working residents takes 16.9 minutes, against 28.7 across California.
For Ridgecrest, the average commute is 17 minutes. Since 2013, Ridgecrest has added 1,030 jobs, to 6,750 in 2023. Half the trips to work are shorter than 44 miles. The share of residents in Ridgecrest who live below the poverty line: 13%.
| Ridgecrest | California towns | U.S. towns | |
|---|---|---|---|
| Average trip to work | 17 minutes | 28 minutes | 25 minutes |
| Below the poverty line | 13% | 10% | 9.6% |
| Work from home | 11% | 14% | 11% |
| Median household income | $89,000 | $95,000 | $80,000 |
Census LEHD 2023 · ACS
Ridgecrest: 27% of residents are under 18. Children under 18 are 27% of residents (22% statewide). Also worth knowing: the midpoint age locally is 33.4 years. A bachelor’s degree or higher: 31% of adults 25 and older, vs 37% across California.
| Ridgecrest | California towns | U.S. towns | |
|---|---|---|---|
| Under 18 | 27% | 22% | 22% |
| Median age | 33.4 years | 39.1 years | 40.5 years |
| Aged 65 or older | 12% | 16% | 18% |
47% women, 53% men
About 111 men for every 100 women (the survey’s margin: ±2.2 points). Across California, 50.1% of residents are women. Median age: women 34.2, men 32.9.
| Ridgecrest | CA | U.S. | |
|---|---|---|---|
| Under 10 | 14.7% | 11.4% | 11.6% |
| 10 to 17 | 12.5% | 10.5% | 10.3% |
| 18 to 24 | 7.5% | 9.1% | 9.1% |
| 25 to 34 | 17.4% | 14.8% | 13.7% |
| 35 to 44 | 13.9% | 13.9% | 13.2% |
| 45 to 54 | 11.4% | 12.5% | 12.2% |
| 55 to 64 | 10.3% | 12.1% | 12.7% |
| 65 to 74 | 7% | 9.2% | 10.2% |
| 75 and older | 5.4% | 6.5% | 7% |
| No diploma | 7.9% | 15.3% | 10.4% |
| High school | 20.5% | 20.5% | 26% |
| Some college | 27.1% | 19.3% | 19.1% |
| Associate’s | 13.7% | 7.9% | 8.8% |
| Bachelor’s | 21.7% | 22.7% | 21.6% |
| Graduate | 9.2% | 14.4% | 14.1% |
U.S. Census Bureau · ACS 2020-2024 5-year estimates
Among adults in Ridgecrest, 35% feel lonely. On the CDC’s 32 measures, Ridgecrest is ahead of California on 2 and behind on 7. In Ridgecrest, a fifth of adults report frequent mental distress, and 25% have been diagnosed with depression.
| Ridgecrest | California towns | U.S. towns | |
|---|---|---|---|
| Binge drink (CDC PLACES) | 18% | 16% | 16% |
| Frequent mental distress (CDC PLACES) | 20% | 17% | 17% |
| Depression (CDC PLACES) | 25% | 22% | 23% |
| Yearly checkup (CDC PLACES) | 73% | 72% | 79% |
| What stands out | Ridgecrest | CA |
|---|---|---|
| Fewer uninsured adults | 8.3% | 10.6% |
| More adults screened for colon cancer | 63% | 57.5% |
| More adults with depression | 24.8% | 20.1% |
CDC PLACES 2025 · modeled estimates for adults · CMS · HRSA
Museums, parks, gardens and other places to visit around Ridgecrest. Close and well known come first.
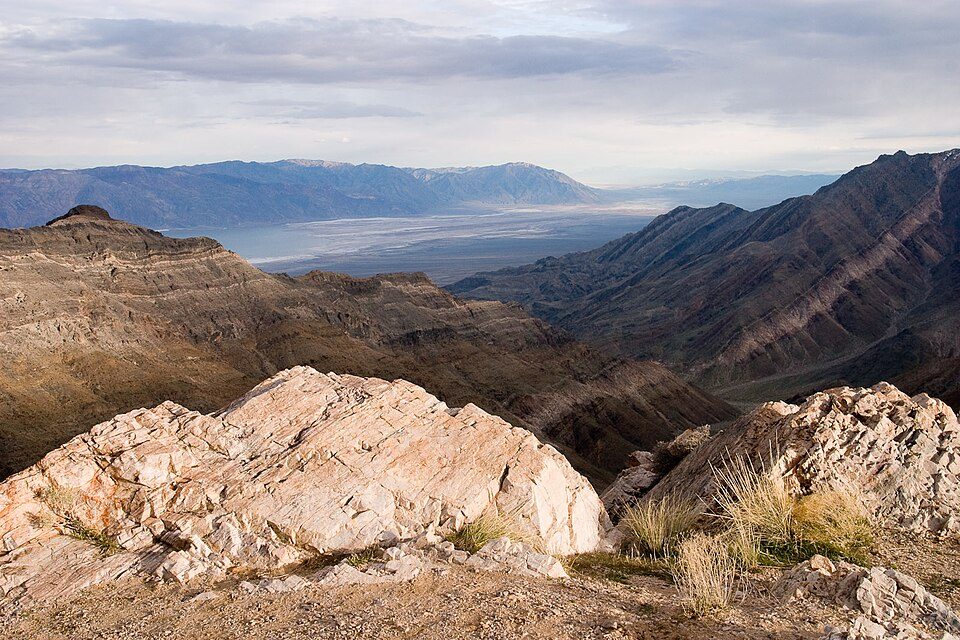
Big draw33 mi National ParkDeath Valley National Park1.3M visitors a year
17 mi Park & preserveTrona Pinnacles
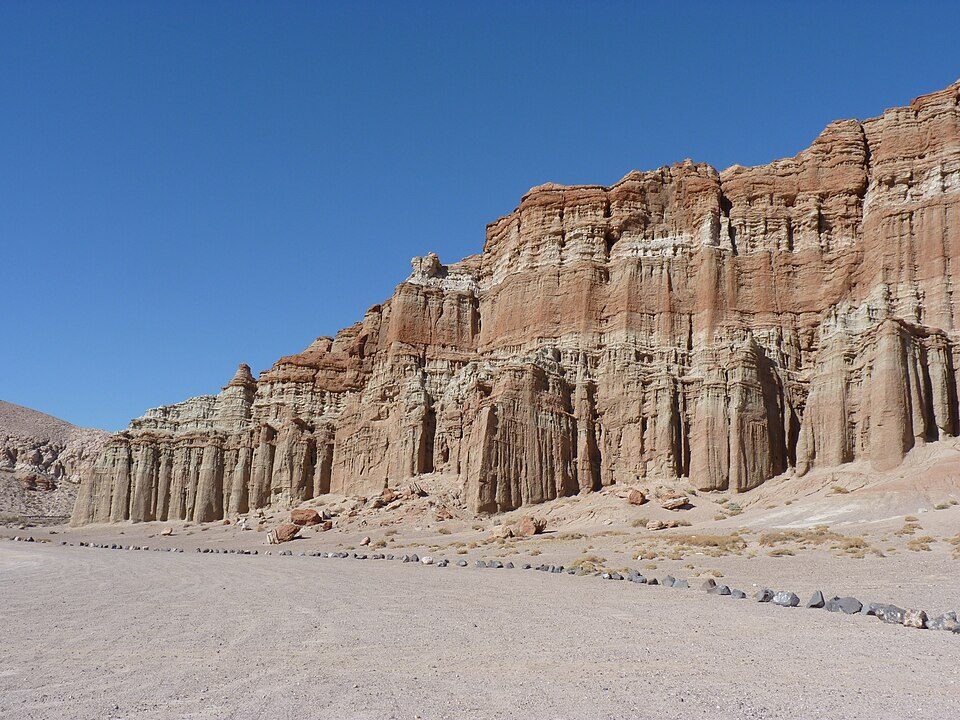
26 mi State parkRed Rock Canyon State Park
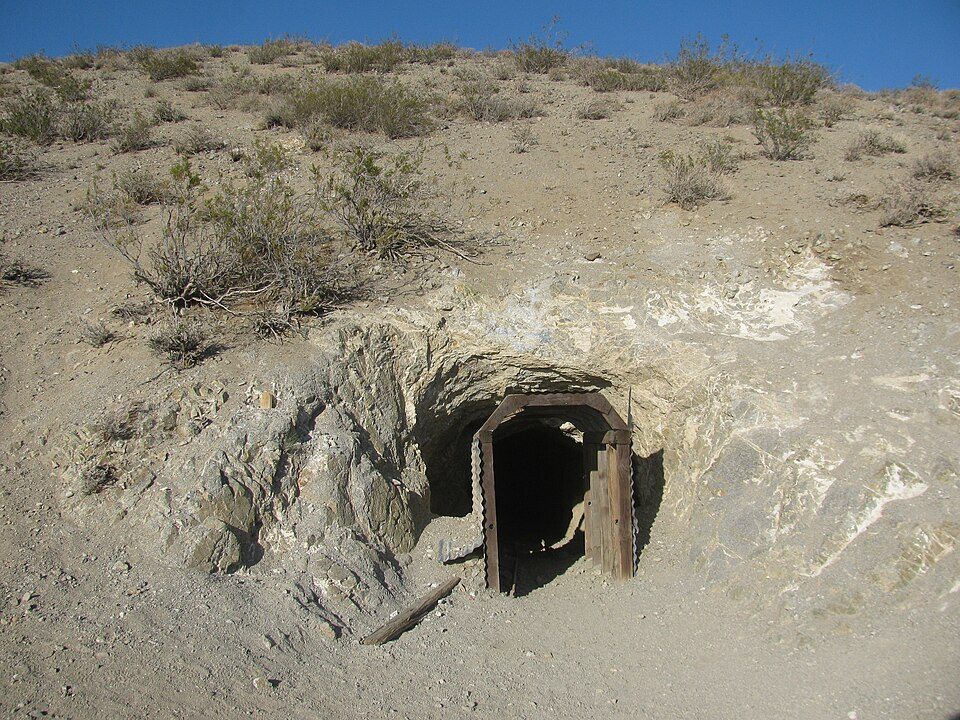
19 mi Park & preserveBurro Schmidt Tunnel
in town MuseumNaval Museum of Armament & Technology
in town MuseumMaturango MuseumDeath Valley National Park: Greg Willis from Denver, CO, usa, CC BY-SA 2.0 · Trona Pinnacles: Doug Dolde at English Wikipedia, Public domain · Red Rock Canyon State Park: Jean trans h+, CC BY-SA 4.0 · Burro Schmidt Tunnel: Kurtis2014, CC BY-SA 3.0 · Naval Museum of Armament & Technology: U.S. Navy photo by Geoffrey Patrick., Public domain · Maturango Museum: Qfl247 (talk) (Transferred by Citypeek/Original uploaded by Qfl247), CC BY-SA 3.0
1 within 15 miles of the center of Ridgecrest
About 6 of every 100 Ridgecrest residents are enrolled in college, against 8 across California.
7 notable people were born in Ridgecrest.
City in California, United States
Ridgecrest is a city in Kern County, California, United States, along U.S. Route 395 in the Indian Wells Valley in northeastern Kern County, adjacent to the Naval Air Weapons Station China Lake (NAWS, or China Lake). It was incorporated as a city in 1963. The population was 27,959 at the 2020 census, up slightly from 27,616 at the 2010 census, making it the third-largest city in Kern County. Ridgecrest is surrounded by four mountain ranges; the Sierra Nevada on the west, the Coso Range on the north, the Argus Range on the east, and the El Paso Mountains on the south. The most isolated community in Kern county, it is approximately 82 miles (132 km) from the Lancaster/Palmdale area, 110 miles…
From Wikipedia, licensed CC BY-SA 4.0 · facts via Wikidata (CC0)
One town shares a border with Ridgecrest.
| Town | CA rank | Overall | Cost | Safety | Schools | Health |
|---|---|---|---|---|---|---|
| Ridgecrest | #535 | C− | C | C− | C+ | B |
| Ridgecrest Heights | — | — | — | — | — | — |
Ridgecrest Heights isn’t graded (fewer than 1,000 residents, or not enough data). Compare Ridgecrest with a neighbor →
Short answers, built from the data on this page.
Ridgecrest grades C− overall, better than 16% of U.S. towns and #535 of 841 in California. It grades B for health, C− for safety and C+ for schools. Hazard risk is its weak spot, with a D.
Cost of living, which also weighs rents, property taxes and how many households pay 30% or more of their income for housing, grades C.
7 notable people were born here, including Mark Hoppus and Jennifer O'Dell.