126 years in pictures
Census counts: 6,802 in 1910, 116,448 in 2020. The archive holds 12 old photos and papers going back to 1874 and 8 maps from 1895 on.
12 places on the National Register of Historic Places.
- 1900Richmond is settled
Each edition grades its towns against each other only.

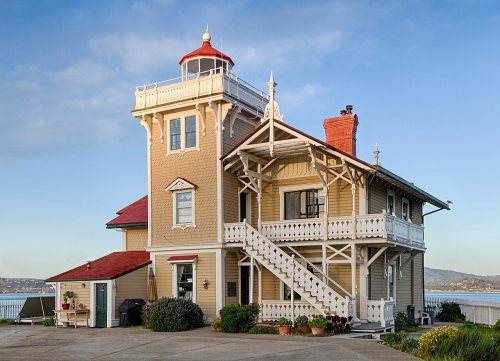
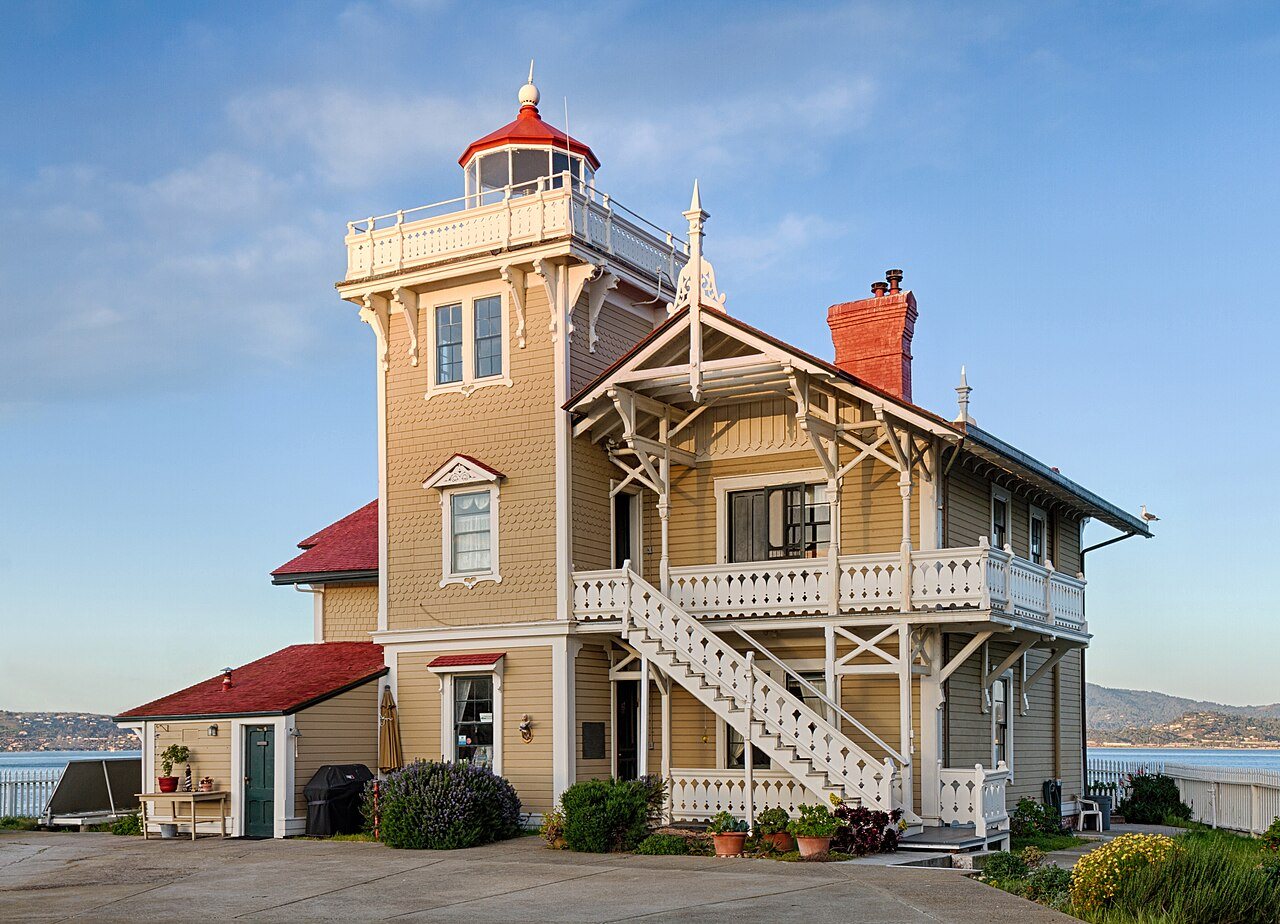
Richmond grades D overall, ranked 605th of 841 in California, mostly because of safety. It reports more crime per resident than 95% of U.S. towns, including 936 violent crimes reported to the FBI in 2025. One bright spot: it has 66 miles of trail. Richmond’s violent crime rate is 8.1 per 1,000 residents, above both California’s towns (2.9) and U.S. towns (1.6). Richmond is easier to get around on foot or by transit than 98% of U.S. towns. Richmond has 12 places on the National Register of Historic Places, among them East Brother Island Light Station and SS Red Oak Victory (victory ship).
Where Richmond beats most towns, and one thing worth knowing.
Census counts: 6,802 in 1910, 116,448 in 2020. The archive holds 12 old photos and papers going back to 1874 and 8 maps from 1895 on.
12 places on the National Register of Historic Places.
Each subject compared with towns across the country (schools within California), ordered by how far Richmond is from typical.
How TownRatings grades towns →
Museums, parks, gardens and other places to visit around Richmond. Close and well known come first.
Big draw9 mi MuseumAlcatraz Federal Penitentiary
Big draw11 mi LandmarkLombard Street
Big draw13 mi MuseumUSS Hornet
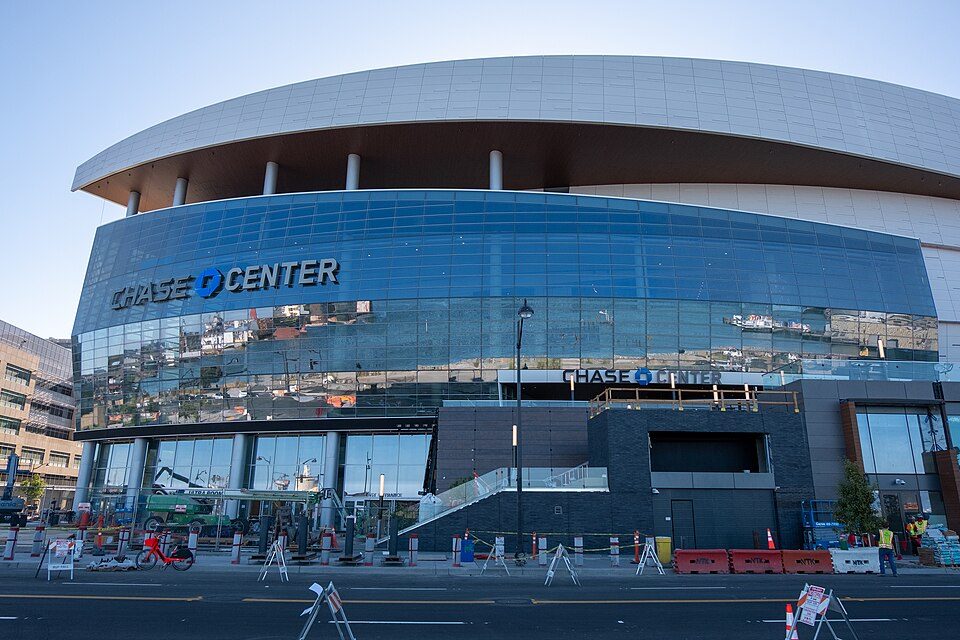
Big draw13 mi Stadium & arenaChase Center
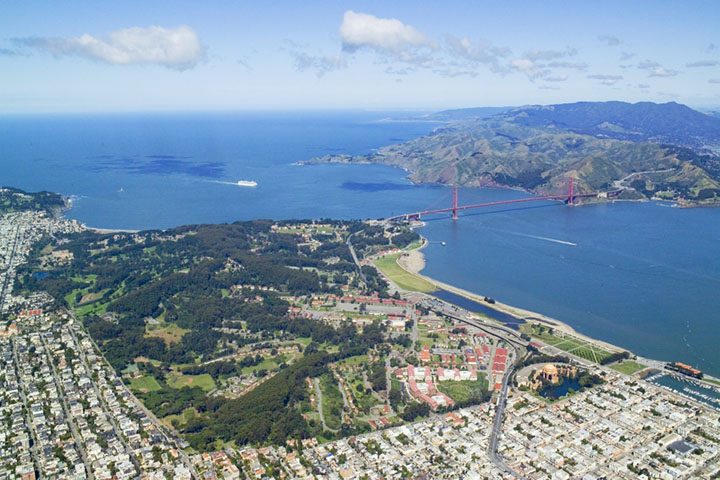
Big draw12 mi GardenPresidio of San Francisco
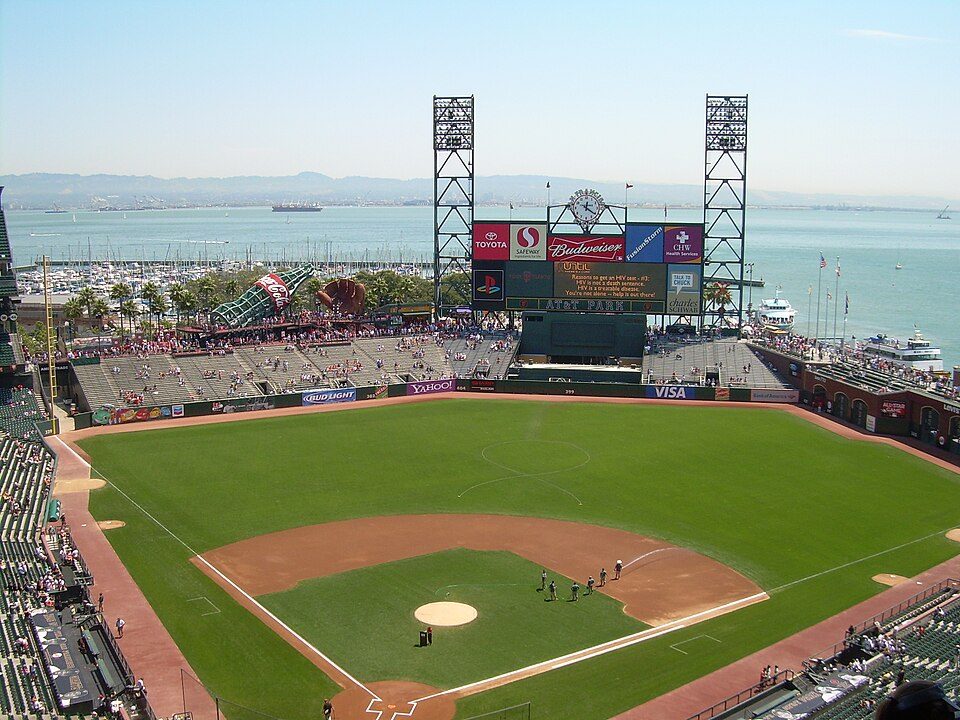
Big draw12 mi Stadium & arenaOracle ParkAlcatraz Federal Penitentiary: druchoy, CC BY-SA 2.0 · Lombard Street: The original uploader was Y6y6y6 at English Wikipedia., Public domain · USS Hornet: kitmasterbloke, CC BY 2.0 · Chase Center: Gregory Varnum, CC BY-SA 4.0 · Presidio of San Francisco: Robert Campbell, CC BY-SA 3.0 · Oracle Park: User Coasttocoast on en.wikipedia, CC BY-SA 3.0
Who provides power, water and the rest in Richmond, and how to reach them.
EPA SDWIS (Oct 9, 2026) · HIFLD + EIA-861 2025 · Census 2020 ZCTAs · NCES 2024–25 · registration: vote.gov, updated Nov 18, 2024.
Ordered by what stands out in Richmond.
Richmond has milder winter nights than nearly all U.S. towns and costs less than El Sobrante or any other town next door, but it trails even towns with similar incomes on health.
Reported crimes fell from 4,798 to 3,285 over the last three FBI years, a drop beyond ordinary year-to-year swings.
The property crime rate in Richmond is 20.4 per 1,000 residents. Richmond reports more crime per resident than most U.S. towns we grade: about 95% report less.
FBI crime data, 2025 · crimes reported to police
Its public schools are run by the West Contra Costa Unified school district. Three of its 38 schools are below, each with why it’s listed.
| School | Level | Students | Letter |
|---|---|---|---|
| Aspire Richmond Technology AcademyLargest public elementary schoolGrades K–5 | Grades K–5 | 586 | – |
| Richmond HighLargest public high schoolGrades 9–12 | Grades 9–12 | 1,280 | – |
| Middle College HighTop results in townGrades 9–12 | Grades 9–12 | 294 | A+ |
NCES · EDFacts · graded within CA on state tests and graduation
Expected storm and flood damage is higher than in 91% of U.S. communities. Since 1982, 36 flood insurance claims have been paid out in Richmond.
FEMA flood insurance claims · FEMA National Risk Index · OpenFEMA
Richmond’s trail density is 1.3 miles per square mile. The biggest place to walk is Wildcat Canyon Regional Park, 2,370 acres with 22.9 miles of trail.
| Biggest places to walk | Trails | Acres |
|---|---|---|
| 1. Wildcat Canyon Regional Park | 22.9 mi | 2,370 |
| 2. Point Pinole Regional Shoreline | 13.5 mi | 746 |
| 3. Miller/Knox Regional Shoreline | 6.4 mi | 547 |
Trails & parks © OpenStreetMap contributors · Conserved land: USGS PAD-US
Most working residents leave Richmond for work: only 10% work in town. Since 2013, Richmond has added 5,108 jobs, to 32,443 in 2023. 14% of Richmond residents live below the poverty line.
| Richmond | California towns | U.S. towns | |
|---|---|---|---|
| Average trip to work | 34 minutes | 28 minutes | 25 minutes |
| Below the poverty line | 14% | 10% | 9.6% |
| Working residents who work in town | 10% | 6.6% | 8% |
| Median household income | $95,000 | $95,000 | $80,000 |
Census LEHD 2023 · ACS
Its typical home is the least expensive on its borders; El Sobrante is next at $670K. The typical value, about $601K, is 16% below its June 2022 peak.
The typical Richmond home is worth about $601,000, down 1% in a year, 21% below the California typical home. 55% of households own their home in Richmond.
| Richmond | California towns | U.S. towns | |
|---|---|---|---|
| Households that own their home | 55% | 64% | 73% |
| Median rent | $1,960 a month | $1,895 a month | $1,185 a month |
| Renters paying 30%+ of income on rent | 56% | 55% | 48% |
Census ACS, 2020–24 · Zillow Home Value Index · Redfin Data Center
January nights average 43.3°, milder than in 96% of U.S. towns; July afternoons average 72.9°.
Richmond has warm winters and cool summers. Snow is almost unheard of.
| Richmond | California towns | U.S. towns | |
|---|---|---|---|
| July high | 73°F | 89°F | 85°F |
| January low | 43°F | 40°F | 22°F |
NOAA U.S. Climate Normals, 1991–2020
Against the 9,240 U.S. towns with household incomes like Richmond’s, it is less healthy than 76%, so it trails even them.
Richmond beats the California average on 1 of 32 CDC measures and trails it on 9.
| Richmond | California towns | U.S. towns | |
|---|---|---|---|
| Yearly checkup (CDC PLACES) | 70% | 72% | 79% |
| Feel lonely (CDC PLACES) | 38% | 36% | 33% |
| Food insecurity (CDC PLACES) | 24% | 16% | 14% |
| No health insurance, 18–64 (CDC PLACES) | 14% | 9% | 8.1% |
| What stands out | Richmond | CA |
|---|---|---|
| Fewer adults who have had cancer | 5.1% | 6.4% |
| More adults facing a utility shut-off | 10.5% | 7.3% |
CDC PLACES 2025 · modeled estimates for adults · CMS · HRSA
No broad age group is more than 4 points off the California average. 33% of adults 25 and older have a bachelor’s degree or more, vs 37% across California.
| Richmond | California towns | U.S. towns | |
|---|---|---|---|
| Aged 65 or older | 15% | 16% | 18% |
| Median age | 37.9 years | 39.1 years | 40.5 years |
| Under 18 | 21% | 22% | 22% |
| Bachelor’s degree or more, 25+ | 33% | 29% | 29% |
51% women, 49% men
That’s an even split within the survey’s margin of ±1.1 points. Across California, 50.1% of residents are women. Median age: women 39.4, men 36.4.
| Richmond | CA | U.S. | |
|---|---|---|---|
| Under 10 | 10.4% | 11.4% | 11.6% |
| 10 to 17 | 10.4% | 10.5% | 10.3% |
| 18 to 24 | 9.5% | 9.1% | 9.1% |
| 25 to 34 | 15.4% | 14.8% | 13.7% |
| 35 to 44 | 14.4% | 13.9% | 13.2% |
| 45 to 54 | 13.2% | 12.5% | 12.2% |
| 55 to 64 | 12.3% | 12.1% | 12.7% |
| 65 to 74 | 9.4% | 9.2% | 10.2% |
| 75 and older | 5.1% | 6.5% | 7% |
| No diploma | 20.5% | 15.3% | 10.4% |
| High school | 20.1% | 20.5% | 26% |
| Some college | 18.9% | 19.3% | 19.1% |
| Associate’s | 7.5% | 7.9% | 8.8% |
| Bachelor’s | 20% | 22.7% | 21.6% |
| Graduate | 13% | 14.4% | 14.1% |
U.S. Census Bureau · ACS 2020-2024 5-year estimates
32 within 15 miles of the center of Richmond
About 7 of every 100 Richmond residents are enrolled in college, about the same as California.
103,701 counted in 2010 and 116,448 in 2020; an estimated 114,861 in 2025.
U.S. Census 2010 & 2020 counts · Census Bureau estimate, July 1, 2025
12 places in Richmond on the National Register of Historic Places.
46 notable people were born in Richmond.


City in California, United States
Richmond is a city in western Contra Costa County, California, United States. The city was incorporated on August 3, 1905, and has a city council. Located in the San Francisco Bay Area's East Bay region, Richmond borders San Pablo, Albany, El Cerrito and Pinole in addition to the unincorporated communities of North Richmond, Hasford Heights, Kensington, El Sobrante, Bayview-Montalvin Manor, Tara Hills, and East Richmond Heights, and for a short distance San Francisco on Red Rock Island in the San Francisco Bay. Richmond is one of two cities, the other being San Rafael, that sits on the shores of both San Francisco Bay and San Pablo Bay. Its population was 116,448 as of the 2020 United State…
From Wikipedia, licensed CC BY-SA 4.0 · facts via Wikidata (CC0)
10 towns share a border with Richmond.
All 6 graded towns on its borders grade higher than its D; North Richmond (C−) is closest.
| Town | CA rank | Overall | Cost | Safety | Schools | Health |
|---|---|---|---|---|---|---|
| Richmond | #605 | D | C− | D | C+ | C+ |
| El Sobrante | #304 | C+ | C− | — | C+ | B+ |
| El Cerrito | #434 | C | D− | D | C+ | A |
| East Richmond Heights | #143 | B | C− | — | C+ | A |
| North Richmond | #464 | C− | D | — | C+ | C− |
| Kensington | #174 | B− | D | B− | C+ | A+ |
| Montalvin Manor | — | — | B− | — | C+ | C+ |
| Tara Hills | #295 | C+ | C− | — | C+ | B+ |
Montalvin Manor has fewer than 2,500 residents, so it gets subject grades but no overall grade. El Sobrante, East Richmond Heights, North Richmond, Montalvin Manor and Tara Hills report no FBI crime data of their own. Compare Richmond with a neighbor →
Short answers, built from the data on this page.
Richmond grades D overall, better than 10% of U.S. towns and #605 of 841 in California. It grades C+ for health, D for safety and C+ for schools. Safety is its weak spot, with a D.
Yes. That is 4.4 years of the area's median household income ($136,027 across the San Francisco-Oakland-Fremont, CA metro area). Cost of living, which also weighs rents, property taxes and how many households pay 30% or more of their income for housing, grades C−.
46 notable people were born here, including Jason Becker and Glenn E. Plummer.