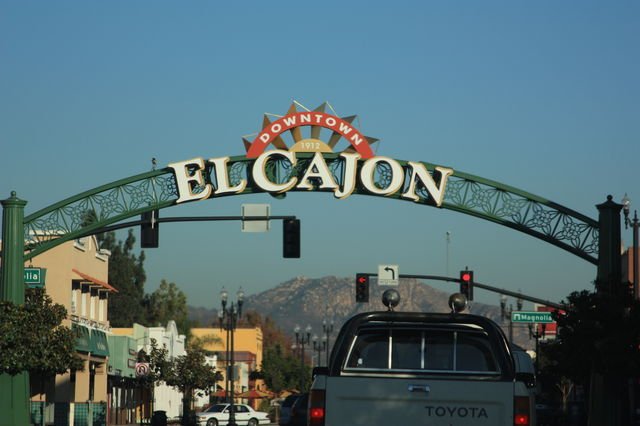
148 years in pictures
Census counts: 469 in 1920, 106,215 in 2020. The archive holds 7 old photos and papers going back to 2017 and 8 maps from 1893 on.
- 1878El Cajon is settled
Each edition grades its towns against each other only.

A city of 101,755, settled in 1878.
El Cajon earns a D, 644th among California's 841 graded towns, mostly because of safety. Its police reported 467 violent crimes reported to the FBI in 2025, a higher rate per resident than 76% of U.S. towns. What it does well: it is easier to get around on foot or by transit than 92% of U.S. towns. 21% of residents live below the poverty line in El Cajon, above both California’s towns (10%) and U.S. towns (9.6%). El Cajon is home to Grossmont College. El Cajon's civic life (library use, community groups, volunteering) trails 94% of U.S. towns.
Where El Cajon beats most towns.
| College | Students |
|---|---|
| Grossmont College | 8,594 |
| Southern California Seminary | 58 |
Jimmie Johnson2 colleges in town.
Each subject compared with towns across the country (schools within California), ordered by how far El Cajon is from typical.
How TownRatings grades towns →
Census counts: 469 in 1920, 106,215 in 2020. The archive holds 7 old photos and papers going back to 2017 and 8 maps from 1893 on.
Museums, parks, gardens and other places to visit around El Cajon. Close and well known come first.
Big draw21 mi LandmarkMexico–United States border wall
Big draw10 mi Stadium & arenaSnapdragon Stadium
13 mi Stadium & arenaPetco Park
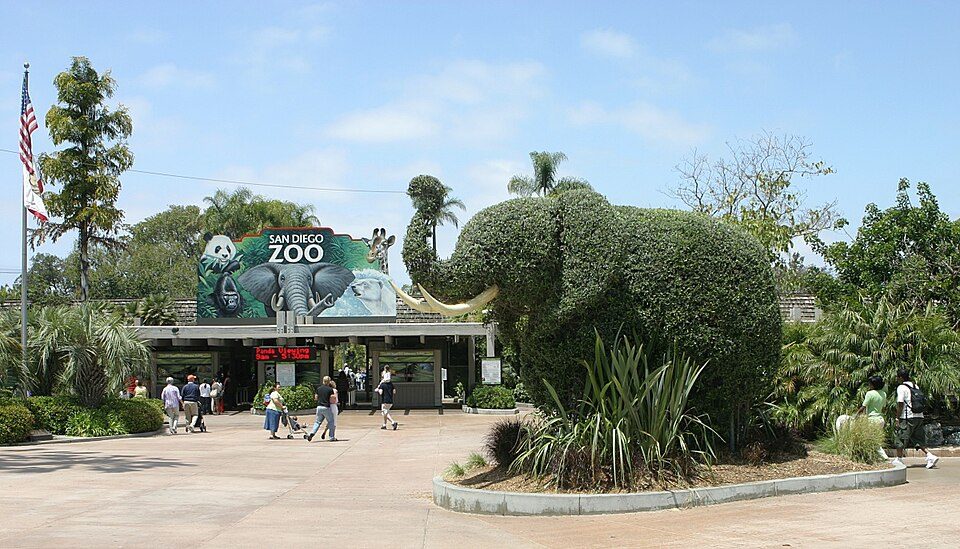
12 mi Zoo & aquariumSan Diego Zoo4.0M visitors a year
12 mi Park & preserveBalboa Park
16 mi Theme parkSeaWorld San Diego4.0M visitors a yearMexico–United States border wall: Földhegy, CC BY-SA 3.0 · Snapdragon Stadium: Terrible Tim, CC BY-SA 4.0 · Petco Park: Mds08011, CC BY 4.0 · San Diego Zoo: en:User:Cburnett, CC BY-SA 3.0 · Balboa Park: Antoine Taveneaux, CC BY-SA 3.0 · SeaWorld San Diego: ZooFari, CC BY-SA 3.0
Who provides power, water and the rest in El Cajon, and how to reach them.
EPA SDWIS (Oct 9, 2026) · HIFLD + EIA-861 2025 · Census 2020 ZCTAs · NCES 2024–25 · registration: vote.gov, updated Nov 18, 2024.
Ordered by what stands out in El Cajon.
El Cajon fares better on crime within California than nationally, has milder winter nights than nearly all U.S. towns and trades workers with San Diego and other neighbors.
At 32.2 crimes per 1,000 residents a year, it reports more crime than 59% of California’s graded towns. Reported crimes fell from 2,057 to 1,700 over the last three FBI years, a drop beyond ordinary year-to-year swings.
The violent crime rate in El Cajon is 4.6 per 1,000 residents. El Cajon reports more crime per resident than most U.S. towns we grade: about 76% report less.
| El Cajon | California towns | U.S. towns | |
|---|---|---|---|
| Violent crimes per 1,000 (2025) | 4.6 per 1,000 residents | 2.9 | 1.6 |
| Property crimes per 1,000 (2025) | 12 per 1,000 residents | 13.4 | 9.9 |
FBI crime data, 2025 · crimes reported to police
Three of its 38 schools are below, each with why it’s listed.
| School | Level | Students | Letter |
|---|---|---|---|
| Naranca ElementaryLargest public elementary schoolGrades K–6 | Grades K–6 | 985 | – |
| Granite Hills HighLargest public high schoolGrades 9–12 | Grades 9–12 | 2,331 | B+ |
| Literacy First CharterTop results in townGrades K–12 | Grades K–12 | 2,160 | A |
NCES · EDFacts · graded within CA on state tests and graduation
Expected storm and flood damage is higher than in 72% of U.S. communities. Since 1980, 26 flood insurance claims have been paid out in El Cajon.
FEMA flood insurance claims · FEMA National Risk Index · OpenFEMA
January nights average 42.7°, milder than in 96% of U.S. towns; July afternoons average 85.4°.
El Cajon has warm winters and warm summers, with very little rain. El Cajon’s January low is 43°F. Snow is almost unheard of.
| El Cajon | California towns | U.S. towns | |
|---|---|---|---|
| January low | 43°F | 40°F | 22°F |
| July high | 85°F | 89°F | 85°F |
NOAA U.S. Climate Normals, 1991–2020
El Cajon has about as many jobs (40,004) as working residents, but only 6,817 people both live and work here.
Most working residents leave El Cajon for work: only 15% work in town. Jobs based in El Cajon grew to 40,004 in 2023, 5,959 more than in 2013. The top destinations are San Diego (38%), La Mesa (4%) and Santee (3%).
| El Cajon | California towns | U.S. towns | |
|---|---|---|---|
| Working residents who work in town | 15% | 6.6% | 8% |
| Median household income | $68,000 | $95,000 | $80,000 |
| Average trip to work | 25 minutes | 28 minutes | 25 minutes |
Census LEHD 2023 · ACS
All 7 graded neighbors score healthier than its C+, from Bostonia (B−) to Casa de Oro-Mount Helix (A).
El Cajon beats the California average on 0 of 32 CDC measures and trails it on 18. 20% of El Cajon adults report frequent mental distress.
| El Cajon | California towns | U.S. towns | |
|---|---|---|---|
| Frequent mental distress (CDC PLACES) | 20% | 17% | 17% |
| Food insecurity (CDC PLACES) | 23% | 16% | 14% |
| Feel lonely (CDC PLACES) | 38% | 36% | 33% |
| Yearly checkup (CDC PLACES) | 72% | 72% | 79% |
| What stands out | El Cajon | CA |
|---|---|---|
| More adults with COPD | 7.4% | 5.1% |
| More older adults who have lost all their teeth | 15% | 10.6% |
| More smokers | 15.3% | 10.9% |
CDC PLACES 2025 · modeled estimates for adults · CMS · HRSA
70.1% of renter households pay 30% or more of their income for housing, against 55.3% across California.
The typical El Cajon home is worth about $813,000, about the same as a year ago, 7% above the California typical home. 42% of households own their home in El Cajon.
| El Cajon | California towns | U.S. towns | |
|---|---|---|---|
| Households that own their home | 42% | 64% | 73% |
| Renters paying 30%+ of income on rent | 70% | 55% | 48% |
| Median rent | $1,856 a month | $1,898 a month | $1,185 a month |
Census ACS, 2020–24 · Zillow Home Value Index · Redfin Data Center
3.2 miles of trail in 12 parks and preserves. The biggest park or preserve is Hillside Park, at 41 acres.
| El Cajon | California towns | U.S. towns | |
|---|---|---|---|
| Miles of trail per square mile | 0.2 miles per square mile | 1.0 | 0.4 |
| Conserved land | 2.6% | 4.3% | 4.3% |
| Biggest places to walk | Trails | Acres |
|---|---|---|
| 1. John F Kennedy Park | 0.6 mi | 18 |
| 2. Cajon Valley Park | 0.5 mi | 12 |
| 3. Tuttle Park | 0.5 mi | 9 |
Trails & parks © OpenStreetMap contributors · Conserved land: USGS PAD-US
26 within 15 miles of the center of El Cajon
About 8 of every 100 El Cajon residents are enrolled in college, about the same as California.
23 notable people were born in El Cajon.


City in California, United States
El Cajon ( el kə-HOHN, Spanish pronunciation: [el kaˈxon] ; Spanish: El Cajón, lit. 'the box') is a city in San Diego County, California, United States, 17 mi (27 km) east of downtown San Diego. The city takes its name from Rancho El Cajón, which was named for the box-like shape of the valley that surrounds the city, and the origin of the city's common nickname "the Box". As of the 2020 census, El Cajon had a population of 106,215.
From Wikipedia, licensed CC BY-SA 4.0 · facts via Wikidata (CC0)
8 towns share a border with El Cajon.
All 7 graded towns on its borders grade higher than its D; Granite Hills (D) is closest.
| Town | CA rank | Overall | Cost | Safety | Schools | Health |
|---|---|---|---|---|---|---|
| El Cajon | #644 | D | D | C− | C+ | C+ |
| Casa de Oro-Mount Helix | #157 | B | D | — | B− | A |
| Granite Hills | #554 | D | D− | — | C+ | B+ |
| Bostonia | #399 | C | C− | — | B− | B− |
| La Mesa | #277 | C+ | D− | C | B | A− |
| Santee | #142 | B | D− | B | B+ | A− |
| Rancho San Diego | #369 | C | D− | — | C+ | A |
| Winter Gardens | #382 | C | D | — | C+ | B |
Casa de Oro-Mount Helix, Granite Hills, Bostonia, Rancho San Diego and Winter Gardens report no FBI crime data of their own. Compare El Cajon with a neighbor →
Short answers, built from the data on this page.
El Cajon grades D overall, better than 8% of U.S. towns and #644 of 841 in California. It grades C+ for health, C− for safety and C+ for schools. Cost of living is its weak spot, with a D.
Yes. That is 7.6 years of the area's median household income ($106,268 across the San Diego-Chula Vista-Carlsbad, CA metro area). Cost of living, which also weighs rents, property taxes and how many households pay 30% or more of their income for housing, grades D.
23 notable people were born here, including Jimmie Johnson and Joe Musgrove.