
Okie camp shack, 1980
Weedpatch’s story
Weedpatch in pictures
Census counts: 1,553 in 1980, 2,206 in 2020. The archive holds 11 old photos and papers going back to 1980 and 5 maps from 1930 on.
Explore the history →Each edition grades its towns against each other only.

A town of 2,685 in California.
The weak point is health: on CDC estimates, its residents' health ranks in the bottom 2% nationally. At D overall, Weedpatch ranks 659th of 841 in California. On that grade it does better than 7% of U.S. towns. It lags on incomes as well (D): the median household income is $22K, and 46% of residents live below the poverty line. Its best grade is for cost of living: a typical home costs about $137K, 2 years of the Bakersfield metro’s $70K median household income. Hazard risk is weaker too: FEMA rates its natural-hazard risk higher than 83% of U.S. communities, with earthquakes at the top. 47% of residents live below the poverty line in the town, where California’s towns sit at 10% and U.S. towns at 9.6%. Only 8 of the 847 California towns we compare have a lower share of adults with a bachelor’s degree than Weedpatch.
Figures: home values, Zillow · incomes, Census ACS, 2020–24 · health, CDC PLACES · FEMA National Risk Index.
2,658 counted in 2010 and 2,206 in 2020.
U.S. Census 2010 & 2020 counts
Each subject compared with towns across the country (schools within California), ordered by how far Weedpatch is from typical.
How TownRatings grades towns →
Census counts: 1,553 in 1980, 2,206 in 2020. The archive holds 11 old photos and papers going back to 1980 and 5 maps from 1930 on.
Explore the history →Weedpatch is unincorporated, so Kern County and regional agencies provide most services.
EPA SDWIS (Oct 9, 2026) · HIFLD + EIA-861 2025 · Census 2020 ZCTAs · NCES 2024–25 · registration: vote.gov, updated Nov 18, 2024.
Ordered by what stands out in Weedpatch.
Weedpatch has more 90° days than nearly all U.S. towns and has homes that are cheap against local pay, but it has poverty well above the California rate.
In Weedpatch, 54% of adults get no exercise outside work. Only one of the 847 California towns we compare has a higher share of adults who have diabetes than Weedpatch. On the CDC’s 32 measures, Weedpatch is ahead of California on 1 and behind on 27.
| Weedpatch | California towns | U.S. towns | |
|---|---|---|---|
| Fair or poor health (CDC PLACES) | 52% | 22% | 19% |
| Smoke cigarettes (CDC PLACES) | 24% | 11% | 14% |
| Obesity (CDC PLACES) | 46% | 29% | 35% |
| Diabetes (CDC PLACES) | 22% | 12% | 12% |
| What stands out | Weedpatch | CA |
|---|---|---|
| Fewer adults who have had cancer | 3.7% | 6.4% |
| More uninsured adults | 39.1% | 10.6% |
CDC PLACES 2025 · modeled estimates for adults · CMS · HRSA
FEMA puts 64% of Weedpatch’s expected hazard losses down to earthquakes, and 24% to inland flooding. Since 1995, Weedpatch has seen 7 flood insurance claims paid out.
FEMA flood insurance claims · FEMA National Risk Index · OpenFEMA
Employers in Weedpatch added 47 jobs between 2013 and 2023, to 311. Among 846 California towns, just one has a lower middle household income than Weedpatch. For working residents here, the share who work locally is 2.2%. The top destinations are Bakersfield (26%), Los Angeles (7%) and Edmundson Acres (3%).
| Weedpatch | California towns | U.S. towns | |
|---|---|---|---|
| Below the poverty line | 47% | 10% | 9.6% |
| Median household income | $22,000 | $95,000 | $80,000 |
| Working residents who work in town | 2.2% | 6.6% | 8% |
| Average trip to work | 26 minutes | 28 minutes | 25 minutes |
Census LEHD 2023 · ACS
2.2 miles of trail. Weedpatch’s density of trails comes in at 0.6 miles per square mile.
| Weedpatch | California towns | U.S. towns | |
|---|---|---|---|
| Conserved land | 0.2% | 4.3% | 4.3% |
| Miles of trail per square mile | 0.6 miles per square mile | 1.0 | 0.4 |
Trails & parks © OpenStreetMap contributors · Conserved land: USGS PAD-US
The Bakersfield Ap weather station, 16 miles away, records that about 112 days a year reach 90°, more than in 97% of U.S. towns. July afternoons average 98.9°, hotter than in 99% of U.S. towns; January nights average 40.3°.
For Weedpatch, the July high is 99°F. It almost never snows.
| Weedpatch | California towns | U.S. towns | |
|---|---|---|---|
| July high | 99°F | 89°F | 85°F |
| January low | 40°F | 41°F | 22°F |
NOAA U.S. Climate Normals, 1991–2020
At 2 years of the Bakersfield metro’s $70K median household income, the typical home costs less against local pay than in any other California town; that ratio is one input to its B for cost of living. 71.8% of renter households pay 30% or more of their income for housing, against 55.3% across California.
Among households in Weedpatch, 33% are owner-occupiers. The going rate for rent locally is $915 a month.
| Weedpatch | California towns | U.S. towns | |
|---|---|---|---|
| Households that own their home | 33% | 64% | 73% |
| Median rent | $915 a month | $1,898 a month | $1,185 a month |
Census ACS, 2020–24 · Zillow Home Value Index · Redfin Data Center
Museums, parks, gardens and other places to visit around Weedpatch. Close and well known come first.
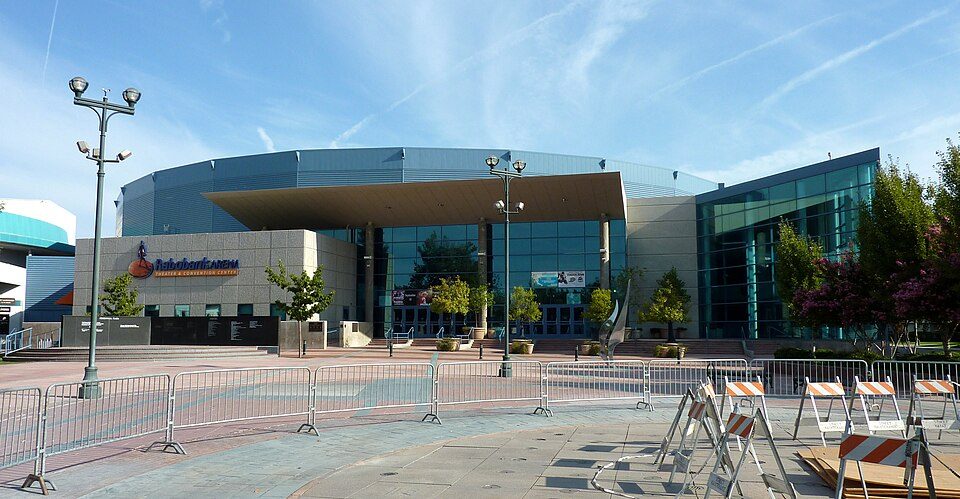 11 mi Stadium & arenaDignity Health Arena
 25 mi MuseumFort Tejon
 19 mi National MonumentCésar E. Chávez National Monument31K visitors a year
 13 mi MuseumKern County Museum85K visitors a year14 mi Zoo & aquariumCalifornia Living Museum
 11 mi MuseumBakersfield Museum of Art
Dignity Health Arena: Bobak Ha'Eri, CC BY 3.0 · Fort Tejon: Yellowute at English Wikipedia, Public domain · César E. Chávez National Monument: Bobak Ha'Eri, CC BY 3.0 · Kern County Museum: (WT-de) Mistoffeles, CC BY-SA 4.0 · Bakersfield Museum of Art: Skyman9999. Skyman9999, CC0
2 within 15 miles of the center of Weedpatch
About 2 of every 100 Weedpatch residents are enrolled in college, against 8 across California.
Where Weedpatch’s working residents go each day. Line width shows the share.
Census LEHD 2023
Census-designated place in California, United States
Weedpatch (formerly Weed Patch and Alexander's Corner) is an unincorporated community and census-designated place (CDP) in Kern County, California, United States. Weedpatch is 10 miles (16 km) south-southeast of Bakersfield. It is considered to be one of the poorest areas in Kern County. As of the 2020 census it had a population of 2,206.
From Wikipedia, licensed CC BY-SA 4.0 · facts via Wikidata (CC0)
One town shares a border with Weedpatch.
Weedpatch and Lamont report no FBI crime data of their own. Compare Weedpatch with a neighbor →
Short answers, built from the data on this page.
Weedpatch grades D overall, better than 7% of U.S. towns and #659 of 841 in California. It grades D− for health and C+ for schools. Health is its weak spot, with a D−.
The typical home is worth about $137,000, 82% below the California typical home. Cost of living, which also weighs rents, property taxes and how many households pay 30% or more of their income for housing, grades B.


