Guest, Sign inJoin

Post to Pismo Beach

We’ll email a one-tap link to publish your post. No password, and nothing is public until you click it.
Already a member? Sign in
Pismobeach02032022
California›San Luis Obispo County

Pismo BeachCA

A town of 7,911, settled in 1923.

Trash & recycling
3 bordering townsMap →
Photo: Soundsfancy · CC BY-SA 4.0
Photo of Pismo Beach

Pismo Beach, CA · Photo: Soundsfancy · CC BY-SA 4.0 · Source ↗

Is Pismo Beach a good place to live?

Homes are expensive, about $1.1 million for a typical one and 11.2 times the San Luis Obispo metro’s $97K median household income. Overall it grades C, 343rd of 841 graded towns in California. CDC estimates put its residents' health ahead of 88% of the country and it has 8 miles of trail. Its weakest subject is hazard risk: FEMA rates its natural-hazard risk higher than 83% of U.S. communities, with inland flooding at the top. 33% of residents are 65 or older in Pismo Beach, above both California’s towns (16%) and U.S. towns (18%). The biggest park or preserve is Chumash Heritage National Marine Sanctuary, at 6,237 acres. Only 36 of California’s 463 towns score higher on civic life.

What makes Pismo Beach stand out

Where Pismo Beach beats most towns.

Get outside

8 miles of trails in Pismo Beach

3.2% of the town is conserved land, across 17 parks and preserves.

Map of trails and conserved land in Pismo BeachConservedTrails
1
Pismo State Beach1.1 mi of trails · 216 acres
Directions
2
North Beach Campground1.1 mi of trails · 43 acres
Directions
3
Chumash Park0.7 mi of trails · 28 acres
Directions
Trails © OpenStreetMap contributors · USGS PAD-US

How Pismo Beach grades

Each subject compared with towns across the country (schools within California), ordered by how far Pismo Beach is from typical.

How grading works

Character Graded, but not part of the overall grade.
Described, not graded Taste, not quality: snow or an older crowd is neither good nor bad.

How TownRatings grades towns →

John Price House
John Price House · National Register of Historic Places
Pismo Beach’s story

103 years in pictures

Census counts: 1,425 in 1950, 8,072 in 2020. The archive holds 10 old photos and papers going back to 1910 and 6 maps from 1897 on.

1 place on the National Register of Historic Places.

  • 1923Pismo Beach is settled
Explore the history →
Getting set up

Moving to Pismo Beach: who provides what

Who provides power, water and the rest in Pismo Beach, and how to reach them.

The full setup list →
PowerPG&E37.5¢/kWh · EIA 2025HIFLD · EIA
WaterPismo Beach Water Department3 health-based violations in 5 years · EPAEPA
Internet6 providers100% of addresses get 100/20 MbpsFCC
Trash & dumpTown’s haulerThe town’s contract hauler picks up at the curb for every homeTown site
SchoolsLucia Mar Unified School DistrictWhich school depends on your addressNCES
Register to voteOnlineIn California you can register online until 15 days before Election Day, in person up to and including Election Day, or by mail (postmarked 15 days before).vote.gov
Who runs elections hereSan Luis Obispo County Clerk-ElectionsSan Luis Obispo County; contacts on the Handbook page.FVAP, Sep 2020
ZIP code9344993449 100%Census 2020

EPA SDWIS (Oct 9, 2026) · HIFLD + EIA-861 2025 · Census 2020 ZCTAs · NCES 2024–25 · registration: vote.gov, updated Nov 18, 2024.

The data

Ordered by what stands out in Pismo Beach.

Pismo Beach is a second-home town and has milder winter nights than nearly all U.S. towns, but it has homes that cost more against local pay than most of California.

HealthA

For health, Pismo Beach earns an A

28% of Pismo Beach adults sleep under 7 hours. Pismo Beach beats the California average on 18 of 32 CDC measures and trails it on 6. 14% of Pismo Beach adults report frequent mental distress.

88%healthier than U.S. townsAHealth Grade
Pismo BeachCalifornia townsU.S. towns
Sleep under 7 hours (CDC PLACES)28%35%36%
Frequent mental distress (CDC PLACES)14%17%17%
Feel lonely (CDC PLACES)30%36%33%
Obesity (CDC PLACES)25%29%35%
32 measures vs. California
18 better8 too close to call6 worse
What stands outPismo BeachCA
Fewer uninsured adults4.5%10.6%
Fewer adults facing food insecurity8.1%17.9%
More adults who have had cancer12%6.4%
French Hospital Medical Center
8.7 mi away · emergency room
1 of 3
care shortages: mental health
81st
percentile among CA towns

CDC PLACES 2025 · modeled estimates for adults · CMS · HRSA

SchoolsB+

Pismo Beach’s public schools outperform 68% of California districts

Its public schools are run by the Lucia Mar Unified school district. One of its 2 schools is below, with why it’s listed.

68%of CA districts it outscoresB+School Grade
SchoolLevelStudentsLetter
Judkins MiddleLargest public middle schoolGrades 7–8Grades 7–8431–

NCES · EDFacts · graded within CA on state tests and graduation

SafetyC−

Pismo Beach reports more crime per resident than 85% of U.S. towns

Reported crimes fell from 294 to 168 over the last three FBI years, a drop beyond ordinary year-to-year swings.

The violent crime rate in Pismo Beach is 3.8 per 1,000 residents.

15%of U.S. towns report more crimeC−Safety Grade
Pismo BeachCalifornia townsU.S. towns
Violent crimes per 1,000 (2025)3.8 per 1,000 residents2.91.6
Property crimes per 1,000 (2025)17.3 per 1,000 residents13.39.9

Violent crime per 1,000 residents

Pismo Beach3.8
California4.4
U.S.3.3

Property crime per 1,000 residents

Pismo Beach17.3
California18.2
U.S.15.5
15th
percentile among U.S. towns we grade
22nd
percentile among CA towns
30
violent crimes reported in 2025
138
property crimes reported in 2025

FBI crime data, 2025 · crimes reported to police

HousingCost of living grade D−

For cost of living, Pismo Beach earns a D−

At 11.2 years of the San Luis Obispo metro’s $97K median household income, the typical home (about $1.09M) costs more against local pay than in 83% of California towns; that ratio is one input to its D− for cost of living.

Pismo Beach’s median rent is $2,232 a month. The typical Pismo Beach home is worth about $1,095,000, up 2.2% in a year, 44% above the California typical home.

$1.09MZillow home value
Pismo BeachCalifornia townsU.S. towns
Median rent$2,232 a month$1,895 a month$1,185 a month
Households that own their home65%64%73%

Typical home value

Pismo Beach$1.09M
California$762K
Market temperature
Seller’s marketA seller's marketBuyer’sSeller’s
43
days on market
97%
sale-to-list price
+2.2%
value change, 1 year
16
homes sold in May

Census ACS, 2020–24 · Zillow Home Value Index · Redfin Data Center

Natural hazardsHazard risk grade D

Pismo Beach faces a very high natural-hazard risk, led by inland flooding

Since 1983, 8 flood insurance claims have been paid out in Pismo Beach.

83risk score of 100
FEMA risk score
83Very high riskLowerHigher
Inland floodingEarthquakesTsunamis
8
paid flood claims since 1983
6
federal disasters paid out here

FEMA flood insurance claims · FEMA National Risk Index · OpenFEMA

OutdoorsA+

Conserved land covers 3.2% of Pismo Beach

7.9 miles of trail in 17 parks and preserves.

#505for trails in CA
Pismo BeachCalifornia townsU.S. towns
Miles of trail per square mile0.6 miles per square mile1.00.4
Conserved land3.2%4.3%4.3%
3.2%
conserved · 269 of 8,522 acres
7.9 mi
of trails · 0.6 per sq mi
Biggest places to walkTrailsAcres
1. Pismo State Beach1.1 mi216
2. North Beach Campground1.1 mi43
3. Chumash Park0.7 mi28

Trails & parks © OpenStreetMap contributors · Conserved land: USGS PAD-US

Climate

A typical July afternoon in Pismo Beach is cooler than in most of California or the rest of the country

January nights average 46.4°, milder than in 97% of U.S. towns; July afternoons average 67.5°.

Pismo Beach has warm winters and cool summers, with very little rain. Snow is almost unheard of.

70°summer high
Pismo BeachCalifornia townsU.S. towns
July high68°F89°F85°F
January low46°F40°F22°F

Typical low → high °F

Winter46–62°
Spring49–64°
Summer55–68°
Fall53–68°
+2.0°
vs. the 20th-century average
70°
typical summer high

NOAA U.S. Climate Normals, 1991–2020

Work & commuteJobs & income grade B+

With 1.3 jobs for every working resident, Pismo Beach draws in 3,627 commuters

Most working residents leave Pismo Beach for work: only 11% work in town. Jobs based in Pismo Beach grew to 3,955 in 2023, 410 more than in 2013. 6.9% of residents live below the poverty line in Pismo Beach.

11%work in town
Pismo BeachCalifornia townsU.S. towns
Median household income$118,000$95,000$80,000
Average trip to work23 minutes28 minutes25 minutes
Work from home17%14%11%
Below the poverty line6.9%10%9.6%

Where working residents work

In Pismo Beach11%
San Luis Obispo19%
Santa Maria9%
Arroyo Grande5%
Los Angeles4%
12 mi
median commute distance
3,955
jobs based in Pismo Beach
Balanced
jobs vs. working residents
A−
Walkability grade: more walkable than 81% of U.S. towns

Census LEHD 2023 · ACS

Nearby attractions

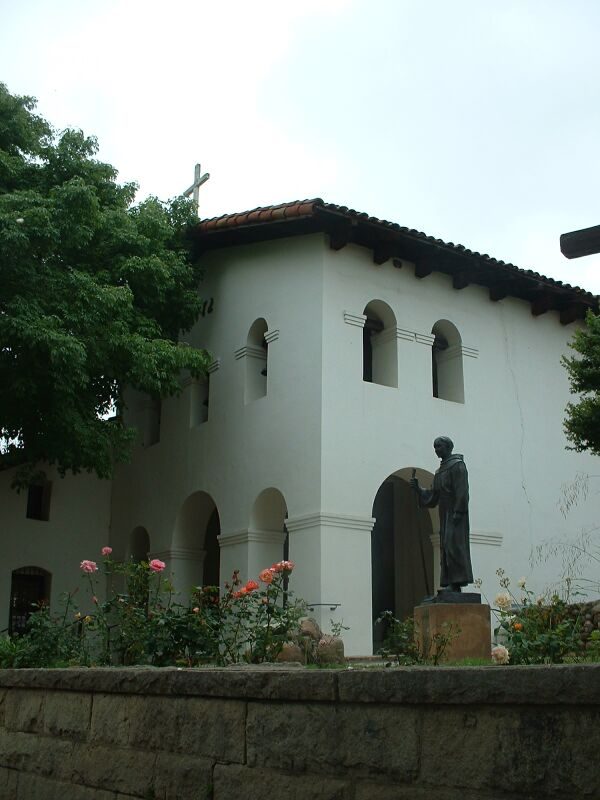
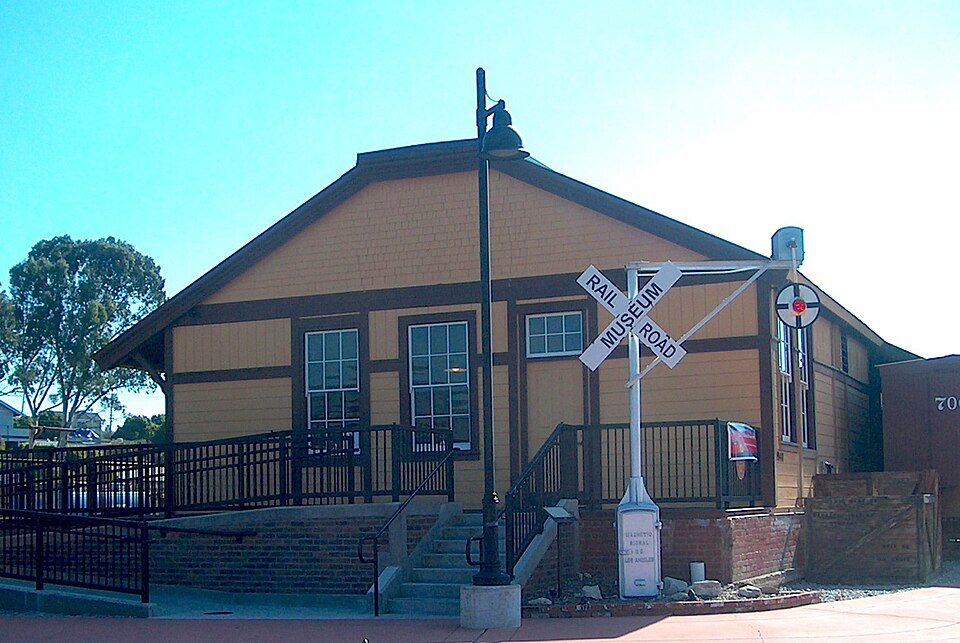
Mission San Luis Obispo de Tolosa and 11 more within 40 miles

Museums, parks, gardens and other places to visit around Pismo Beach. Close and well known come first.

All 14 attractions →
Sources: National Park Service · ski areas © OpenSkiMap / OpenStreetMap contributors · Wikidata · Wikipedia readership · photos via Wikimedia Commons
Photo credits

Mission San Luis Obispo de Tolosa: Stephen Lea, CC BY-SA 3.0 · Montaña de Oro State Park: BorisFromStockdale, CC BY-SA 3.0 · San Luis Obispo Railroad Museum: SLOGlen, CC BY-SA 4.0 · Dana Adobe: Ken Figlioli, CC BY-SA 2.0

Keep exploring

Everything we know about Pismo Beach

19pages on Pismo Beach
After high school

Colleges nearby

3 within 15 miles of the center of Pismo Beach

About Pismo Beach

City in California, United States

Official town website ↗

Pismo Beach (Chumash: Pismuʔ) is a city in the southern portion of San Luis Obispo County, in the Central Coast area of California, United States. Its population was 8,072 at the 2020 census, up from 7,655 in 2010. The city was reincorporated in 1946. Its waterfront includes a pier built in 1924 and renovated in 2018. Nearby Pismo State Beach includes a wintering site for monarch butterflies.

From Wikipedia, licensed CC BY-SA 4.0 · facts via Wikidata (CC0)

Established
1946
Area
14 sq mi
Elevation
56 ft
ZIP code
93448, 93449
Area code
805

Pismo Beach’s neighbors

3 towns share a border with Pismo Beach.

Explore the map →
How the neighbors grade
TownCA rankOverallCostSafetySchoolsHealth
Pismo Beach#343CD−C−B+A
Grover Beach#355CD−B−B+B−
Avila Beach——D—AA+
Arroyo Grande#149BD−B−B+A

Avila Beach has fewer than 2,500 residents, so it gets subject grades but no overall grade. Avila Beach reports no FBI crime data of its own. Compare Pismo Beach with a neighbor →

Questions about Pismo Beach

Short answers, built from the data on this page.

Is Pismo Beach, CA a good place to live?

Pismo Beach grades C overall, better than 34% of U.S. towns and #343 of 841 in California. It grades A for health, C− for safety and B+ for schools. Cost of living is its weak spot, with a D−.

Is Pismo Beach, CA expensive?

Yes. Cost of living, which also weighs rents, property taxes and how many households pay 30% or more of their income for housing, grades D−.