Guest, Sign inJoin

Post to Jurupa Valley

We’ll email a one-tap link to publish your post. No password, and nothing is public until you click it.
Already a member? Sign in
Mount Jurupa
California›Riverside County

Jurupa ValleyCA

A city of 107,311, settled in 2011.

Trash & recycling
5 bordering townsMap →
Photo: Scottthezombie · CC BY-SA 4.0
Photo of Jurupa Valley

Jurupa Valley, CA · Photo: Scottthezombie · CC BY-SA 4.0 · Source ↗

Is Jurupa Valley a good place to live?

Jurupa Valley grades D overall, 653rd among California's 841 graded towns, mostly because of safety. Its crime rate is higher than 75% of U.S. towns, with 150 violent crimes reported to the FBI in 2025. In its favor, it has 93 miles of trail. Jurupa Valley’s trail density is 2.1 miles per square mile, above both California’s towns (1.0) and U.S. towns (0.4). Jurupa Valley's civic life (library use, community groups, volunteering) trails 99% of U.S. towns. FEMA rates its natural-hazard risk higher than 98% of U.S. communities, with inland flooding at the top.

What makes Jurupa Valley stand out

Where Jurupa Valley beats most towns, and one thing worth knowing.

A commuter town

91% of working residents leave Jurupa Valley for work

Where Jurupa Valley’s working residents go each day. Line width shows the share.

9% → Riverside Riverside 9% 6% → Ontario Ontario 6% 5% → Los Angeles Los Angeles 5% 4% → Corona Corona 4% 4% → San Bernardino San Bernardino 4% 3% → Rancho Cucamonga Rancho Cucamonga 3% Jurupa Valley · 9% stay
34,633jobs based in Jurupa Valley
9%of working residents work in town
15 mimedian commute distance

Census LEHD 2023

How Jurupa Valley grades

Each subject compared with towns across the country (schools within California), ordered by how far Jurupa Valley is from typical.

How grading works

Character Graded, but not part of the overall grade.
Described, not graded Taste, not quality: snow or an older crowd is neither good nor bad.

How TownRatings grades towns →

Cornelius Jensen Ranch
Cornelius Jensen Ranch · National Register of Historic Places
Jurupa Valley’s story

15 years in pictures

The archive holds 6 old photos and papers going back to 1870 and 4 maps from 1953 on.

2 places on the National Register of Historic Places.

  • 2011Jurupa Valley is settled
Explore the history →
Nearby attractions

Disneyland and 91 more within 40 miles

Museums, parks, gardens and other places to visit around Jurupa Valley. Close and well known come first.

All 268 attractions →
Sources: National Park Service · ski areas © OpenSkiMap / OpenStreetMap contributors · Wikidata · Wikipedia readership · photos via Wikimedia Commons
Photo credits

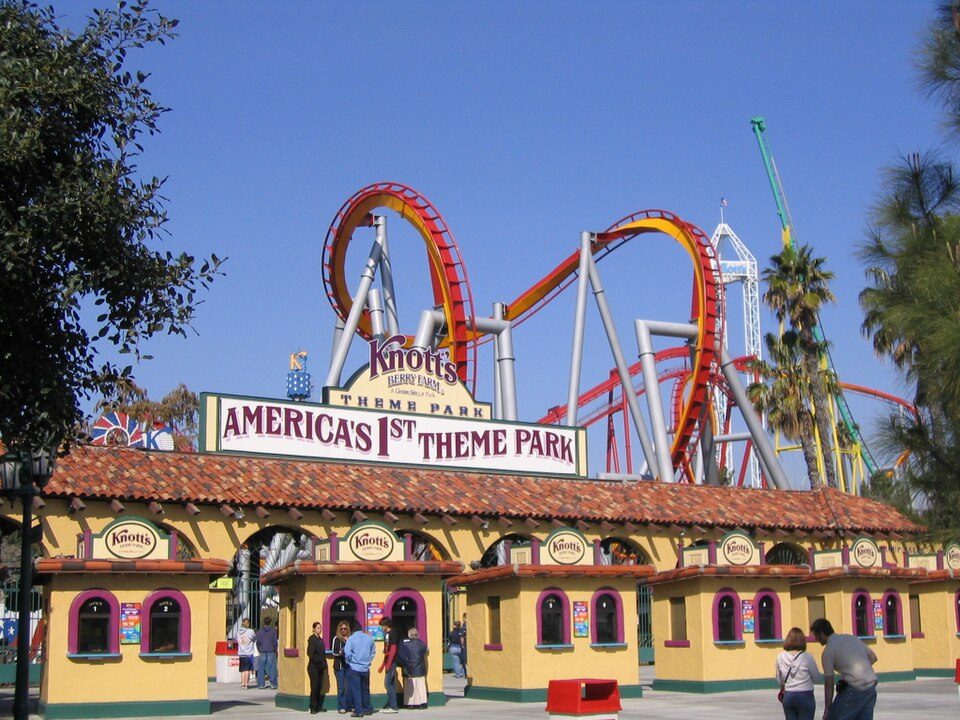
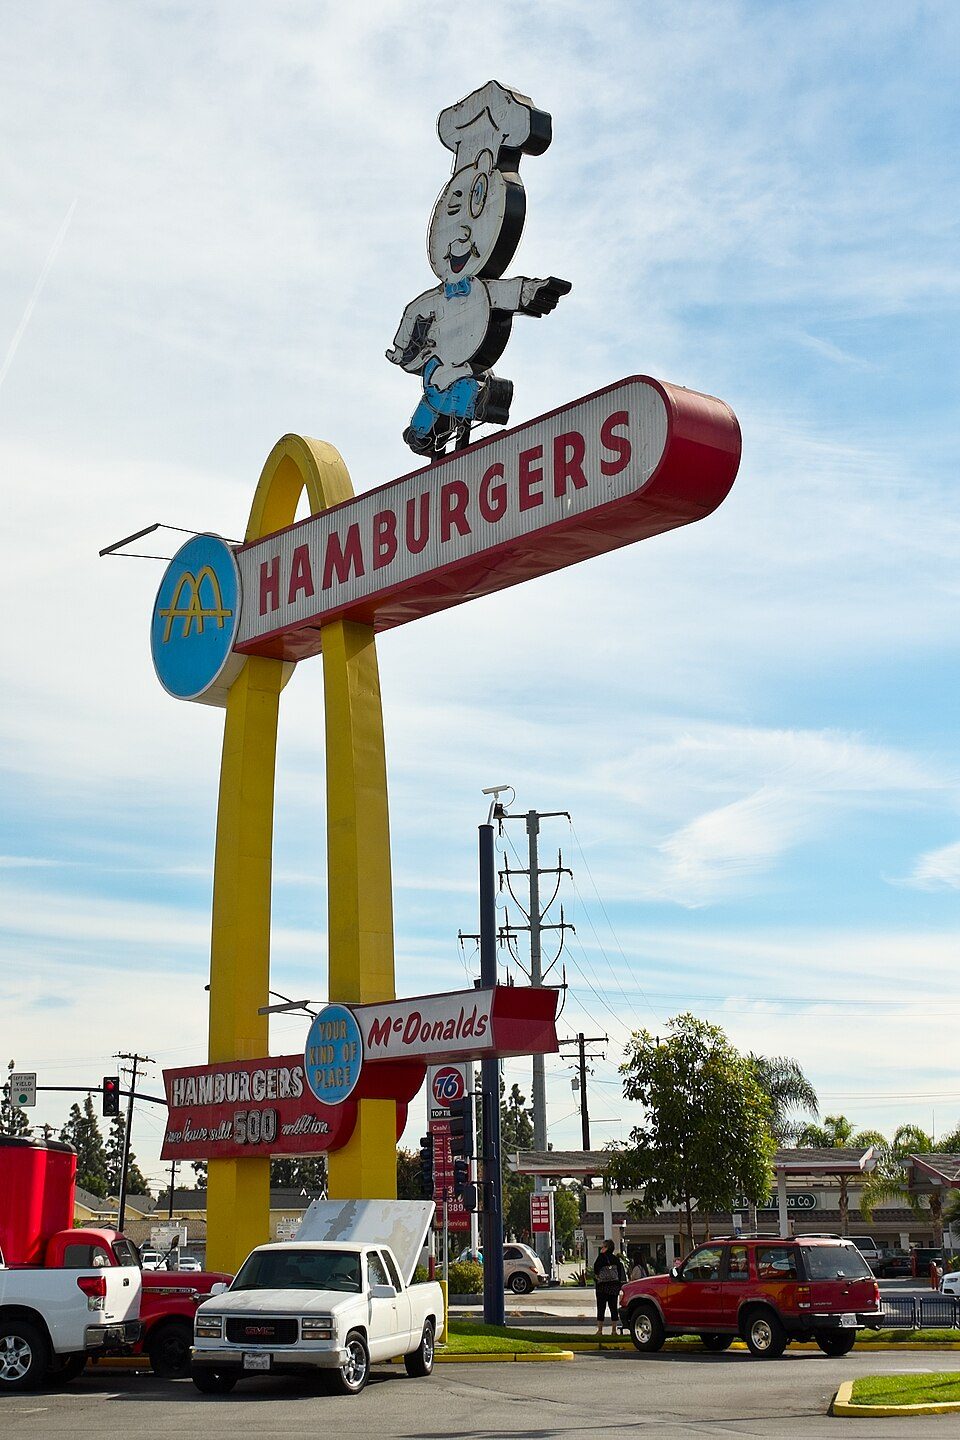
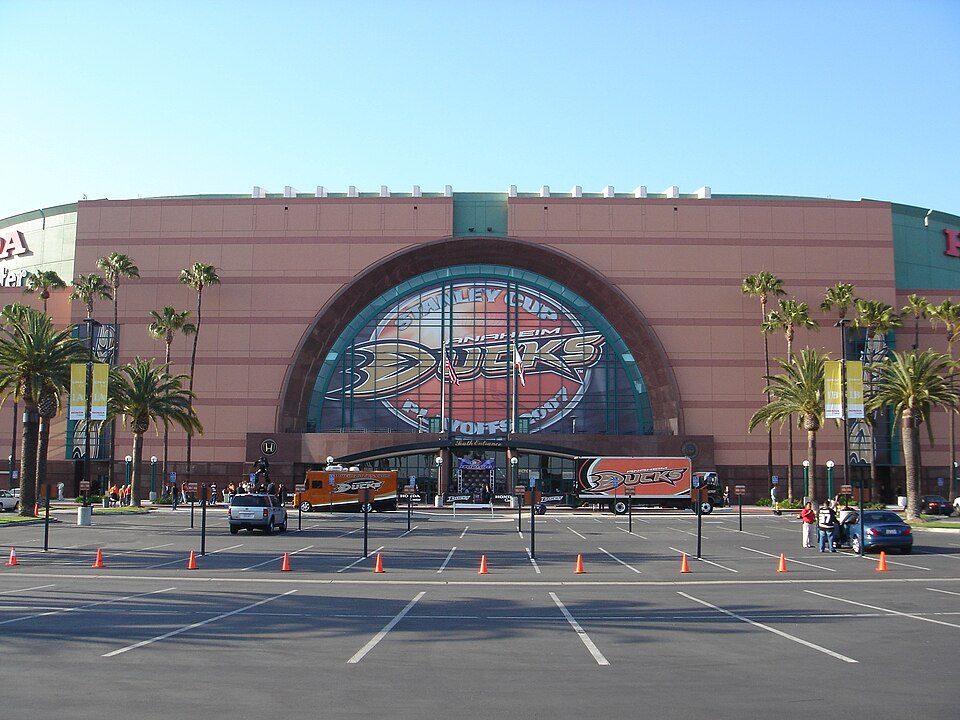
Disneyland: HarshLight from San Jose, CA, USA, CC BY 2.0 · Knott's Berry Farm: Phydend at English Wikipedia, Public domain · Angel Stadium of Anaheim: Staff Sgt. Chad McMeen, Public domain · Disney California Adventure: CrispyCream27, CC BY-SA 4.0 · Oldest McDonald's restaurant: Northwalker, CC0 · Honda Center: Arnold C (Buchanan-Hermit), Attribution

Getting set up

Moving to Jurupa Valley: who provides what

Who provides power, water and the rest in Jurupa Valley, and how to reach them.

The full setup list →
PowerSouthern California Edison31.5¢/kWh · EIA 2025HIFLD · EIA
WaterJurupa Community Sd water systemNo health-based violations in 5 years · EPAEPA
Internet6 providers99% of addresses get 100/20 MbpsFCC
Trash & dumpBurrtec WasteTrash haulerTown site
SchoolsJurupa Unified School DistrictWhich school depends on your addressNCES
Register to voteOnlineIn California you can register online until 15 days before Election Day, in person up to and including Election Day, or by mail (postmarked 15 days before).vote.gov
Who runs elections hereRiverside Registrar of VotersRiverside County; contacts on the Handbook page.FVAP, Sep 2025
ZIP codes92509, 9175292509 74% · 91752 26%Census 2020

EPA SDWIS (Oct 9, 2026) · HIFLD + EIA-861 2025 · Census 2020 ZCTAs · NCES 2024–25 · registration: vote.gov, updated Nov 18, 2024.


The data

Ordered by what stands out in Jurupa Valley.

Jurupa Valley fares better on crime within California than nationally and has more 90° days than nearly all U.S. towns, but it trails even towns with similar incomes on health.

OutdoorsA−

9% of Jurupa Valley is conserved land

Jurupa Valley sits above both the California town median (4.2%) and the median of U.S. towns (4.3%) on this measure. The biggest place to walk is Santa Ana River Wildlife Area, 1,367 acres with 19.3 miles of trail.

#146for trails in CA
9%
conserved · 2,513 of 27,820 acres
93 mi
of trails · 2.1 per sq mi
Biggest places to walkTrailsAcres
1. Santa Ana River Wildlife Area19.3 mi1,367
2. Rancho Jurupa Regional Park2.4 mi202
3. Louis Robidoux Parkland & Pecan Grove1.5 mi67

Trails & parks © OpenStreetMap contributors · Conserved land: USGS PAD-US

SchoolsC+

Public schools in Jurupa Valley fall behind 63% of California districts

Its public schools are run by the Jurupa Unified school district. Two of its 26 schools are below, each with why it’s listed.

37%of CA districts it outscoresC+School Grade
SchoolLevelStudentsLetter
Del Sol AcademyLargest public elementary schoolGrades K–8Grades K–81,213–
Patriot HighLargest public high schoolGrades 9–12Grades 9–122,399C−

NCES · EDFacts · graded within CA on state tests and graduation

Natural hazardsHazard risk grade D−

Jurupa Valley faces a very high natural-hazard risk, led by inland flooding

One flood insurance claim has been paid in Jurupa Valley since 2021.

98risk score of 100
FEMA risk score
98Very high riskLowerHigher
Inland floodingEarthquakes
1
paid flood claims since 2021

FEMA flood insurance claims · FEMA National Risk Index · OpenFEMA

SafetyC

Jurupa Valley earns a C for safety

At 31.9 crimes per 1,000 residents a year, it reports more crime than 56% of California’s graded towns. Reported crimes fell from 3,186 to 2,192 over the last three FBI years, a drop beyond ordinary year-to-year swings.

The property crime rate in Jurupa Valley is 18.8 per 1,000 residents. Jurupa Valley reports more crime per resident than most U.S. towns we grade: about 75% report less. The violent crime rate in Jurupa Valley is 1.4 per 1,000 residents.

25%of U.S. towns report more crimeCSafety Grade
Jurupa ValleyCalifornia townsU.S. towns
Property crimes per 1,000 (2025)18.8 per 1,000 residents13.39.9
Violent crimes per 1,000 (2025)1.4 per 1,000 residents2.91.6

Violent crime per 1,000 residents

Jurupa Valley1.4
California4.4
U.S.3.3

Property crime per 1,000 residents

Jurupa Valley18.8
California18.2
U.S.15.5
25th
percentile among U.S. towns we grade
44th
percentile among CA towns
150
violent crimes reported in 2025
2,042
property crimes reported in 2025

FBI crime data, 2025 · crimes reported to police

Work & commuteJobs & income grade B+

Jurupa Valley has 0.7 jobs for every working resident, so most commute out

Jobs based here grew from 23,421 in 2013 to 34,633.

Most working residents leave Jurupa Valley for work: only 9% work in town. Jurupa Valley’s average trip to work is 32 minutes. Since 2013, Jurupa Valley has added 11,212 jobs, to 34,633 in 2023.

9%work in town
Jurupa ValleyCalifornia townsU.S. towns
Average trip to work32 minutes28 minutes25 minutes
Work from home7.4%14%11%
Median household income$98,000$95,000$80,000
Below the poverty line11%10%9.6%

Where working residents work

In Jurupa Valley9%
Riverside9%
Ontario6%
Los Angeles5%
Corona4%
15 mi
median commute distance
34,633
jobs based in Jurupa Valley
A commuter town
jobs vs. working residents
B+
Walkability grade: more walkable than 66% of U.S. towns

Census LEHD 2023 · ACS

HealthC

On CDC estimates, Jurupa Valley is less healthy than 72% of U.S. towns

Against the 8,930 U.S. towns with household incomes like Jurupa Valley’s, it is less healthy than 91%, so it trails even them.

Jurupa Valley beats the California average on 1 of 32 CDC measures and trails it on 14. 18% of Jurupa Valley adults 18 to 64 have no health insurance.

28%healthier than U.S. townsCHealth Grade
Jurupa ValleyCalifornia townsU.S. towns
No health insurance, 18–64 (CDC PLACES)18%9%8.1%
Yearly checkup (CDC PLACES)69%72%79%
Food insecurity (CDC PLACES)26%16%14%
Fair or poor health (CDC PLACES)28%22%19%
32 measures vs. California
1 better17 too close to call14 worse
What stands outJurupa ValleyCA
Fewer adults who have had cancer5%6.4%
More uninsured adults17.7%10.6%
Kaiser Foundation Hospital Fontana/Ontario
5.2 mi away · emergency room
1 of 3
care shortages: mental health
22nd
percentile among CA towns

CDC PLACES 2025 · modeled estimates for adults · CMS · HRSA

Climate

In Jurupa Valley, expect mild winters and hot summers

The Riverside Fire Stn 3 weather station, 6 miles away, records that about 110 days a year reach 90°, more than in 95% of U.S. towns. January nights average 42.9°, milder than in 96% of U.S. towns; July afternoons average 93.7°.

Jurupa Valley has warm winters and hot summers, with very little rain. Snow is almost unheard of.

95°summer high
Jurupa ValleyCalifornia townsU.S. towns
July high94°F89°F85°F
January low43°F40°F22°F

Typical low → high °F

Winter43–68°
Spring50–76°
Summer61–92°
Fall54–83°
+2.3°
vs. the 20th-century average
95°
typical summer high

NOAA U.S. Climate Normals, 1991–2020

HousingCost of living grade D

Homes in Jurupa Valley are worth about $670K, by Zillow’s estimate

The typical Jurupa Valley home is worth about $670,000, up 2.1% in a year, 12% below the California typical home. 59% of renter households spend 30% or more of their income on rent in Jurupa Valley.

$670KZillow home value
Jurupa ValleyCalifornia townsU.S. towns
Median rent$1,741 a month$1,898 a month$1,185 a month
Renters paying 30%+ of income on rent59%55%48%
Households that own their home70%64%73%

Typical home value

Jurupa Valley$670K
California$762K
Market temperature
BalancedA seller's marketBuyer’sSeller’s
51
days on market
100.2%
sale-to-list price
+2.1%
value change, 1 year
46
homes sold in May

Census ACS, 2020–24 · Zillow Home Value Index · Redfin Data Center

Keep exploring

Everything we know about Jurupa Valley

19pages on Jurupa Valley
After high school

Colleges nearby

18 within 15 miles of the center of Jurupa Valley

About Jurupa Valley

City in California, United States

Official town website ↗

Jurupa Valley ( huh-ROO-puh; Spanish: [xu'rupa]; Serrano: Hurumpa) is a city in the Inland Empire region of northwestern Riverside County, California, United States. It was the location of one of the earliest non-native settlements in the county, Rancho Jurupa. The rancho was initially an outpost of the Mission San Gabriel Arcángel, then a Mexican land grant in 1838. Its name is derived from a Native American village that existed in the area prior to the arrival of Europeans. On March 8, 2011, voters approved a ballot measure A to incorporate and form the city of Jurupa Valley. The effective date of incorporation was July 1, 2011. Residents of the area had previously voted on incorporation …

From Wikipedia, licensed CC BY-SA 4.0 · facts via Wikidata (CC0)

Established
2011
Area
44 sq mi
Elevation
1,565 ft
ZIP code
92509
Area code
951

Jurupa Valley’s neighbors

5 towns share a border with Jurupa Valley.

Explore the map →

All 5 graded towns on its borders grade higher than its D; Bloomington (D) is closest.

How the neighbors grade
TownCA rankOverallCostSafetySchoolsHealth
Jurupa Valley#653DDCC+C
Norco#374CD−CB+B−
Riverside#568DDDBC+
Eastvale#183B−D−B−B+A
Fontana#468C−D−C+B−B−
Bloomington#628DC−—CC

Bloomington reports no FBI crime data of its own. Compare Jurupa Valley with a neighbor →

Questions about Jurupa Valley

Short answers, built from the data on this page.

Is Jurupa Valley, CA a good place to live?

Jurupa Valley grades D overall, better than 7% of U.S. towns and #653 of 841 in California. It grades C for health, C for safety and C+ for schools. Hazard risk is its weak spot, with a D−.

Is Jurupa Valley, CA expensive?

Yes. That is 7.5 years of the area's median household income ($89,662 across the Riverside-San Bernardino-Ontario, CA metro area).