Guest, Sign inJoin
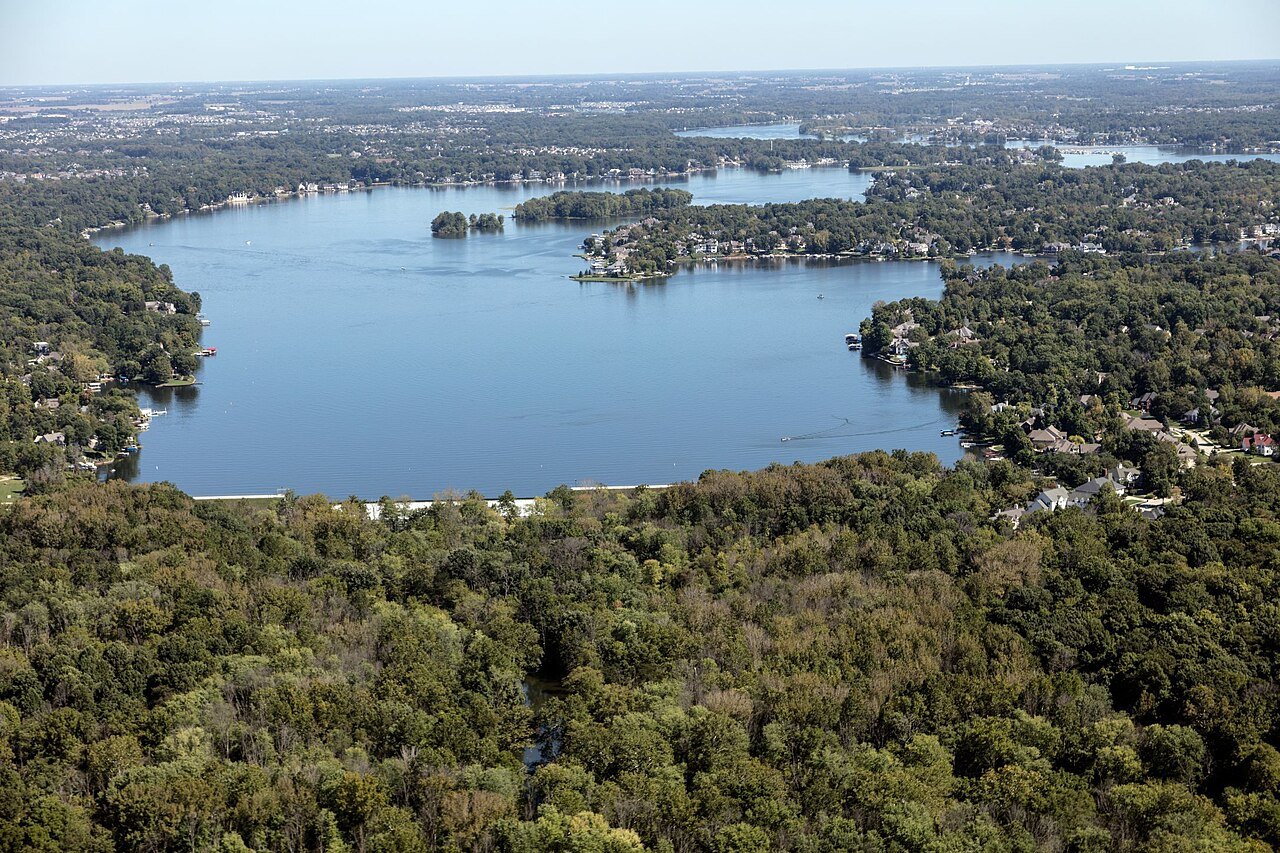
Aerial view of Geist Reservoir and surrounding housing developments in Indianapolis suburb of Fishers, IndianaFishers, IN, #1 on this list · Photo: Carol M. Highsmith · Public domain
United States · 2026

Best big cities to live in

Fishers, Indiana, ranks first of the 393 U.S. cities of 100,000+ residents with an overall grade, with an A+. 36 of the 393 grade A− or better.

The overall grade, among cities of 100,000+ only, so a suburb of 10,000 isn’t weighed against Chicago. The letter is the same national grade every town gets. How grades work

#1

Fishers, IN

Hamilton County · 104,812 people
A+

#23 of 585 in Indiana

Strongest: schools A+, jobs & income A+·lowest: cost of living C−
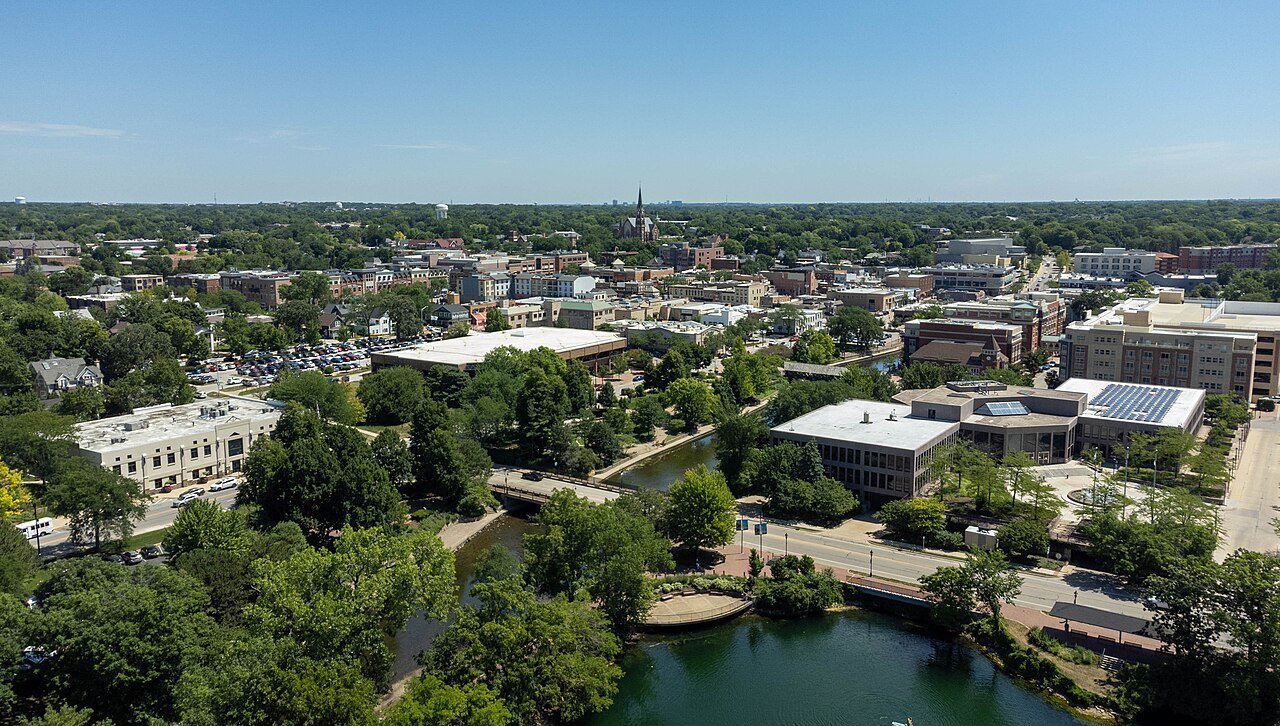
#2

Naperville, IL

DuPage County · 153,114 people
A+

#46 of 767 in Illinois

Strongest: health A+, schools A·lowest: cost of living D
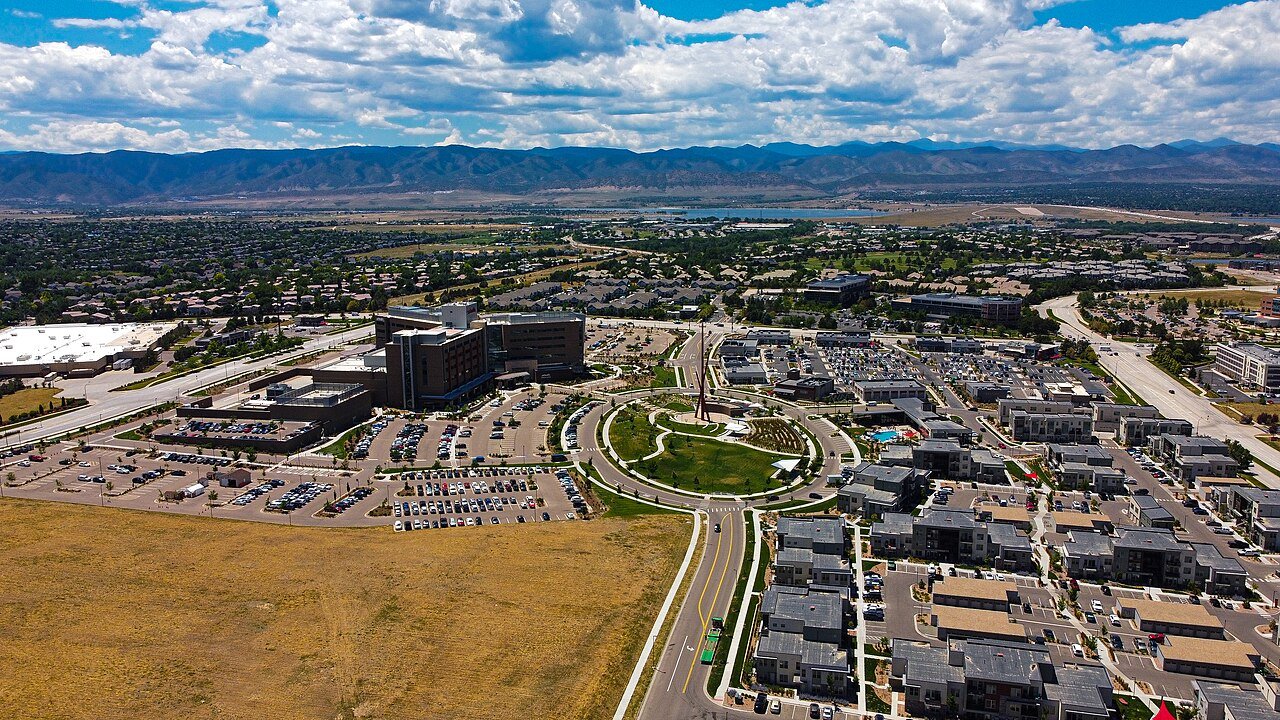
#3

Highlands Ranch, CO

unincorporated, Douglas County · 102,257 people
A+

#3 of 158 in Colorado

Strongest: health A+, jobs & income A·lowest: cost of living C−

All 393 cities

Overall score, highest first, with each city’s rank in its own state. The score (0–100) blends the seven livability grades and sets the order; the letter places that score among every U.S. town of 2,500+, and A+ is the top 5%, so neighbors on the list often share a letter.

393 cities.

#CityScoreGrade · state rankWhat drives it
1Fishers, INHamilton County · 104,812 people72.3top 3.7%A+#23 of 585 in INStrongest: schools A+, jobs & income A+·lowest: cost of living C−
2Naperville, ILDuPage County · 153,114 people72.1top 3.9%A+#46 of 767 in ILStrongest: health A+, schools A·lowest: cost of living D
3Highlands Ranch, COunincorporated, Douglas County · 102,257 people72.1top 3.9%A+#3 of 158 in COStrongest: health A+, jobs & income A·lowest: cost of living C−
4Carmel, INHamilton County · 105,634 people71.7top 4.3%A+#28 of 585 in INStrongest: schools A+, jobs & income A+·lowest: cost of living C−
5North Hempstead, NYNassau County · 238,982 people71.6top 4.4%A+#44 of 745 in NYStrongest: walkability A+, health A+·lowest: cost of living D−
6Clay Township, INHamilton County · 104,932 people70.8top 5.5%A#35 of 585 in INStrongest: schools A+, jobs & income A+·lowest: cost of living C−
7Lisle Township, ILDuPage County · 119,740 people70.6top 5.9%A#71 of 767 in ILStrongest: health A+, walkability A·lowest: cost of living D
8Huntington, NYSuffolk County · 205,891 people70.3top 6.2%A#61 of 745 in NYStrongest: hazard risk A+, health A+·lowest: cost of living D−
9Downers Grove Township, ILDuPage County · 149,599 people70.0top 6.7%A#82 of 767 in ILStrongest: health A, walkability A·lowest: cost of living D
10Columbia, MDunincorporated, Howard County · 104,338 people70.0top 6.8%A#36 of 259 in MDStrongest: hazard risk A+, health A·lowest: cost of living D
11Meridian, IDAda County · 142,988 people69.9top 7.0%A#1 of 58 in IDStrongest: hazard risk A, health A·lowest: cost of living C−
12Schaumburg Township, ILCook County · 131,411 people69.6top 7.4%A#91 of 767 in ILStrongest: health A, schools A·lowest: cost of living D
13Arlington, VAArlington County (county government) · 236,254 people69.5top 7.5%A#43 of 249 in VAStrongest: walkability A+, health A+·lowest: cost of living D
14Smithtown, NYSuffolk County · 116,847 people69.0top 8.5%A#76 of 745 in NYStrongest: hazard risk A+, health A·lowest: cost of living D−
15Naperville Township, ILDuPage County · 107,908 people68.6top 9.1%A#115 of 767 in ILStrongest: health A+, walkability A·lowest: cost of living D
16Milton Township, ILDuPage County · 119,815 people68.5top 9.4%A#121 of 767 in ILStrongest: health A+, walkability A+·lowest: cost of living D
17Hempstead, NYNassau County · 795,734 people66.4top 13.5%A#118 of 745 in NYStrongest: walkability A+, health A·lowest: cost of living D−
18Cary, NCWake County · 183,582 people66.2top 14.1%A#11 of 286 in NCStrongest: health A+, jobs & income A·lowest: cost of living C−
19Gilbert, AZMaricopa County · 287,285 people65.9top 14.7%A#4 of 139 in AZStrongest: health A+, jobs & income A·lowest: cost of living C−
20Maine Township, ILCook County · 136,611 people65.6top 15.5%A−#176 of 767 in ILStrongest: walkability A+, health A·lowest: cost of living D
21Olathe, KSJohnson County · 150,025 people65.3top 16.0%A−#18 of 150 in KSStrongest: jobs & income A, health A·lowest: cost of living C
22Longmont, COBoulder County · 100,109 people65.1top 16.6%A−#31 of 158 in COStrongest: health A, walkability A·lowest: cost of living C−
23Wheeling Township, ILCook County · 154,050 people64.8top 17.3%A−#199 of 767 in ILStrongest: health A, walkability A·lowest: cost of living D
24Palatine Township, ILCook County · 111,179 people64.6top 17.6%A−#203 of 767 in ILStrongest: health A+, jobs & income A−·lowest: cost of living D
25Centennial, COArapahoe County · 108,658 people64.5top 18.0%A−#36 of 158 in COStrongest: health A+, jobs & income A·lowest: cost of living C−
26Lyons Township, ILCook County · 112,345 people64.3top 18.4%A−#219 of 767 in ILStrongest: walkability A+, health A·lowest: cost of living C−
27Allen, TXCollin County · 113,447 people64.2top 18.6%A−#29 of 640 in TXStrongest: schools A, jobs & income A·lowest: cost of living D−
28York Township, ILDuPage County · 128,137 people64.2top 18.6%A−#220 of 767 in ILStrongest: walkability A, health A·lowest: cost of living D
29Frisco, TXCollin County · 236,955 people64.0top 19.1%A−#31 of 640 in TXStrongest: health A+, jobs & income A·lowest: cost of living D−
30Chandler, AZMaricopa County · 278,748 people63.0top 21.5%A−#9 of 139 in AZStrongest: health A, jobs & income A−·lowest: cost of living C−
31Islip, NYSuffolk County · 340,867 people62.8top 21.9%A−#178 of 745 in NYStrongest: hazard risk A, jobs & income A·lowest: cost of living D−
32Sandy Springs, GAFulton County · 105,013 people62.3top 23.3%A−#23 of 258 in GAStrongest: health A+, walkability A·lowest: cost of living D−
33Bloomingdale Township, ILDuPage County · 111,039 people62.2top 23.4%A−#265 of 767 in ILStrongest: health A−, hazard risk A−·lowest: cost of living D
34Overland Park, KSJohnson County · 203,677 people62.1top 23.6%A−#34 of 150 in KSStrongest: health A+, schools A·lowest: cost of living C−
35McKinney, TXCollin County · 236,001 people61.9top 24.4%A−#52 of 640 in TXStrongest: jobs & income A, health A·lowest: cost of living D−
36The Woodlands, TXunincorporated, Harris County · 121,002 people61.9top 24.4%A−#54 of 640 in TXStrongest: health A, jobs & income A·lowest: cost of living D
37Niles Township, ILCook County · 109,978 people61.4top 25.7%B+#290 of 767 in ILStrongest: walkability A+, health A·lowest: cost of living D
38Ann Arbor, MIWashtenaw County · 122,233 people61.3top 26.1%B+#203 of 697 in MIStrongest: walkability A+, schools A·lowest: cost of living D−
39Edmond, OKOklahoma County · 100,479 people60.9top 27.1%B+#7 of 131 in OKStrongest: schools A, health A·lowest: cost of living C−
40Irvine, CAOrange County · 318,764 people60.5top 28.1%B+#74 of 841 in CAStrongest: health A+, walkability A·lowest: cost of living D−
41Bend, ORDeschutes County · 107,342 people60.3top 28.8%B+#21 of 142 in ORStrongest: walkability A, health A·lowest: cost of living D
42Provo, UTUtah County · 114,527 people60.0top 29.5%B+#71 of 118 in UTStrongest: walkability A+, health A−·lowest: hazard risk C−
43Virginia Beach, VAVirginia Beach city · 453,737 people59.9top 29.7%B+#130 of 249 in VAStrongest: hazard risk A+, schools A·lowest: cost of living D
44Fort Collins, COLarimer County · 171,500 people59.8top 29.9%B+#59 of 158 in COStrongest: walkability A+, schools A·lowest: cost of living D
45Sunnyvale, CASanta Clara County · 156,577 people59.7top 30.2%B+#82 of 841 in CAStrongest: health A+, walkability A+·lowest: cost of living D
46League City, TXGalveston County · 119,905 people59.0top 32.1%B+#84 of 640 in TXStrongest: jobs & income A, health A·lowest: cost of living D
47Carlsbad, CASan Diego County · 112,260 people59.0top 32.1%B+#94 of 841 in CAStrongest: health A+, schools A·lowest: cost of living D−
48Edison Township, NJMiddlesex County · 109,077 people58.9top 32.3%B+#210 of 466 in NJStrongest: walkability A+, health A·lowest: cost of living D
49Plano, TXCollin County · 293,028 people58.8top 32.6%B+#91 of 640 in TXStrongest: health A, jobs & income A·lowest: cost of living D
50Bellevue, WAKing County · 154,193 people58.6top 32.9%B+#63 of 285 in WAStrongest: health A+, walkability A+·lowest: cost of living D−
51Amherst, NYErie County · 130,442 people58.6top 33.0%B+#270 of 745 in NYStrongest: health A, walkability A−·lowest: cost of living D
52Thousand Oaks, CAVentura County · 122,230 people58.5top 33.2%B+#102 of 841 in CAStrongest: health A, schools A·lowest: cost of living D−
53Boise City, IDAda County · 238,429 people58.5top 33.2%B+#20 of 58 in IDStrongest: walkability A, health A·lowest: cost of living C−
54Fremont, CAAlameda County · 226,442 people58.4top 33.4%B+#105 of 841 in CAStrongest: health A+, walkability A+·lowest: cost of living D−
55Arvada, COJefferson County · 122,901 people58.2top 34.0%B+#64 of 158 in COStrongest: health A, jobs & income A·lowest: safety C−
56Surprise, AZMaricopa County · 175,304 people58.0top 34.6%B+#18 of 139 in AZStrongest: health A−, schools B+·lowest: cost of living C
57Perry Township, INMarion County · 123,439 people58.0top 34.8%B+#257 of 585 in INStrongest: walkability B+, jobs & income B·lowest: hazard risk B−
58Rio Rancho, NMSandoval County · 114,419 people57.9top 35.1%B#3 of 72 in NMStrongest: hazard risk A, schools A·lowest: cost of living C
59Sugar Land, TXFort Bend County · 107,726 people57.6top 35.7%B#102 of 640 in TXStrongest: jobs & income A, health A·lowest: cost of living D
60Lee's Summit, MOJackson County · 107,514 people57.6top 35.8%B#81 of 247 in MOStrongest: schools A, jobs & income A·lowest: cost of living C−
61Scottsdale, AZMaricopa County · 243,006 people57.2top 36.7%B#24 of 139 in AZStrongest: health A+, jobs & income A·lowest: cost of living D
62Costa Mesa, CAOrange County · 108,881 people57.2top 36.8%B#125 of 841 in CAStrongest: walkability A, schools A−·lowest: cost of living D−
63Peoria, AZMaricopa County · 200,881 people57.2top 36.8%B#25 of 139 in AZStrongest: health A, schools A−·lowest: hazard risk C−
64Carrollton, TXDenton County · 134,562 people57.1top 36.9%B#110 of 640 in TXStrongest: jobs & income A, health A−·lowest: cost of living D
65Brookhaven, NYSuffolk County · 496,410 people57.0top 37.2%B#295 of 745 in NYStrongest: health A−, hazard risk A−·lowest: cost of living D−
66Boulder, COBoulder County · 105,689 people56.7top 38.2%B#73 of 158 in COStrongest: walkability A+, schools A·lowest: cost of living D−
67Pearland, TXBrazoria County · 129,930 people56.5top 38.6%B#116 of 640 in TXStrongest: jobs & income A+, health A−·lowest: cost of living D
68Roseville, CAPlacer County · 167,302 people56.5top 38.7%B#131 of 841 in CAStrongest: health A, schools A·lowest: cost of living D−
69Rochester, MNOlmsted County · 124,292 people56.4top 38.8%B#188 of 271 in MNStrongest: health A−, walkability A−·lowest: hazard risk C−
70West Jordan, UTSalt Lake County · 116,812 people56.4top 38.9%B#87 of 118 in UTStrongest: jobs & income A, health A−·lowest: cost of living C
71Round Rock, TXWilliamson County · 141,282 people56.4top 39.0%B#120 of 640 in TXStrongest: schools A−, jobs & income A−·lowest: cost of living D
72Westminster, COAdams County · 116,182 people56.3top 39.1%B#76 of 158 in COStrongest: health A, jobs & income A−·lowest: safety D
73Concord, NCCabarrus County · 114,598 people56.2top 39.6%B#59 of 286 in NCStrongest: health B+, schools B+·lowest: cost of living C−
74San Mateo, CASan Mateo County · 103,337 people56.0top 40.1%B#141 of 841 in CAStrongest: walkability A+, health A·lowest: cost of living D−
75Rancho Cucamonga, CASan Bernardino County · 177,856 people55.5top 41.2%B#147 of 841 in CAStrongest: schools A, health A−·lowest: cost of living D−
76Santa Clara, CASanta Clara County · 133,446 people55.5top 41.3%B#148 of 841 in CAStrongest: health A+, walkability A+·lowest: hazard risk D−
77College Station, TXBrazos County · 127,472 people55.3top 41.7%B#136 of 640 in TXStrongest: hazard risk A, walkability A−·lowest: cost of living D−
78Aurora, ILKane County · 181,505 people55.2top 42.1%B#422 of 767 in ILStrongest: walkability A, schools B+·lowest: cost of living C−
79Santa Clarita, CALos Angeles County · 228,430 people55.1top 42.3%B#152 of 841 in CAStrongest: schools A, health A−·lowest: cost of living D−
80Elk Grove, CASacramento County · 185,007 people54.9top 42.9%B#154 of 841 in CAStrongest: health A−, walkability B+·lowest: cost of living D−
81Washington, DCDistrict of Columbia · 693,645 people54.7top 43.4%B#1 of 1 in DCStrongest: walkability A+, hazard risk A+·lowest: safety D−
82Simi Valley, CAVentura County · 124,861 people54.2top 44.9%B#164 of 841 in CAStrongest: health A−, jobs & income B+·lowest: cost of living D−
83Huntington Beach, CAOrange County · 191,451 people54.0top 45.4%B−#167 of 841 in CAStrongest: walkability A, schools A·lowest: cost of living D−
84Fayetteville, ARWashington County · 106,623 people53.9top 45.7%B−#26 of 123 in ARStrongest: walkability A, schools A·lowest: safety D
85Richardson, TXDallas County · 118,542 people53.8top 45.8%B−#157 of 640 in TXStrongest: walkability A, health A·lowest: cost of living D
86Raleigh, NCWake County · 506,306 people53.7top 46.1%B−#80 of 286 in NCStrongest: walkability A, health A·lowest: safety D
87St. George, UTWashington County · 108,713 people53.6top 46.5%B−#91 of 118 in UTStrongest: health A−, walkability B+·lowest: hazard risk D
88Cambridge, MAMiddlesex County · 122,588 people53.3top 47.3%B−#190 of 282 in MAStrongest: walkability A+, health A+·lowest: cost of living D−
89Berkeley, CAAlameda County · 121,911 people53.3top 47.4%B−#182 of 841 in CAStrongest: walkability A+, jobs & income A·lowest: safety D−
90New Braunfels, TXComal County · 122,492 people53.3top 47.5%B−#169 of 640 in TXStrongest: schools A−, health B+·lowest: cost of living D
91Woodbridge Township, NJMiddlesex County · 104,802 people53.2top 47.7%B−#277 of 466 in NJStrongest: walkability A+, jobs & income A−·lowest: cost of living D−
92Goodyear, AZMaricopa County · 125,359 people53.1top 48.0%B−#38 of 139 in AZStrongest: health A, jobs & income A−·lowest: cost of living C−
93Miramar, FLBroward County · 142,570 people53.0top 48.3%B−#155 of 634 in FLStrongest: walkability A−, jobs & income B+·lowest: cost of living D−
94Charleston, SCCharleston County · 159,423 people53.0top 48.3%B−#57 of 167 in SCStrongest: health A, walkability A·lowest: hazard risk D−
95Lakewood, COJefferson County · 156,927 people52.9top 48.5%B−#97 of 158 in COStrongest: health A, walkability A·lowest: safety D−
96Boca Raton, FLPalm Beach County · 101,582 people52.7top 49.0%B−#159 of 634 in FLStrongest: health A, walkability A·lowest: cost of living D−
97Seattle, WAKing County · 784,777 people52.4top 50.0%B−#128 of 285 in WAStrongest: walkability A+, health A+·lowest: safety D−
98Coral Springs, FLBroward County · 138,783 people52.3bottom 49.9%B−#165 of 634 in FLStrongest: walkability A−, health A−·lowest: cost of living D−
99Thornton, COAdams County · 147,766 people52.3bottom 49.8%B−#102 of 158 in COStrongest: walkability A−, jobs & income A−·lowest: safety C−
100Broken Arrow, OKTulsa County · 124,991 people52.2bottom 49.6%B−#31 of 131 in OKStrongest: jobs & income B+, health B+·lowest: cost of living C
101Mesa, AZMaricopa County · 513,656 people52.2bottom 49.6%B−#50 of 139 in AZStrongest: walkability A−, health A−·lowest: safety C−
102Murrieta, CARiverside County · 114,124 people52.2bottom 49.5%B−#202 of 841 in CAStrongest: schools A−, health B+·lowest: cost of living D−
103Lewisville, TXDenton County · 139,006 people51.7bottom 48.1%B−#194 of 640 in TXStrongest: jobs & income A−, schools A−·lowest: cost of living D
104Torrance, CALos Angeles County · 138,391 people51.6bottom 47.9%B−#220 of 841 in CAStrongest: health A, schools A·lowest: cost of living D−
105Tempe, AZMaricopa County · 190,571 people51.5bottom 47.7%B−#53 of 139 in AZStrongest: walkability A+, health A·lowest: safety D
106Washington Township, INMarion County · 140,572 people51.5bottom 47.7%B−#385 of 585 in INStrongest: walkability A−, health A−·lowest: schools C−
107Nampa, IDCanyon County · 120,384 people51.1bottom 46.6%B−#35 of 58 in IDStrongest: hazard risk A+, walkability B+·lowest: schools C
108Huntsville, ALMadison County · 233,627 people51.0bottom 46.4%B−#61 of 187 in ALStrongest: cost of living B, walkability B·lowest: safety C
109Orange, CAOrange County · 138,365 people50.9bottom 46.0%B−#235 of 841 in CAStrongest: walkability A, jobs & income A−·lowest: cost of living D−
110Quincy, MANorfolk County · 103,173 people50.9bottom 46.0%B−#211 of 282 in MAStrongest: walkability A+, health A·lowest: cost of living D
111Clovis, CAFresno County · 129,347 people50.4bottom 44.6%C+#242 of 841 in CAStrongest: schools A−, health B+·lowest: cost of living D−
112Temecula, CARiverside County · 114,865 people50.3bottom 44.5%C+#243 of 841 in CAStrongest: schools A−, health A−·lowest: cost of living D−
113Clinton Township, MIMacomb County · 101,374 people50.3bottom 44.5%C+#440 of 697 in MIStrongest: schools A−, walkability B+·lowest: safety C
114San Diego, CASan Diego County · 1,406,106 people50.2bottom 44.1%C+#249 of 841 in CAStrongest: walkability A, health A·lowest: cost of living D−
115Sioux Falls, SDMinnehaha County · 213,748 people50.2bottom 44.1%C+#27 of 35 in SDStrongest: walkability A−, health B+·lowest: safety D
116Buckeye, AZMaricopa County · 125,445 people50.2bottom 44.1%C+#61 of 139 in AZStrongest: health B+, jobs & income B·lowest: cost of living C
117Proviso Township, ILCook County · 147,144 people50.2bottom 44.0%C+#512 of 767 in ILStrongest: walkability A+, health B+·lowest: hazard risk C−
118Lawrence Township, INMarion County · 124,509 people50.1bottom 43.9%C+#413 of 585 in INStrongest: hazard risk B+, walkability B·lowest: schools C
119Sterling Heights, MIMacomb County · 133,931 people50.1bottom 43.8%C+#447 of 697 in MIStrongest: schools A−, jobs & income B·lowest: cost of living C−
120Daly City, CASan Mateo County · 101,261 people50.0bottom 43.5%C+#254 of 841 in CAStrongest: walkability A+, health A−·lowest: cost of living D−
121Toms River Township, NJOcean County · 100,899 people49.9bottom 43.3%C+#317 of 466 in NJStrongest: jobs & income A−, health A−·lowest: cost of living D
122Downey, CALos Angeles County · 108,468 people49.9bottom 43.2%C+#257 of 841 in CAStrongest: walkability A, jobs & income B+·lowest: cost of living D−
123Madison, WIDane County · 286,233 people49.5bottom 42.3%C+#289 of 357 in WIStrongest: walkability A+, hazard risk A·lowest: cost of living D
124South Fulton, GAFulton County · 112,820 people49.4bottom 42.0%C+#94 of 258 in GAStrongest: schools A−, hazard risk A−·lowest: safety D
125Urban Honolulu, HIHonolulu County (city and county) · 345,482 people49.3bottom 41.6%C+#1 of 1 in HIStrongest: walkability A+, health A−·lowest: hazard risk D
126Elgin, ILKane County · 115,476 people49.2bottom 41.4%C+#526 of 767 in ILStrongest: walkability A, jobs & income B·lowest: cost of living C
127Hillsboro, ORWashington County · 111,126 people49.1bottom 41.2%C+#56 of 142 in ORStrongest: walkability A+, health A−·lowest: cost of living D
128Murfreesboro, TNRutherford County · 171,178 people49.1bottom 41.0%C+#67 of 175 in TNStrongest: schools A, jobs & income B+·lowest: safety C−
129San Tan Valley, AZunincorporated, Pinal County · 109,189 people48.9bottom 40.5%C+#63 of 139 in AZStrongest: health B+, jobs & income B·lowest: cost of living C
130Fargo, NDCass County · 136,275 people48.8bottom 40.3%C+#18 of 23 in NDStrongest: walkability A, health A·lowest: safety D
131Worth Township, ILCook County · 148,514 people48.7bottom 40.1%C+#531 of 767 in ILStrongest: walkability A, health B+·lowest: hazard risk D
132Everett, WASnohomish County · 113,567 people48.6bottom 39.8%C+#156 of 285 in WAStrongest: walkability A+, schools A−·lowest: safety D
133Chula Vista, CASan Diego County · 275,533 people48.6bottom 39.7%C+#282 of 841 in CAStrongest: walkability A, health B+·lowest: cost of living D−
134Bremen Township, ILCook County · 104,303 people48.6bottom 39.7%C+#534 of 767 in ILStrongest: walkability A, health B·lowest: hazard risk C
135Phoenix, AZMaricopa County · 1,665,481 people48.6bottom 39.6%C+#65 of 139 in AZStrongest: walkability A, schools B+·lowest: safety D
136Georgetown, TXWilliamson County · 106,907 people48.5bottom 39.3%C+#249 of 640 in TXStrongest: health A−, jobs & income B+·lowest: cost of living D
137Davie, FLBroward County · 110,851 people48.4bottom 39.2%C+#256 of 634 in FLStrongest: walkability A−, health B+·lowest: cost of living D−
138Alexandria, VAAlexandria city · 160,662 people48.4bottom 39.0%C+#190 of 249 in VAStrongest: walkability A+, health A·lowest: cost of living D
139Aurora Township, ILKane County · 127,446 people48.2bottom 38.6%C+#541 of 767 in ILStrongest: walkability A−, hazard risk B·lowest: schools C
140San Jose, CASanta Clara County · 989,814 people48.2bottom 38.5%C+#293 of 841 in CAStrongest: walkability A, jobs & income A−·lowest: hazard risk D−
141Conroe, TXMontgomery County · 119,564 people48.0bottom 38.0%C+#261 of 640 in TXStrongest: schools A−, hazard risk B+·lowest: cost of living D
142Pembroke Pines, FLBroward County · 176,714 people48.0bottom 37.9%C+#272 of 634 in FLStrongest: jobs & income B+, health B+·lowest: cost of living D−
143San Francisco, CASan Francisco County · 826,079 people47.8bottom 37.4%C+#308 of 841 in CAStrongest: walkability A+, health A·lowest: cost of living D−
144Portland, ORMultnomah County · 635,109 people47.7bottom 37.2%C+#61 of 142 in ORStrongest: walkability A+, schools A·lowest: safety D−
145Anchorage, AKAnchorage Municipality · 287,155 people47.5bottom 36.6%C+#26 of 41 in AKStrongest: walkability A, health B+·lowest: safety D−
146Denver, CODenver County · 740,613 people47.3bottom 36.2%C+#119 of 158 in COStrongest: walkability A+, health A·lowest: safety D−
147Stamford, CTFairfield County · 139,535 people47.3bottom 36.0%C+#119 of 151 in CTStrongest: walkability A+, health A·lowest: cost of living D−
148Glendale, CALos Angeles County · 187,160 people47.2bottom 36.0%C+#316 of 841 in CAStrongest: walkability A, schools A−·lowest: cost of living D−
149Fullerton, CAOrange County · 138,675 people47.2bottom 35.9%C+#317 of 841 in CAStrongest: walkability A, schools A−·lowest: cost of living D−
150Norman, OKCleveland County · 130,943 people47.2bottom 35.9%C+#48 of 131 in OKStrongest: walkability A, schools B·lowest: safety C
151Ramapo, NYRockland County · 161,564 people47.2bottom 35.8%C+#503 of 745 in NYStrongest: walkability A, hazard risk A−·lowest: cost of living D−
152Columbia, MOBoone County · 130,851 people47.1bottom 35.6%C+#142 of 247 in MOStrongest: walkability A, health B+·lowest: safety C−
153Chesapeake, VAChesapeake city · 255,332 people46.5bottom 34.2%C#200 of 249 in VAStrongest: jobs & income B+, walkability B+·lowest: cost of living C−
154Lincoln, NELancaster County · 301,522 people46.4bottom 34.0%C#46 of 57 in NEStrongest: walkability A, health A−·lowest: safety C−
155Burbank, CALos Angeles County · 102,988 people46.4bottom 34.0%C#346 of 841 in CAStrongest: walkability A, health A−·lowest: cost of living D−
156Denton, TXDenton County · 169,431 people46.4bottom 33.8%C#284 of 640 in TXStrongest: walkability A, health B·lowest: cost of living D
157Orlando, FLOrange County · 333,888 people46.1bottom 33.1%C#323 of 634 in FLStrongest: walkability A, health B·lowest: cost of living D
158Aurora, COArapahoe County · 410,053 people45.9bottom 32.6%C#122 of 158 in COStrongest: walkability A, health B+·lowest: safety D−
159Metairie, LAunincorporated, Jefferson Parish · 139,729 people45.9bottom 32.6%C#67 of 161 in LAStrongest: walkability A−, jobs & income B·lowest: hazard risk D−
160Capital Township, ILSangamon County · 111,143 people45.9bottom 32.5%C#580 of 767 in ILStrongest: walkability A, hazard risk B·lowest: schools C−
161Palm Bay, FLBrevard County · 148,092 people45.8bottom 32.4%C#334 of 634 in FLStrongest: schools B+, walkability B+·lowest: hazard risk D
162Austin, TXTravis County · 1,002,632 people45.8bottom 32.4%C#294 of 640 in TXStrongest: walkability A, health A·lowest: cost of living D
163Garden Grove, CAOrange County · 170,455 people45.8bottom 32.3%C#358 of 841 in CAStrongest: walkability A−, schools A−·lowest: cost of living D−
164Cedar Rapids, IALinn County · 137,935 people45.7bottom 32.1%C#104 of 140 in IAStrongest: walkability A−, hazard risk B·lowest: schools D
165Spokane Valley, WASpokane County · 108,405 people45.7bottom 32.0%C#184 of 285 in WAStrongest: hazard risk A+, walkability A−·lowest: safety D
166Glendale, AZMaricopa County · 260,572 people45.4bottom 31.1%C#79 of 139 in AZStrongest: walkability A−, schools B+·lowest: safety D
167Tracy, CASan Joaquin County · 101,901 people45.2bottom 30.8%C#372 of 841 in CAStrongest: walkability A−, jobs & income B+·lowest: cost of living D−
168Concord, CAContra Costa County · 123,261 people45.1bottom 30.5%C#377 of 841 in CAStrongest: walkability A+, jobs & income B+·lowest: hazard risk D−
169Corona, CARiverside County · 161,734 people45.0bottom 30.3%C#381 of 841 in CAStrongest: schools B+, jobs & income B+·lowest: cost of living D−
170Warren Township, INMarion County · 107,778 people45.0bottom 30.2%C#487 of 585 in INStrongest: walkability A−, hazard risk A−·lowest: schools C−
171Brandon, FLunincorporated, Hillsborough County · 119,767 people44.9bottom 30.1%C#356 of 634 in FLStrongest: health B+, walkability B+·lowest: cost of living D
172Yonkers, NYWestchester County · 212,603 people44.9bottom 30.1%C#552 of 745 in NYStrongest: walkability A+, hazard risk B+·lowest: cost of living D−
173West Covina, CALos Angeles County · 105,301 people44.9bottom 30.0%C#387 of 841 in CAStrongest: walkability A−, jobs & income B+·lowest: cost of living D−
174Sparks, NVWashoe County · 111,902 people44.9bottom 29.9%C#19 of 42 in NVStrongest: walkability A−, health B·lowest: hazard risk C−
175Renton, WAKing County · 104,975 people44.7bottom 29.5%C#193 of 285 in WAStrongest: walkability A, health A·lowest: cost of living D
176Wayne Township, INAllen County · 111,761 people44.7bottom 29.5%C#489 of 585 in INStrongest: walkability A, cost of living A−·lowest: health C−
177Hampton, VAHampton city · 137,315 people44.6bottom 29.2%C#206 of 249 in VAStrongest: hazard risk A, walkability A−·lowest: safety C−
178Lexington, KYFayette County · 329,751 people44.6bottom 29.2%C#94 of 138 in KYStrongest: walkability A, health B·lowest: safety C−
179Oceanside, CASan Diego County · 170,483 people44.5bottom 29.0%C#404 of 841 in CAStrongest: walkability A, health A−·lowest: cost of living D−
180Riverview, FLunincorporated, Hillsborough County · 113,697 people44.5bottom 28.9%C#365 of 634 in FLStrongest: health A−, jobs & income B+·lowest: cost of living D
181Omaha, NEDouglas County · 488,797 people44.4bottom 28.7%C#50 of 57 in NEStrongest: walkability A−, health B+·lowest: schools D−
182Spokane, WASpokane County · 230,783 people44.3bottom 28.6%C#197 of 285 in WAStrongest: hazard risk A+, walkability A+·lowest: safety D−
183North Charleston, SCCharleston County · 129,245 people44.2bottom 28.4%C#106 of 167 in SCStrongest: schools A, walkability A−·lowest: hazard risk D−
184Vacaville, CASolano County · 103,850 people44.0bottom 27.9%C#414 of 841 in CAStrongest: walkability A−, health B+·lowest: cost of living D−
185San Buenaventura (Ventura), CAVentura County · 109,914 people43.9bottom 27.6%C#418 of 841 in CAStrongest: walkability A, health B+·lowest: hazard risk D−
186St. Paul, MNRamsey County · 306,684 people43.7bottom 27.2%C#259 of 271 in MNStrongest: walkability A+, hazard risk A−·lowest: safety D
187Hollywood, FLBroward County · 157,019 people43.7bottom 27.2%C#388 of 634 in FLStrongest: walkability A, schools B·lowest: cost of living D−
188Pasadena, CALos Angeles County · 135,804 people43.7bottom 27.2%C#421 of 841 in CAStrongest: walkability A+, health A−·lowest: cost of living D−
189North Township, INLake County · 152,714 people43.7bottom 27.1%C#504 of 585 in INStrongest: walkability A−, cost of living A−·lowest: health D
190Enterprise, NVunincorporated, Clark County · 240,464 people43.6bottom 27.0%C#21 of 42 in NVStrongest: health B+, walkability B+·lowest: cost of living D
191Clearwater, FLPinellas County · 114,364 people43.5bottom 26.7%C#394 of 634 in FLStrongest: walkability A+, schools B·lowest: cost of living D
192Deltona, FLVolusia County · 100,267 people43.4bottom 26.5%C#399 of 634 in FLStrongest: jobs & income B, walkability B−·lowest: hazard risk C−
193Charlotte, NCMecklenburg County · 964,784 people43.4bottom 26.4%C#165 of 286 in NCStrongest: walkability A, health A−·lowest: safety D
194Minneapolis, MNHennepin County · 430,324 people43.1bottom 25.9%C#262 of 271 in MNStrongest: walkability A+, health A−·lowest: safety D−
195Hialeah, FLMiami-Dade County · 230,968 people43.1bottom 25.7%C#406 of 634 in FLStrongest: walkability A, schools B+·lowest: cost of living D
196Billings, MTYellowstone County · 121,239 people43.0bottom 25.5%C#29 of 41 in MTStrongest: hazard risk A−, walkability A−·lowest: safety D
197Reno, NVWashoe County · 283,621 people43.0bottom 25.4%C#22 of 42 in NVStrongest: walkability A, health B·lowest: safety D
198Santa Rosa, CASonoma County · 179,437 people42.9bottom 25.2%C#447 of 841 in CAStrongest: walkability A, health B+·lowest: hazard risk D−
199Menifee, CARiverside County · 118,592 people42.8bottom 24.9%C−#449 of 841 in CAStrongest: schools B, walkability B·lowest: hazard risk D−
200Fort Wayne, INAllen County · 275,203 people42.7bottom 24.7%C−#518 of 585 in INStrongest: walkability A−, cost of living B+·lowest: safety C−
201St. Petersburg, FLPinellas County · 264,033 people42.6bottom 24.5%C−#417 of 634 in FLStrongest: walkability A, health B+·lowest: safety D
202Pittsburgh, PAAllegheny County · 307,632 people42.4bottom 24.2%C−#928 of 1,032 in PAStrongest: walkability A+, health B+·lowest: safety D
203Springfield, MOGreene County · 169,847 people42.1bottom 23.6%C−#176 of 247 in MOStrongest: walkability A−, hazard risk B+·lowest: safety D−
204Avondale, AZMaricopa County · 100,983 people42.1bottom 23.4%C−#96 of 139 in AZStrongest: jobs & income B+, health B+·lowest: hazard risk C−
205Durham, NCDurham County · 305,561 people42.0bottom 23.2%C−#179 of 286 in NCStrongest: walkability A, health A−·lowest: safety D
206Tyler, TXSmith County · 113,723 people41.9bottom 23.2%C−#364 of 640 in TXStrongest: hazard risk A+, walkability B·lowest: safety C−
207Fontana, CASan Bernardino County · 221,223 people41.9bottom 23.1%C−#468 of 841 in CAStrongest: walkability A−, jobs & income B+·lowest: hazard risk D−
208Greeley, COWeld County · 115,073 people41.9bottom 23.0%C−#136 of 158 in COStrongest: walkability A−, hazard risk B·lowest: safety D
209Grand Rapids, MIKent County · 201,183 people41.8bottom 22.8%C−#583 of 697 in MIStrongest: walkability A+, health B·lowest: safety D
210Green Bay, WIBrown County · 106,675 people41.6bottom 22.3%C−#336 of 357 in WIStrongest: hazard risk A−, walkability B+·lowest: schools D
211Chico, CAButte County · 105,081 people41.4bottom 22.1%C−#478 of 841 in CAStrongest: walkability A, schools B+·lowest: cost of living D−
212West Valley City, UTSalt Lake County · 137,491 people41.4bottom 22.1%C−#113 of 118 in UTStrongest: walkability A, jobs & income B+·lowest: schools C−
213Jacksonville, FLDuval County · 1,017,689 people41.4bottom 22.0%C−#437 of 634 in FLStrongest: walkability A−, jobs & income B−·lowest: cost of living C
214Kent, WAKing County · 134,871 people41.3bottom 21.7%C−#221 of 285 in WAStrongest: walkability A, health A−·lowest: safety D
215Knoxville, TNKnox County · 202,021 people41.1bottom 21.3%C−#108 of 175 in TNStrongest: walkability A, hazard risk B+·lowest: safety D
216Garland, TXDallas County · 249,625 people41.1bottom 21.2%C−#379 of 640 in TXStrongest: walkability B+, jobs & income B·lowest: cost of living C−
217Colorado Springs, COEl Paso County · 494,743 people41.1bottom 21.2%C−#138 of 158 in COStrongest: walkability A−, health A−·lowest: safety D
218Pompano Beach, FLBroward County · 117,211 people40.9bottom 21.0%C−#445 of 634 in FLStrongest: walkability A, schools B·lowest: cost of living D
219Henderson, NVClark County · 353,289 people40.9bottom 20.9%C−#29 of 42 in NVStrongest: walkability B+, health B+·lowest: cost of living D
220Atlanta, GAFulton County · 529,110 people40.9bottom 20.9%C−#151 of 258 in GAStrongest: walkability A+, hazard risk A−·lowest: safety D
221Wayne Township, INMarion County · 150,959 people40.9bottom 20.8%C−#542 of 585 in INStrongest: walkability A−, cost of living B+·lowest: health C−
222Wilmington, NCNew Hanover County · 126,809 people40.8bottom 20.7%C−#192 of 286 in NCStrongest: walkability A, health B+·lowest: hazard risk D−
223Boston, MASuffolk County · 672,973 people40.7bottom 20.4%C−#252 of 282 in MAStrongest: walkability A+, hazard risk A·lowest: cost of living D
224Palm Coast, FLFlagler County · 109,886 people40.7bottom 20.4%C−#448 of 634 in FLStrongest: schools B+, health B·lowest: cost of living D
225Spring Hill, FLunincorporated, Hernando County · 119,983 people40.4bottom 19.8%C−#454 of 634 in FLStrongest: walkability B+, schools B−·lowest: hazard risk C−
226Irving, TXDallas County · 257,076 people40.4bottom 19.7%C−#389 of 640 in TXStrongest: walkability A−, health B+·lowest: cost of living D
227Tucson, AZPima County · 548,371 people40.4bottom 19.7%C−#108 of 139 in AZStrongest: walkability A, schools B·lowest: safety D
228West Palm Beach, FLPalm Beach County · 127,189 people40.3bottom 19.6%C−#455 of 634 in FLStrongest: walkability A, schools B+·lowest: cost of living D−
229Baton Rouge, LAEast Baton Rouge Parish · 222,795 people40.3bottom 19.5%C−#105 of 161 in LAStrongest: walkability A−, schools B−·lowest: health C−
230Center Township, INMarion County · 155,258 people40.2bottom 19.4%C−#551 of 585 in INStrongest: walkability A+, cost of living B·lowest: schools C−
231Tampa, FLHillsborough County · 413,554 people40.2bottom 19.4%C−#458 of 634 in FLStrongest: walkability A, health B·lowest: cost of living D
232Dearborn, MIWayne County · 105,611 people40.1bottom 19.3%C−#601 of 697 in MIStrongest: walkability A−, hazard risk B+·lowest: cost of living C−
233Lakewood Township, NJOcean County · 143,765 people40.1bottom 19.2%C−#392 of 466 in NJStrongest: walkability A, safety B+·lowest: cost of living D−
234Midland, TXMidland County · 147,615 people39.8bottom 18.6%C−#398 of 640 in TXStrongest: hazard risk B+, jobs & income B+·lowest: schools C−
235Sacramento, CASacramento County · 536,449 people39.7bottom 18.5%C−#509 of 841 in CAStrongest: walkability A, hazard risk B+·lowest: safety D
236Jersey City, NJHudson County · 302,013 people39.4bottom 18.0%C−#396 of 466 in NJStrongest: walkability A+, health A−·lowest: cost of living D−
237Joliet, ILWill County · 152,241 people39.4bottom 18.0%C−#667 of 767 in ILStrongest: walkability B+, jobs & income B·lowest: schools C−
238Salt Lake City, UTSalt Lake County · 218,428 people39.3bottom 17.7%C−#114 of 118 in UTStrongest: walkability A+, health A−·lowest: safety D−
239Eugene, ORLane County · 178,618 people39.2bottom 17.6%C−#89 of 142 in ORStrongest: walkability A+, health B+·lowest: cost of living D−
240Columbia, SCRichland County · 147,035 people39.2bottom 17.6%C−#124 of 167 in SCStrongest: walkability A+, hazard risk B·lowest: safety D
241McAllen, TXHidalgo County · 150,640 people39.1bottom 17.4%C−#412 of 640 in TXStrongest: schools B+, walkability B·lowest: cost of living D
242Kansas City, MOJackson County · 521,220 people39.0bottom 17.2%C−#200 of 247 in MOStrongest: walkability A, hazard risk B+·lowest: safety D−
243Tallahassee, FLLeon County · 204,902 people39.0bottom 17.1%C−#478 of 634 in FLStrongest: walkability A, health B·lowest: safety D
244Yuma, AZYuma County · 105,227 people39.0bottom 17.1%C−#111 of 139 in AZStrongest: walkability A−, schools C+·lowest: hazard risk C−
245High Point, NCGuilford County · 120,571 people39.0bottom 17.0%C−#206 of 286 in NCStrongest: walkability B, hazard risk B·lowest: safety D
246Warren, MIMacomb County · 137,138 people38.9bottom 16.8%C−#612 of 697 in MIStrongest: hazard risk B+, walkability B+·lowest: safety C−
247Hayward, CAAlameda County · 157,113 people38.9bottom 16.8%C−#528 of 841 in CAStrongest: walkability A, jobs & income B+·lowest: hazard risk D
248Albuquerque, NMBernalillo County · 556,588 people38.9bottom 16.8%C−#44 of 72 in NMStrongest: walkability A, hazard risk B+·lowest: safety D−
249Independence, MOJackson County · 121,675 people38.9bottom 16.8%C−#202 of 247 in MOStrongest: walkability B+, cost of living B+·lowest: safety D
250Tacoma, WAPierce County · 229,816 people38.9bottom 16.7%C−#234 of 285 in WAStrongest: walkability A+, health B·lowest: safety D−
251Spring Valley, NVunincorporated, Clark County · 219,187 people38.8bottom 16.7%C−#31 of 42 in NVStrongest: walkability A−, health B−·lowest: cost of living D
252Cape Coral, FLLee County · 236,264 people38.8bottom 16.7%C−#484 of 634 in FLStrongest: walkability B, health B·lowest: cost of living D
253Lafayette, LALafayette Parish · 123,311 people38.8bottom 16.6%C−#114 of 161 in LAStrongest: schools A−, walkability A−·lowest: safety D−
254Wichita Falls, TXWichita County · 101,951 people38.7bottom 16.5%C−#423 of 640 in TXStrongest: walkability A−, hazard risk B·lowest: safety C−
255Fairfield, CASolano County · 122,489 people38.7bottom 16.4%C−#532 of 841 in CAStrongest: walkability A−, health B·lowest: cost of living D−
256Vancouver, WAClark County · 199,698 people38.7bottom 16.4%C−#237 of 285 in WAStrongest: walkability A, hazard risk B·lowest: safety D
257San Angelo, TXTom Green County · 100,640 people38.6bottom 16.1%C−#427 of 640 in TXStrongest: hazard risk A−, walkability B+·lowest: safety C−
258Clarksville, TNMontgomery County · 188,829 people38.5bottom 16.1%C−#126 of 175 in TNStrongest: schools B, walkability C+·lowest: safety C
259Chicago, ILCook County · 2,731,585 people38.5bottom 16.0%C−#676 of 767 in ILStrongest: walkability A+, health B+·lowest: safety D
260Miami, FLMiami-Dade County · 489,812 people38.4bottom 16.0%C−#493 of 634 in FLStrongest: walkability A+, schools B+·lowest: cost of living D−
261New York City, NYKings County · 8,584,629 people38.4bottom 15.9%C−#651 of 745 in NYStrongest: walkability A+, hazard risk A−·lowest: cost of living D−
262Topeka, KSShawnee County · 125,795 people38.3bottom 15.6%C−#136 of 150 in KSStrongest: walkability A−, cost of living B·lowest: safety D−
263Fort Lauderdale, FLBroward County · 188,677 people38.2bottom 15.4%C−#496 of 634 in FLStrongest: walkability A, schools B·lowest: cost of living D−
264Laredo, TXWebb County · 269,515 people38.0bottom 15.2%C−#440 of 640 in TXStrongest: hazard risk A, schools B+·lowest: health C−
265Peoria, ILPeoria County · 110,920 people38.0bottom 15.2%C−#681 of 767 in ILStrongest: walkability A, hazard risk B+·lowest: safety D−
266Manchester, NHHillsborough County · 116,818 people37.9bottom 15.0%C−#120 of 125 in NHStrongest: walkability A−, health B+·lowest: schools D−
267Escondido, CASan Diego County · 146,030 people37.7bottom 14.8%D#551 of 841 in CAStrongest: walkability A, jobs & income B·lowest: cost of living D−
268Gainesville, FLAlachua County · 148,671 people37.6bottom 14.6%D#504 of 634 in FLStrongest: walkability A+, health B+·lowest: safety D
269Columbus, OHFranklin County · 938,396 people37.5bottom 14.3%D#933 of 987 in OHStrongest: walkability A, hazard risk B+·lowest: safety D
270Miami Gardens, FLMiami-Dade County · 113,579 people37.5bottom 14.3%D#507 of 634 in FLStrongest: walkability A, schools B+·lowest: cost of living D
271Grand Prairie, TXDallas County · 209,434 people37.5bottom 14.3%D#450 of 640 in TXStrongest: jobs & income B, health C+·lowest: cost of living C−
272Greensboro, NCGuilford County · 308,667 people37.3bottom 14.0%D#215 of 286 in NCStrongest: walkability A−, hazard risk B·lowest: safety D−
273Port St. Lucie, FLSt. Lucie County · 268,062 people37.2bottom 13.9%D#512 of 634 in FLStrongest: health B, walkability B−·lowest: hazard risk D−
274Anaheim, CAOrange County · 341,008 people37.2bottom 13.9%D#560 of 841 in CAStrongest: walkability A, jobs & income B·lowest: cost of living D−
275Long Beach, CALos Angeles County · 450,469 people37.1bottom 13.7%D#564 of 841 in CAStrongest: walkability A, schools B·lowest: cost of living D−
276Ontario, CASan Bernardino County · 187,013 people37.1bottom 13.7%D#565 of 841 in CAStrongest: walkability A−, jobs & income B·lowest: hazard risk D−
277Riverside, CARiverside County · 323,057 people37.0bottom 13.5%D#568 of 841 in CAStrongest: walkability A, schools B·lowest: hazard risk D−
278East Los Angeles, CAunincorporated, Los Angeles County · 111,647 people36.9bottom 13.3%D#574 of 841 in CAStrongest: walkability A+, schools B−·lowest: hazard risk D
279Visalia, CATulare County · 146,541 people36.9bottom 13.3%D#575 of 841 in CAStrongest: walkability B+, schools B·lowest: cost of living D
280Thornton Township, ILCook County · 152,667 people36.8bottom 13.2%D#693 of 767 in ILStrongest: walkability A+, cost of living C+·lowest: hazard risk D
281Worcester, MAWorcester County · 213,862 people36.5bottom 12.7%D#259 of 282 in MAStrongest: walkability A+, hazard risk A−·lowest: cost of living C−
282Albany, NYAlbany County · 101,698 people36.4bottom 12.7%D#669 of 745 in NYStrongest: walkability A+, hazard risk A−·lowest: safety D
283Lowell, MAMiddlesex County · 119,971 people36.4bottom 12.7%D#260 of 282 in MAStrongest: walkability A+, health B·lowest: schools D
284Savannah, GAChatham County · 149,440 people36.2bottom 12.3%D#191 of 258 in GAStrongest: walkability A, health C+·lowest: hazard risk D−
285Evansville, INVanderburgh County · 116,176 people36.2bottom 12.2%D#574 of 585 in INStrongest: walkability A−, cost of living B+·lowest: safety D−
286Springfield, ILSangamon County · 112,989 people36.0bottom 12.0%D#702 of 767 in ILStrongest: walkability A, hazard risk B·lowest: safety D−
287Oklahoma City, OKOklahoma County · 719,849 people36.0bottom 11.9%D#100 of 131 in OKStrongest: walkability B+, jobs & income B−·lowest: safety D
288Abilene, TXTaylor County · 131,588 people35.8bottom 11.7%D#474 of 640 in TXStrongest: walkability B+, jobs & income B−·lowest: safety C−
289El Paso, TXEl Paso County · 683,012 people35.8bottom 11.6%D#475 of 640 in TXStrongest: hazard risk A−, walkability A−·lowest: cost of living C−
290Newport News, VANewport News city · 183,230 people35.8bottom 11.6%D#227 of 249 in VAStrongest: walkability A, hazard risk A·lowest: safety D
291Santa Ana, CAOrange County · 315,586 people35.5bottom 11.2%D#599 of 841 in CAStrongest: walkability A, jobs & income B+·lowest: cost of living D−
292Amarillo, TXRandall County · 205,130 people35.4bottom 11.1%D#480 of 640 in TXStrongest: walkability B+, jobs & income B−·lowest: safety D
293Tuscaloosa, ALTuscaloosa County · 114,316 people35.4bottom 11.0%D#143 of 187 in ALStrongest: walkability A−, cost of living C+·lowest: safety D
294Chattanooga, TNHamilton County · 194,144 people35.3bottom 10.9%D#137 of 175 in TNStrongest: walkability A−, schools B·lowest: safety D−
295Oakland, CAAlameda County · 440,838 people35.1bottom 10.7%D#604 of 841 in CAStrongest: walkability A+, health B+·lowest: safety D−
296Cincinnati, OHHamilton County · 314,367 people35.0bottom 10.6%D#957 of 987 in OHStrongest: walkability A+, hazard risk A−·lowest: safety D−
297Las Cruces, NMDoña Ana County · 116,978 people35.0bottom 10.6%D#56 of 72 in NMStrongest: walkability A−, hazard risk B·lowest: safety D−
298South Bend, INSt. Joseph County · 103,201 people35.0bottom 10.5%D#579 of 585 in INStrongest: hazard risk A+, walkability A−·lowest: safety D
299Richmond, CAContra Costa County · 114,861 people34.9bottom 10.5%D#605 of 841 in CAStrongest: walkability A+, jobs & income B−·lowest: safety D
300Suffolk, VASuffolk city · 104,699 people34.9bottom 10.4%D#230 of 249 in VAStrongest: hazard risk B+, jobs & income B+·lowest: cost of living C−
301North Las Vegas, NVClark County · 296,653 people34.7bottom 10.3%D#34 of 42 in NVStrongest: hazard risk A, walkability A−·lowest: cost of living C−
302Los Angeles, CALos Angeles County · 3,869,089 people34.5bottom 10.0%D#613 of 841 in CAStrongest: walkability A+, health B−·lowest: cost of living D−
303Des Moines, IAPolk County · 212,086 people34.5bottom 10.0%D#134 of 140 in IAStrongest: walkability A, hazard risk A−·lowest: schools D−
304Davenport, IAScott County · 100,358 people34.2bottom 9.8%D#135 of 140 in IAStrongest: walkability A−, hazard risk B·lowest: schools D−
305Akron, OHSummit County · 189,691 people34.0bottom 9.4%D#963 of 987 in OHStrongest: hazard risk A−, walkability A−·lowest: safety D
306Paradise, NVunincorporated, Clark County · 185,913 people34.0bottom 9.4%D#36 of 42 in NVStrongest: walkability A+, hazard risk C+·lowest: cost of living C−
307Lansing, MIIngham County · 113,884 people33.7bottom 9.1%D#673 of 697 in MIStrongest: walkability A, hazard risk B·lowest: safety D−
308Lynn, MAEssex County · 104,236 people33.6bottom 8.9%D#266 of 282 in MAStrongest: walkability A+, jobs & income B·lowest: schools D
309Kansas City, KSWyandotte County · 157,805 people33.6bottom 8.9%D#146 of 150 in KSStrongest: walkability A−, hazard risk B+·lowest: schools D−
310Providence, RIProvidence County · 195,310 people33.5bottom 8.8%D#36 of 38 in RIStrongest: walkability A+, hazard risk B·lowest: schools D
311Sunrise Manor, NVunincorporated, Clark County · 200,218 people33.2bottom 8.4%D#37 of 42 in NVStrongest: walkability A, hazard risk B+·lowest: health D
312St. Louis, MOSt. Louis city · 278,144 people33.2bottom 8.3%D#227 of 247 in MOStrongest: walkability A+, cost of living B·lowest: safety D−
313Toledo, OHLucas County · 263,423 people33.1bottom 8.3%D#969 of 987 in OHStrongest: walkability A, hazard risk B+·lowest: safety D−
314Winston-Salem, NCForsyth County · 257,271 people33.0bottom 8.2%D#243 of 286 in NCStrongest: walkability B+, hazard risk B−·lowest: safety D
315San Antonio, TXBexar County · 1,548,422 people33.0bottom 8.1%D#526 of 640 in TXStrongest: walkability A, schools B−·lowest: safety D−
316Philadelphia, PAPhiladelphia County · 1,574,281 people32.9bottom 8.1%D#1011 of 1,032 in PAStrongest: walkability A+, hazard risk B−·lowest: safety D−
317Mesquite, TXDallas County · 150,693 people32.7bottom 7.8%D#533 of 640 in TXStrongest: walkability B, jobs & income B−·lowest: safety D
318El Cajon, CASan Diego County · 101,755 people32.7bottom 7.8%D#644 of 841 in CAStrongest: walkability A, schools C+·lowest: cost of living D
319Antioch, CAContra Costa County · 118,958 people32.7bottom 7.7%D#647 of 841 in CAStrongest: walkability A, jobs & income B−·lowest: safety D
320Montgomery, ALMontgomery County · 195,300 people32.6bottom 7.6%D#152 of 187 in ALStrongest: walkability B+, cost of living B·lowest: schools C−
321Salem, ORMarion County · 181,779 people32.5bottom 7.5%D#116 of 142 in ORStrongest: walkability A, health B−·lowest: cost of living D
322Moreno Valley, CARiverside County · 214,263 people32.4bottom 7.4%D#652 of 841 in CAStrongest: walkability B+, jobs & income B·lowest: hazard risk D−
323Jurupa Valley, CARiverside County · 107,311 people32.4bottom 7.4%D#653 of 841 in CAStrongest: walkability B+, jobs & income B+·lowest: hazard risk D−
324Arlington, TXTarrant County · 402,134 people32.3bottom 7.3%D#541 of 640 in TXStrongest: walkability B, jobs & income B−·lowest: safety C−
325Gresham, ORMultnomah County · 111,513 people32.3bottom 7.3%D#118 of 142 in ORStrongest: walkability A+, jobs & income B−·lowest: cost of living D
326Fayetteville, NCCumberland County · 209,120 people32.3bottom 7.2%D#245 of 286 in NCStrongest: walkability A−, hazard risk B−·lowest: safety D
327Richmond, VARichmond city · 237,257 people32.3bottom 7.2%D#236 of 249 in VAStrongest: walkability A+, hazard risk A·lowest: schools D−
328Wichita, KSSedgwick County · 400,987 people32.1bottom 7.0%D#149 of 150 in KSStrongest: walkability B+, cost of living B·lowest: safety D−
329Baltimore, MDBaltimore city · 569,997 people32.1bottom 7.0%D#251 of 259 in MDStrongest: walkability A+, hazard risk A·lowest: schools D−
330Dayton, OHMontgomery County · 136,688 people32.0bottom 6.9%D#974 of 987 in OHStrongest: walkability A+, cost of living B+·lowest: safety D−
331Fresno, CAFresno County · 555,549 people32.0bottom 6.8%D#662 of 841 in CAStrongest: walkability A−, schools B·lowest: safety D
332Las Vegas, NVClark County · 679,817 people31.8bottom 6.7%D#38 of 42 in NVStrongest: walkability A, hazard risk B·lowest: safety D
333Lakeland, FLPolk County · 125,520 people31.7bottom 6.6%D#567 of 634 in FLStrongest: walkability A, jobs & income B−·lowest: schools D
334Cleveland, OHCuyahoga County · 363,608 people31.7bottom 6.6%D#978 of 987 in OHStrongest: walkability A+, hazard risk B+·lowest: safety D−
335El Monte, CALos Angeles County · 105,075 people31.6bottom 6.5%D#668 of 841 in CAStrongest: walkability A, jobs & income C+·lowest: hazard risk D−
336Pomona, CALos Angeles County · 147,807 people31.6bottom 6.5%D#671 of 841 in CAStrongest: walkability A, jobs & income B−·lowest: hazard risk D−
337Little Rock, ARPulaski County · 206,427 people31.5bottom 6.4%D#91 of 123 in ARStrongest: walkability A−, jobs & income B−·lowest: safety D−
338Fort Myers, FLLee County · 101,581 people31.5bottom 6.3%D#570 of 634 in FLStrongest: walkability A−, jobs & income C+·lowest: cost of living D−
339Columbus, GAMuscogee County · 202,171 people31.3bottom 6.2%D#220 of 258 in GAStrongest: hazard risk A−, walkability B·lowest: safety D
340Norfolk, VANorfolk city · 231,013 people31.3bottom 6.2%D#238 of 249 in VAStrongest: walkability A+, hazard risk A−·lowest: schools D−
341Fort Worth, TXTarrant County · 1,028,117 people31.3bottom 6.1%D#554 of 640 in TXStrongest: walkability B+, jobs & income B·lowest: schools D
342Elizabeth, NJUnion County · 141,675 people31.2bottom 6.0%D#435 of 466 in NJStrongest: walkability A+, hazard risk B+·lowest: cost of living D
343Brownsville, TXCameron County · 192,957 people31.1bottom 6.0%D#559 of 640 in TXStrongest: schools B, walkability B−·lowest: hazard risk C−
344Detroit, MIWayne County · 649,095 people31.1bottom 5.9%D#680 of 697 in MIStrongest: walkability A+, hazard risk A−·lowest: safety D−
345Edinburg, TXHidalgo County · 110,700 people31.1bottom 5.9%D#560 of 640 in TXStrongest: walkability B−, schools B−·lowest: cost of living D
346Pasadena, TXHarris County · 148,539 people31.0bottom 5.9%D#562 of 640 in TXStrongest: walkability B, cost of living C+·lowest: safety D
347Lubbock, TXLubbock County · 273,071 people30.9bottom 5.8%D#565 of 640 in TXStrongest: walkability B+, health C+·lowest: safety D
348Allentown, PALehigh County · 126,044 people30.8bottom 5.6%D#1021 of 1,032 in PAStrongest: walkability A+, hazard risk B−·lowest: schools D
349Dallas, TXDallas County · 1,329,491 people30.7bottom 5.6%D#567 of 640 in TXStrongest: walkability A, jobs & income B−·lowest: safety D
350Brockton, MAPlymouth County · 106,134 people30.5bottom 5.4%D#272 of 282 in MAStrongest: walkability A, hazard risk A−·lowest: schools D
351Rialto, CASan Bernardino County · 106,554 people30.4bottom 5.3%D#693 of 841 in CAStrongest: walkability A−, jobs & income B−·lowest: hazard risk D−
352Salinas, CAMonterey County · 159,134 people30.4bottom 5.2%D#695 of 841 in CAStrongest: walkability A−, jobs & income B·lowest: hazard risk D
353Oxnard, CAVentura County · 199,651 people30.3bottom 5.2%D#697 of 841 in CAStrongest: walkability A−, jobs & income B·lowest: hazard risk D
354Jackson, MSHinds County · 141,196 people30.1bottom 5.0%D#82 of 99 in MSStrongest: walkability A−, cost of living B−·lowest: health D
355Buffalo, NYErie County · 274,613 people30.1bottom 4.9%D−#722 of 745 in NYStrongest: walkability A+, cost of living B·lowest: safety D−
356Stockton, CASan Joaquin County · 324,597 people30.0bottom 4.9%D−#706 of 841 in CAStrongest: walkability A−, hazard risk C+·lowest: safety D−
357Modesto, CAStanislaus County · 219,652 people30.0bottom 4.8%D−#708 of 841 in CAStrongest: walkability A, jobs & income B−·lowest: cost of living D
358Vallejo, CASolano County · 123,287 people29.6bottom 4.4%D−#724 of 841 in CAStrongest: walkability A, health B−·lowest: safety D−
359Odessa, TXEctor County · 122,707 people29.5bottom 4.3%D−#586 of 640 in TXStrongest: hazard risk B−, walkability B−·lowest: schools D
360Waco, TXMcLennan County · 147,788 people29.5bottom 4.3%D−#588 of 640 in TXStrongest: hazard risk A, walkability B+·lowest: cost of living D
361Lehigh Acres, FLunincorporated, Lee County · 132,353 people29.3bottom 4.1%D−#584 of 634 in FLStrongest: walkability C+, schools C+·lowest: hazard risk D
362Birmingham, ALJefferson County · 195,893 people29.2bottom 4.1%D−#164 of 187 in ALStrongest: walkability A, cost of living B·lowest: safety D−
363New Bedford, MABristol County · 101,834 people28.5bottom 3.7%D−#278 of 282 in MAStrongest: walkability A, hazard risk A·lowest: schools D
364Shreveport, LACaddo Parish · 175,902 people28.5bottom 3.6%D−#153 of 161 in LAStrongest: schools B, walkability B·lowest: safety D−
365Hesperia, CASan Bernardino County · 102,605 people28.4bottom 3.6%D−#740 of 841 in CAStrongest: walkability B, schools C+·lowest: hazard risk D
366Corpus Christi, TXNueces County · 317,247 people28.4bottom 3.6%D−#602 of 640 in TXStrongest: walkability A−, jobs & income C+·lowest: safety D
367Pueblo, COPueblo County · 110,404 people28.4bottom 3.6%D−#158 of 158 in COStrongest: hazard risk B+, walkability B+·lowest: safety D−
368Bridgeport, CTFairfield County · 152,273 people28.2bottom 3.4%D−#146 of 151 in CTStrongest: walkability A+, health C·lowest: schools D
369Tulsa, OKTulsa County · 416,209 people27.9bottom 3.2%D−#130 of 131 in OKStrongest: walkability A−, hazard risk C+·lowest: safety D−
370Mobile, ALMobile County · 200,824 people27.8bottom 3.2%D−#169 of 187 in ALStrongest: walkability B, cost of living C+·lowest: hazard risk D
371Syracuse, NYOnondaga County · 144,896 people27.7bottom 3.1%D−#734 of 745 in NYStrongest: walkability A+, hazard risk B+·lowest: schools D−
372Houston, TXHarris County · 2,397,315 people27.6bottom 3.0%D−#606 of 640 in TXStrongest: walkability A, health C+·lowest: safety D−
373Inglewood, CALos Angeles County · 101,662 people27.4bottom 2.9%D−#758 of 841 in CAStrongest: walkability A+, jobs & income C+·lowest: cost of living D−
374Rochester, NYMonroe County · 206,108 people27.3bottom 2.7%D−#737 of 745 in NYStrongest: walkability A+, hazard risk B·lowest: schools D−
375San Bernardino, CASan Bernardino County · 222,044 people26.9bottom 2.6%D−#766 of 841 in CAStrongest: walkability A−, schools C+·lowest: hazard risk D−
376Milwaukee, WIMilwaukee County · 562,407 people26.7bottom 2.4%D−#357 of 357 in WIStrongest: walkability A+, hazard risk A−·lowest: schools D−
377Macon-Bibb County, GABibb County · 157,556 people26.4bottom 2.2%D−#242 of 258 in GAStrongest: hazard risk A, walkability B·lowest: health D
378Bakersfield, CAKern County · 422,165 people26.1bottom 2.1%D−#780 of 841 in CAStrongest: walkability B+, jobs & income C+·lowest: cost of living D−
379Santa Maria, CASanta Barbara County · 111,390 people26.0bottom 2.0%D−#781 of 841 in CAStrongest: walkability A, jobs & income C+·lowest: cost of living D
380Killeen, TXBell County · 161,883 people25.4bottom 1.8%D−#622 of 640 in TXStrongest: hazard risk B+, walkability C+·lowest: safety C−
381Victorville, CASan Bernardino County · 141,395 people25.3bottom 1.7%D−#789 of 841 in CAStrongest: walkability B+, jobs & income C−·lowest: hazard risk C−
382New Orleans, LAOrleans Parish · 362,154 people25.2bottom 1.7%D−#159 of 161 in LAStrongest: walkability A+, health C+·lowest: hazard risk D−
383Lancaster, CALos Angeles County · 170,084 people24.9bottom 1.6%D−#793 of 841 in CAStrongest: walkability B+, health C+·lowest: hazard risk D
384Palmdale, CALos Angeles County · 161,845 people24.7bottom 1.5%D−#796 of 841 in CAStrongest: walkability B, health C+·lowest: cost of living D
385Newark, NJEssex County · 323,808 people24.6bottom 1.4%D−#453 of 466 in NJStrongest: walkability A+, hazard risk B−·lowest: schools D
386New Haven, CTNew Haven County · 138,774 people22.8bottom 0.9%D−#148 of 151 in CTStrongest: walkability A+, hazard risk C+·lowest: cost of living D−
387Paterson, NJPassaic County · 161,793 people22.1bottom 0.8%D−#460 of 466 in NJStrongest: walkability A+, hazard risk C+·lowest: safety D
388Rockford, ILWinnebago County · 147,384 people22.0bottom 0.8%D−#767 of 767 in ILStrongest: walkability B, hazard risk C+·lowest: safety D−
389Springfield, MAHampden County · 154,702 people21.4bottom 0.6%D−#281 of 282 in MAStrongest: walkability A, hazard risk B·lowest: safety D
390Memphis, TNShelby County · 609,647 people20.7bottom 0.5%D−#170 of 175 in TNStrongest: walkability A−, cost of living C+·lowest: safety D−
391Waterbury, CTNew Haven County · 115,771 people20.6bottom 0.5%D−#150 of 151 in CTStrongest: walkability A, hazard risk C−·lowest: cost of living D
392Beaumont, TXJefferson County · 112,967 people19.2bottom 0.3%D−#640 of 640 in TXStrongest: walkability B, cost of living C·lowest: safety D−
393Hartford, CTHartford County · 121,981 people17.9bottom 0.2%D−#151 of 151 in CTStrongest: walkability A+, hazard risk C·lowest: cost of living D−
Not ranked

7 cities of 100,000+ without an overall grade

Each is missing figures the overall grade needs; its page shows every subject that is graded.

Quick answers

Questions people ask

What is the best big city to live in?

Among the 393 graded cities of 100,000+, Fishers, Indiana ranks first (A+): schools (A+) and jobs & income (A+) are its strongest grades; cost of living (C−) is its lowest. Naperville, IL and Highlands Ranch, CO follow.

How are these cities ranked?

By the overall grade, which blends seven livability grades (cost of living, safety, schools, health, jobs & income, walkability, hazard risk) from public data. The letter is national; the rank beside it is within the city’s state. How grades work.

Why isn’t my city on this list?

The list covers places of 100,000+ residents with an overall grade. 7 cities lack figures for one and are listed above. Smaller places are on their state’s list.

Other states

Best places to live, state by state