Guest, Sign inJoin

Post to Renton

We’ll email a one-tap link to publish your post. No password, and nothing is public until you click it.
Already a member? Sign in
Renton
Washington›King County

RentonWA

A city of 104,975, settled in 1876.

Trash day: look up yours
9 bordering townsMap →
Woolworth, F.W., Company Store · Photo: Visitor7 · CC BY-SA 3.0
Photo of Renton

Renton, WA · Woolworth, F.W., Company Store · Photo: Visitor7 · CC BY-SA 3.0

What is it like to live in Renton?

Renton is a city of 104,975, and it grades C overall, 193rd of 285 graded towns in Washington. CDC estimates put its residents' health ahead of 92% of the country and the median household earns $100K. The trade-offs: the typical home is worth about $725K, 6.3 years of the Seattle metro’s $115K median household income, and its police reported 272 violent crimes reported to the FBI in 2025, a higher rate per resident than 89% of U.S. towns. Renton is easier to get around on foot or by transit than 94% of U.S. towns. Renton’s trail density is 1.3 miles per square mile, against 0.8 in Washington’s towns and 0.4 across U.S. towns. Renton is home to Renton Technical College.

What makes Renton stand out

Where Renton beats most towns.

A growing town

Renton has grown 15% since 2010

90,927 counted in 2010 and 106,785 in 2020; an estimated 104,975 in 2025.

90,9272010
106,7852020
104,9752025 est.

U.S. Census 2010 & 2020 counts · Census Bureau estimate, July 1, 2025

How Renton grades

Each subject compared with towns across the country (schools within Washington), ordered by how far Renton is from typical.

How grading works
Character Graded, but not part of the overall grade.
Described, not graded Taste, not quality: snow or an older crowd is neither good nor bad.

How TownRatings grades towns →

Woolworth, F.W., Company Store
Woolworth, F.W., Company Store · National Register of Historic Places
Renton’s story

150 years in pictures

Census counts: 200 in 1880, 106,785 in 2020. The archive holds 6 old photos and papers going back to 1909 and 5 maps from 1949 on.

1 place on the National Register of Historic Places.

  • 1876Renton is settled
Explore the history →
Nearby attractions

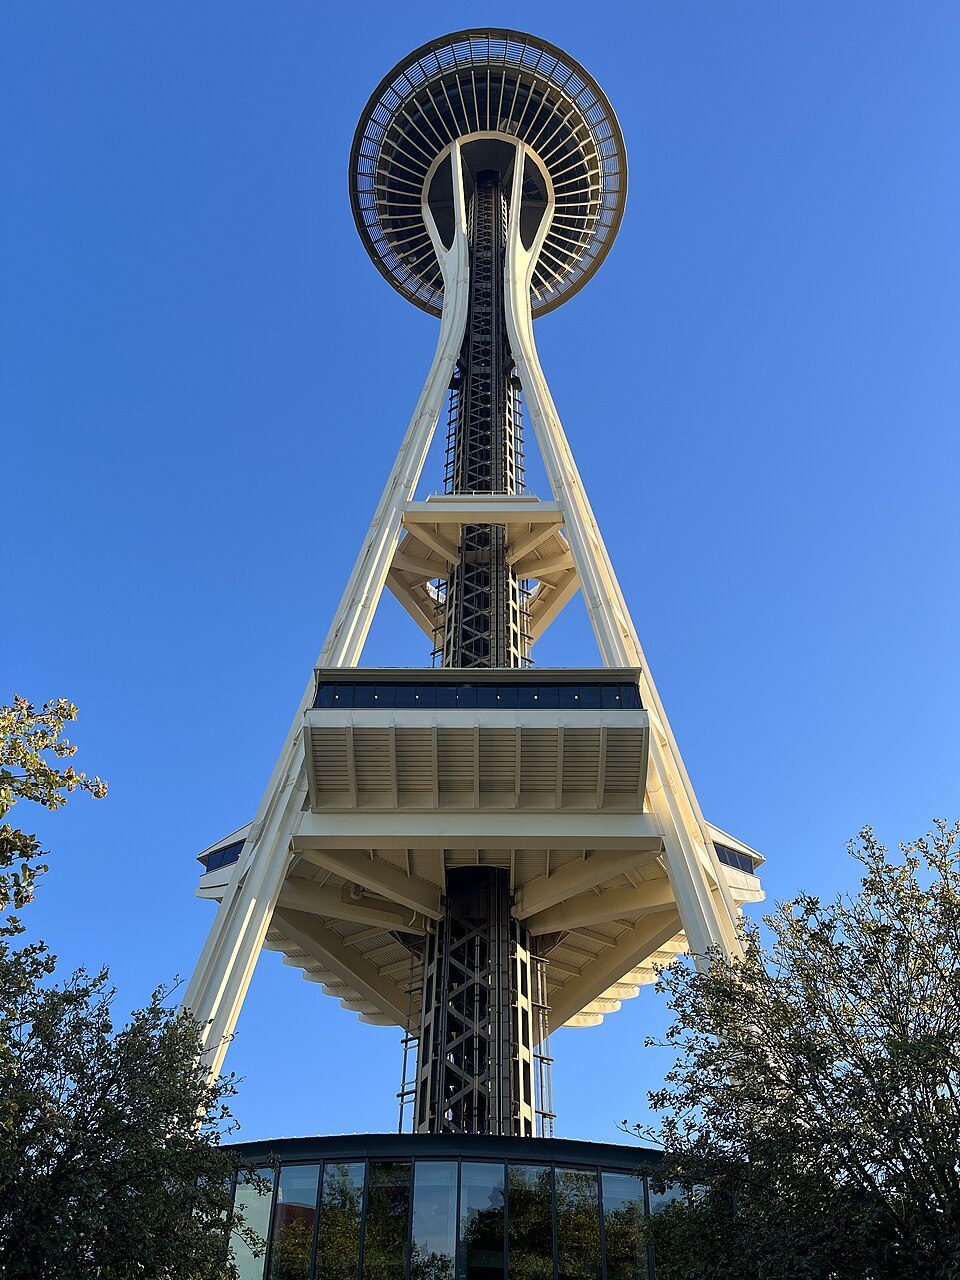
Space Needle and 136 more within 40 miles

Museums, parks, gardens and other places to visit around Renton. Close and well known come first.

All 155 attractions →
Sources: National Park Service · ski areas © OpenSkiMap / OpenStreetMap contributors · Wikidata · Wikipedia readership · photos via Wikimedia Commons
Photo credits

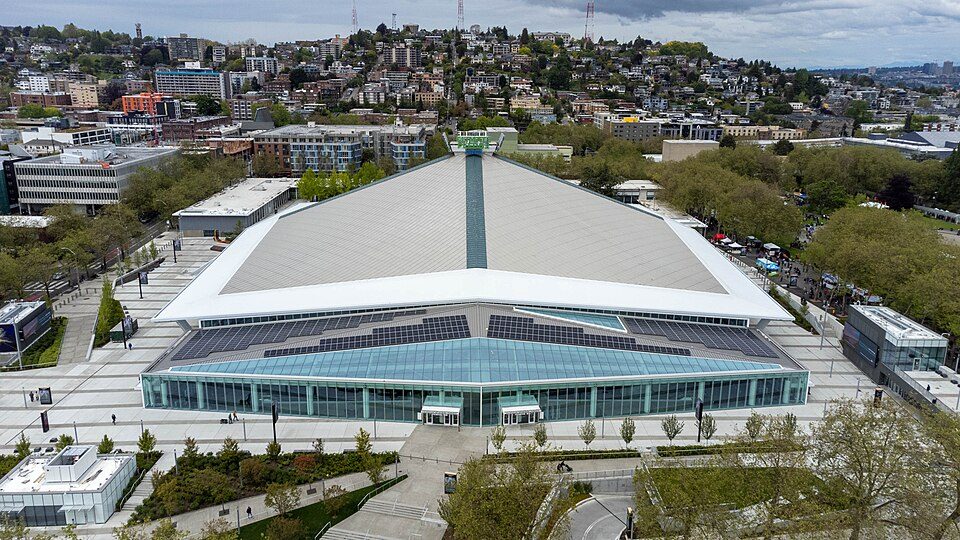
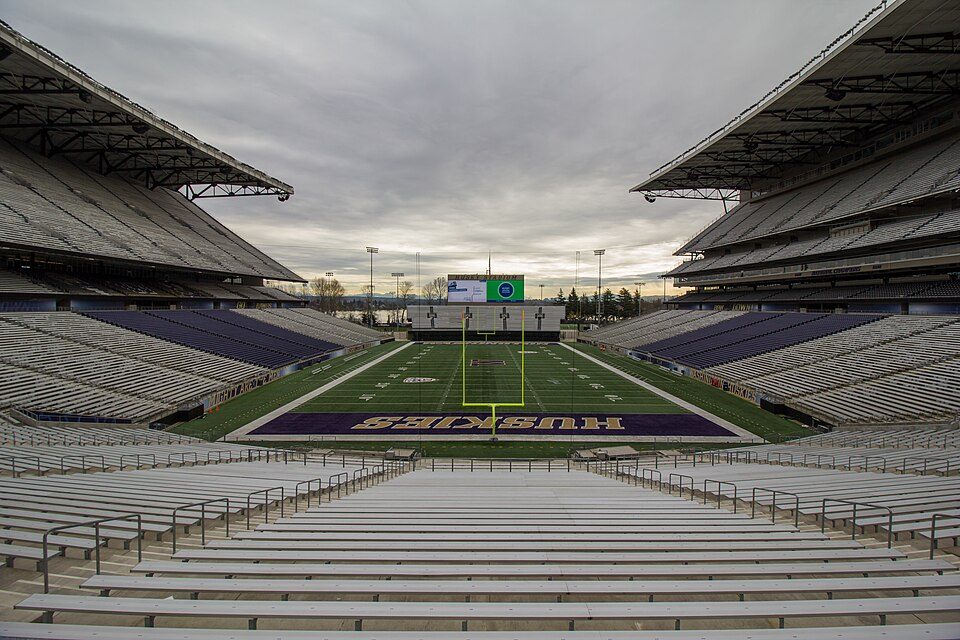
Space Needle: Another Believer, CC BY-SA 4.0 · Lumen Field: "Smart Destinations", GoSeattleCard.com, and Go Seattle Card Blog, CC BY-SA 2.0 · Climate Pledge Arena: Sea Cow, CC BY-SA 4.0 · T-Mobile Park: MyName (Cacophony), CC BY-SA 3.0 · Seattle Underground: Mark Hursh, CC BY-SA 3.0 · Husky Stadium: Atomic Taco, CC BY-SA 2.0

Getting set up

Moving to Renton: who provides what

Who provides power, water and the rest in Renton, and how to reach them.

The full setup list →
PowerPuget Sound Energy17.0¢/kWh · EIA 2025HIFLD · EIA
WaterCity of Renton water systemNo health-based violations in 5 years · EPAEPA
Internet6 providers100% of addresses get 100/20 MbpsFCC
Trash & dumpBy addressDay by addressTown site
SchoolsRenton School DistrictWhich school depends on your addressNCES
Register to voteOnlineIn Washington you can register online until 8 days before Election Day, in person up to and including Election Day, or by mail (received 8 days before).vote.gov
Who runs elections hereKing County ElectionsKing County; contacts on the Handbook page.FVAP, Sep 2021
ZIP codes98056, 98055, 98059, 9805898056 28% · 98055 23% · 98059 21% · 98058 15%Census 2020

EPA SDWIS (Oct 9, 2026) · HIFLD + EIA-861 2025 · Census 2020 ZCTAs · NCES 2024–25 · registration: vote.gov, updated Sep 30, 2026.

The data

Ordered by what stands out in Renton.

Renton has cooler summers than nearly all U.S. towns and has seen reported crime fall by a third or more.

HealthA

For health, Renton earns an A

24% of adults have obesity in Renton, below both Washington’s towns (33%) and U.S. towns (35%). 69% of adults had a checkup this year in Renton. Renton beats the Washington average on 10 of 31 CDC measures and trails it on 6.

92%healthier than U.S. townsAHealth Grade
RentonWashington townsU.S. towns
Obesity (CDC PLACES)24%33%35%
Yearly checkup (CDC PLACES)69%71%79%
Frequent physical distress (CDC PLACES)11%13%14%
High blood pressure (CDC PLACES)28%31%35%
31 measures vs. Washington
10 better15 too close to call6 worse
What stands outRentonWA
Fewer adults who have had cancer5.9%7.9%
Fewer adults with obesity24%30.6%
More adults facing food insecurity12%10.2%
Valley Medical Center
2.8 mi away · emergency room
2 of 3
care shortages: primary care, mental health
82nd
percentile among WA towns

CDC PLACES 2025 · modeled estimates for adults · CMS · HRSA

SchoolsC+

Renton’s public schools trail 56% of Washington districts

Its public schools are run by the Renton School District. Two of its 37 schools are below, each with why it’s listed.

44%of WA districts it outscoresC+School Grade
SchoolLevelStudentsLetter
Nelsen Middle SchoolLargest public middle schoolGrades 6–8Grades 6–8913–
Hazen Senior High SchoolLargest public high schoolGrades 9–12Grades 9–121,796–

NCES · EDFacts · graded within WA on state tests and graduation

OutdoorsA

Conserved land covers 7.5% of Renton

32 miles of trail in 38 parks and preserves. The biggest park or preserve is Black River Riparian Forest and Wetland, at 97 acres.

#89for trails in WA
7.5%
conserved · 1,211 of 16,045 acres
32 mi
of trails · 1.3 per sq mi
Biggest places to walkTrailsAcres
1. Gene Coulon Memorial Beach Park1.3 mi35
2. Heritage Park0.9 mi10
3. Sunset Neighborhood Park0.7 mi9

Trails & parks © OpenStreetMap contributors · Conserved land: USGS PAD-US

SafetyD

For safety, Renton earns a D

Reported crimes fell from 4,971 to 2,852 over the last three FBI years, a drop beyond ordinary year-to-year swings.

The property crime rate in Renton is 24.5 per 1,000 residents. Renton reports more crime per resident than most U.S. towns we grade: about 89% report less. The violent crime rate in Renton is 2.6 per 1,000 residents.

11%of U.S. towns report more crimeDSafety Grade
RentonWashington townsU.S. towns
Property crimes per 1,000 (2025)24.5 per 1,000 residents159.9
Violent crimes per 1,000 (2025)2.6 per 1,000 residents1.51.6

Violent crime per 1,000 residents

Renton2.6
Washington2.9
U.S.3.3

Property crime per 1,000 residents

Renton24.5
Washington20.2
U.S.15.5
11th
percentile among U.S. towns we grade
19th
percentile among WA towns
272
violent crimes reported in 2025
2,580
property crimes reported in 2025

FBI crime data, 2025 · crimes reported to police

Natural hazardsHazard risk grade D

Very high risk in Renton, with earthquakes at the top

Expected storm and flood damage is higher than in 83% of U.S. communities. Since 1990, 11 flood insurance claims have been paid out in Renton.

83risk score of 100
FEMA risk score
83Very high riskLowerHigher
EarthquakesInland flooding
11
paid flood claims since 1990
10
federal disasters paid out here

FEMA flood insurance claims · FEMA National Risk Index · OpenFEMA

HousingCost of living grade D

For cost of living, Renton earns a D

Renton’s median rent is $1,998 a month. The typical Renton home is worth about $725,000, down 2.2% in a year, 23% above the Washington typical home. 54% of Renton households own their home.

$725KZillow home value
RentonWashington townsU.S. towns
Households that own their home54%71%73%
Median rent$1,998 a month$1,737 a month$1,185 a month
Renters paying 30%+ of income on rent54%51%48%

Typical home value

Renton$725K
Washington$588K
Market temperature
BalancedA seller's marketBuyer’sSeller’s
19
days on market
99.6%
sale-to-list price
−2.2%
value change, 1 year
60
homes sold in May

Census ACS, 2020–24 · Zillow Home Value Index · Redfin Data Center

Climate

Four seasons and pleasant summers in Renton

July afternoons average 76.6°, cooler than in 97% of U.S. towns; January nights average 36°.

Renton has mild winters and pleasant summers. About 6 inches of snow falls in a winter.

6″snow a winter
RentonWashington townsU.S. towns
July high77°F77°F85°F
January low36°F35°F22°F

Typical low → high °F

Winter36–48°
Spring42–60°
Summer54–75°
Fall45–61°
Nov 16
typical first frost
Mar 13
typical last frost
+1.0°
vs. the 20th-century average

NOAA U.S. Climate Normals, 1991–2020

Work & commuteJobs & income grade A−

With 1.3 jobs for every working resident, Renton draws in 58,669 commuters

Most working residents leave Renton for work: only 12% work in town. Jobs based in Renton grew to 64,554 in 2023, 9,656 more than in 2013. The top destinations are Seattle (29%), Bellevue (11%) and Kent (6%).

12%work in town
RentonWashington townsU.S. towns
Work from home22%15%11%
Average trip to work30 minutes27 minutes25 minutes
Working residents who work in town12%4.8%8%
Median household income$100,000$98,000$80,000

Where working residents work

In Renton12%
Seattle29%
Bellevue11%
Kent6%
Redmond5%
10 mi
median commute distance
64,554
jobs based in Renton
Balanced
jobs vs. working residents
A
Walkability grade: more walkable than 94% of U.S. towns

Census LEHD 2023 · ACS

Who lives here

An age mix much like Washington’s

No broad age group is more than 4 points off the Washington average. 40% of adults 25 and older have a bachelor’s degree or more, vs 40% across Washington.

36.5median age · WA 38.3
RentonWashington townsU.S. towns
Bachelor’s degree or more, 25+40%30%29%
Aged 65 or older13%16%18%
Median age36.5 years38.6 years40.5 years
Under 1821%22%22%
RentonWashingtonUnited States

Ages · share of residents

Education · adults 25 and older

No diploma11%
High school20%
Some college19%
Associate’s10%
Bachelor’s26%
Graduate14%

Women and men · all residents

50% women, 50% men

That’s an even split within the survey’s margin of ±1 point. Across Washington, 49.6% of residents are women. Median age: women 36.8, men 36.2.

Ages and education in Renton
RentonWAU.S.
Under 1011.5%11.5%11.6%
10 to 179.3%9.9%10.3%
18 to 248%8.5%9.1%
25 to 3418.7%15.2%13.7%
35 to 4415.1%14.3%13.2%
45 to 5413.2%12%12.2%
55 to 6411.2%12%12.7%
65 to 747.6%10.1%10.2%
75 and older5.5%6.5%7%
No diploma11.1%7.7%10.4%
High school20.3%21.6%26%
Some college19.4%21%19.1%
Associate’s9.7%10%8.8%
Bachelor’s25.8%24%21.6%
Graduate13.7%15.6%14.1%

U.S. Census Bureau · ACS 2020-2024 5-year estimates

Keep exploring

Everything we know about Renton

20pages on Renton
After high school

Colleges nearby

18 within 15 miles of the center of Renton

College town

Renton Technical College calls Renton home

College Scorecard · IPEDS

Famous people from Renton

23 notable people were born in Renton.

See all 23 →

Renton’s neighbors

9 towns share a border with Renton.

Explore the map →
How the neighbors grade
TownWA rankOverallCostSafetySchoolsHealth
Renton#193CDDC+A
Fairwood#127B−D—B−A
East Renton Highlands#21A−D—A+A
Bryn Mawr-Skyway#152C+D—C+A
Newcastle#57B+D−C+AA+
Kent#221C−DDB−A−
Tukwila#236C−C−D−C+A−
Mercer Island#6AD−BA+A+

Fairwood, East Renton Highlands and Bryn Mawr-Skyway report no FBI crime data of their own. Compare Renton with a neighbor →

Questions about Renton

Short answers, built from the data on this page.

Is Renton, WA a good place to live?

Renton grades C overall, better than 30% of U.S. towns and #193 of 285 in Washington. It grades A for health, D for safety and C+ for schools. Cost of living is its weak spot, with a D.

What is Renton, WA known for?

23 notable people were born here, including Zach LaVine and Sean Kinney.