Guest, Sign inJoin

Post to Reno

We’ll email a one-tap link to publish your post. No password, and nothing is public until you click it.
Already a member? Sign in
Reno, Nevada (16931715632)
Nevada›Washoe County
Photo: Trevor Bexon · CC BY 2.0
Photo of Reno

Reno, NV · Photo: Trevor Bexon · CC BY 2.0 · Source ↗

What is it like to live in Reno?

Reno is a city of 283,621, and it grades C overall, 22nd of 42 graded towns in Nevada. It is more walkable than 91% of U.S. towns. The trade-offs: it reports more crime per resident than 89% of U.S. towns, including 1,568 violent crimes reported to the FBI in 2025, and homes are expensive, about $572K for a typical one and 6.5 times the Reno metro’s $87K median household income. 63% of working residents work locally in Reno, above both the Nevada town median (16%) and the median of U.S. towns (8%). Its National Register listings include Senator Francis G. Newland Home and California Building. Only 1 of the 12 Nevada towns we compare have a higher violent crime rate than Reno.

What makes Reno stand out

Where Reno beats most towns.

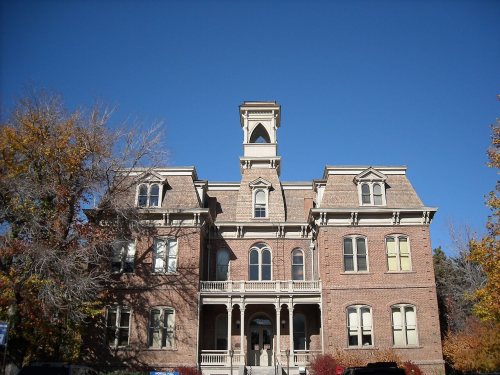
Senator Francis G. Newland Home
Senator Francis G. Newland Home · National Register of Historic Places
Reno’s story

158 years in pictures

Senator Francis G. Newland Home is a National Historic Landmark, the National Register’s top tier. Its 67 National Register listings are more than in any other Nevada town with a listing.

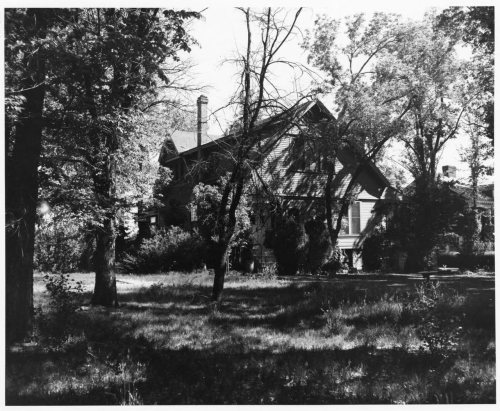
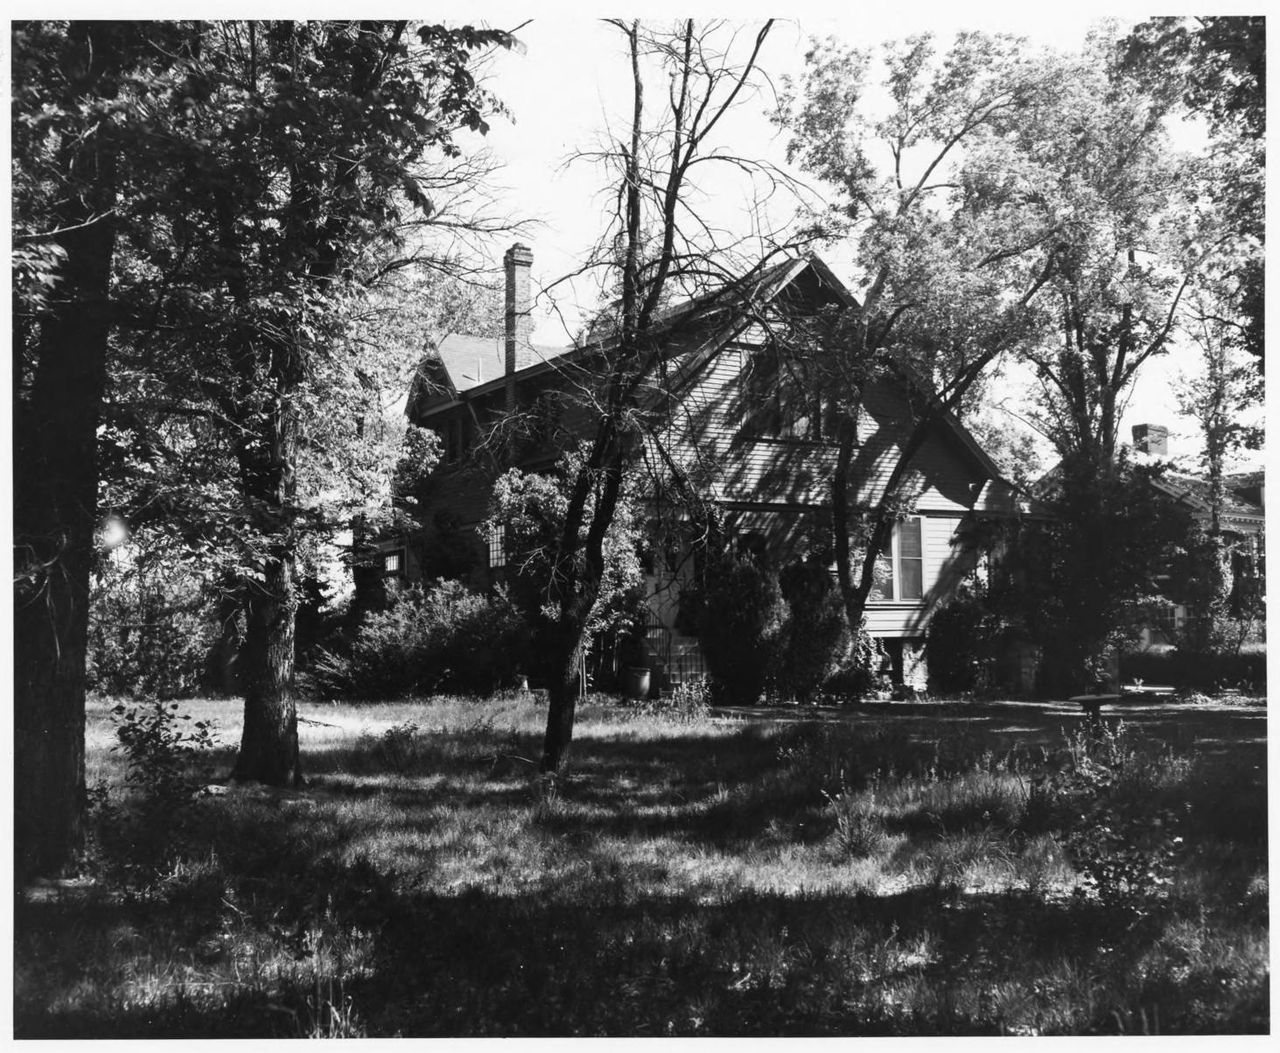
Census counts: 1,035 in 1870, 264,165 in 2020. The archive holds 6 old photos and papers going back to 1868 and 4 maps from 1950 on.

  • 1868Reno is settled
Explore the history →

How Reno grades

Each subject compared with towns across the country (schools within Nevada), ordered by how far Reno is from typical.

How grading works
Character Graded, but not part of the overall grade.
Described, not graded Taste, not quality: snow or an older crowd is neither good nor bad.

How TownRatings grades towns →

Nearby attractions

Lake Tahoe and 27 more within 40 miles

Museums, parks, gardens and other places to visit around Reno. Close and well known come first.

All 33 attractions →
Sources: National Park Service · ski areas © OpenSkiMap / OpenStreetMap contributors · Wikidata · Wikipedia readership · photos via Wikimedia Commons
Photo credits

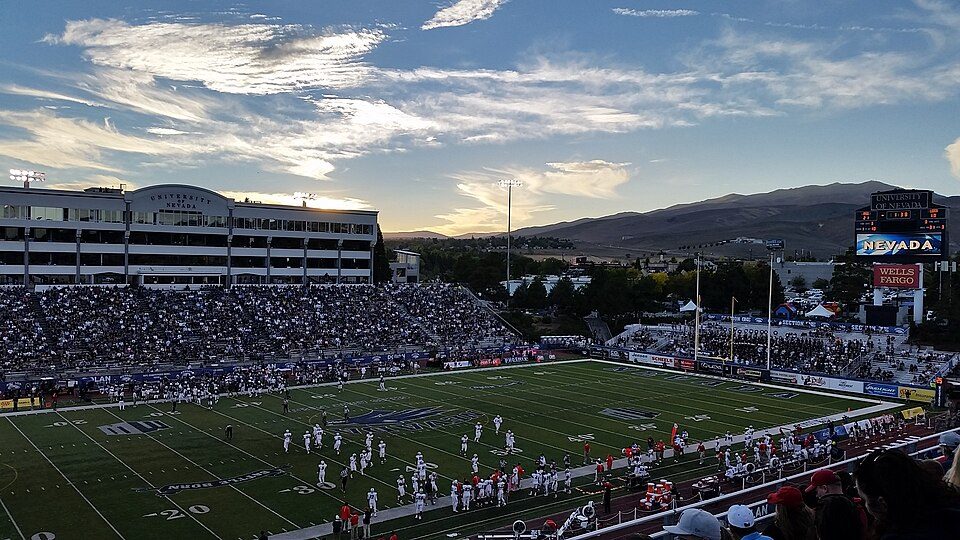
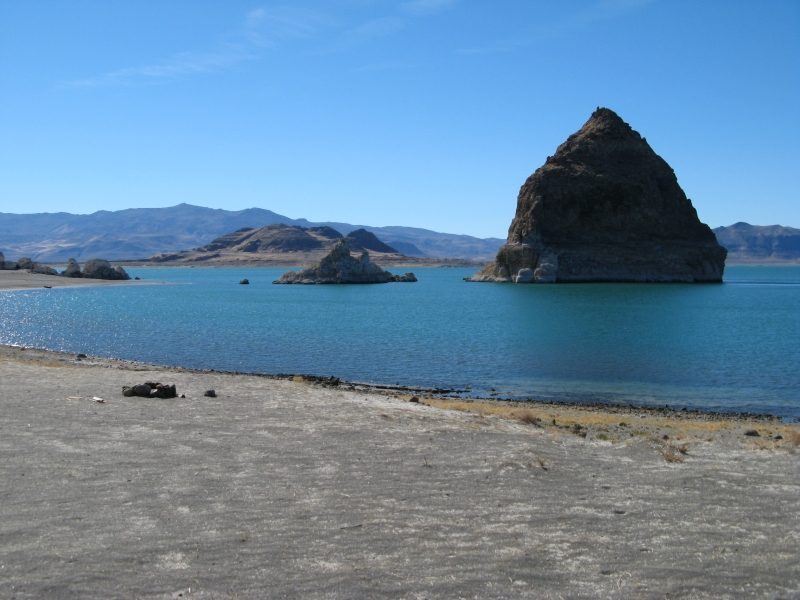
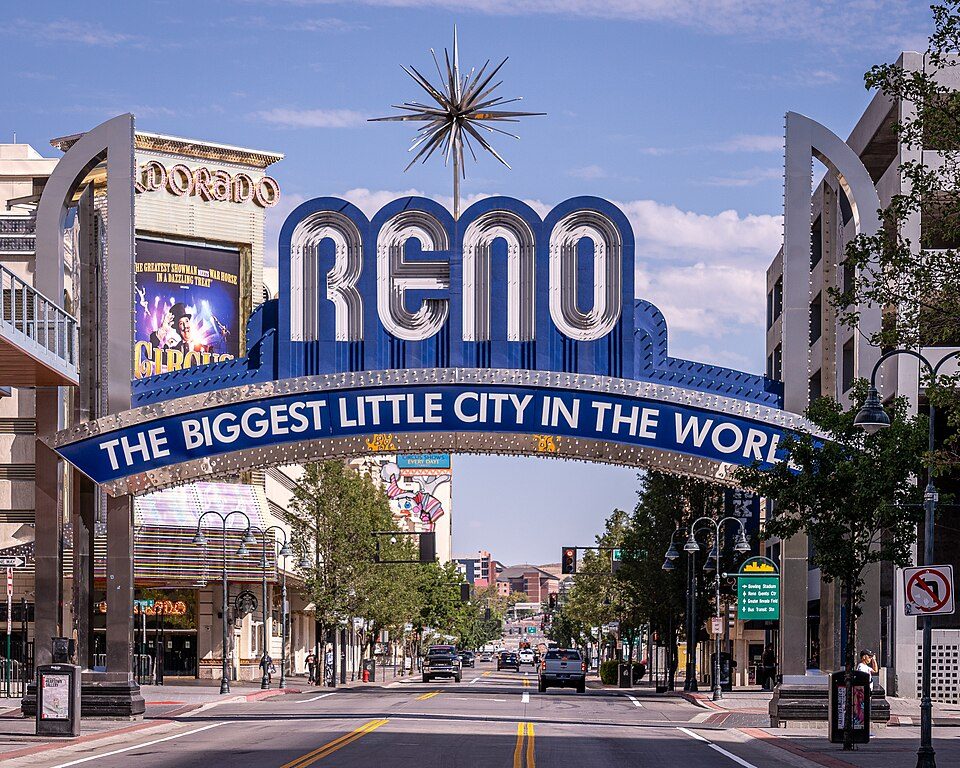
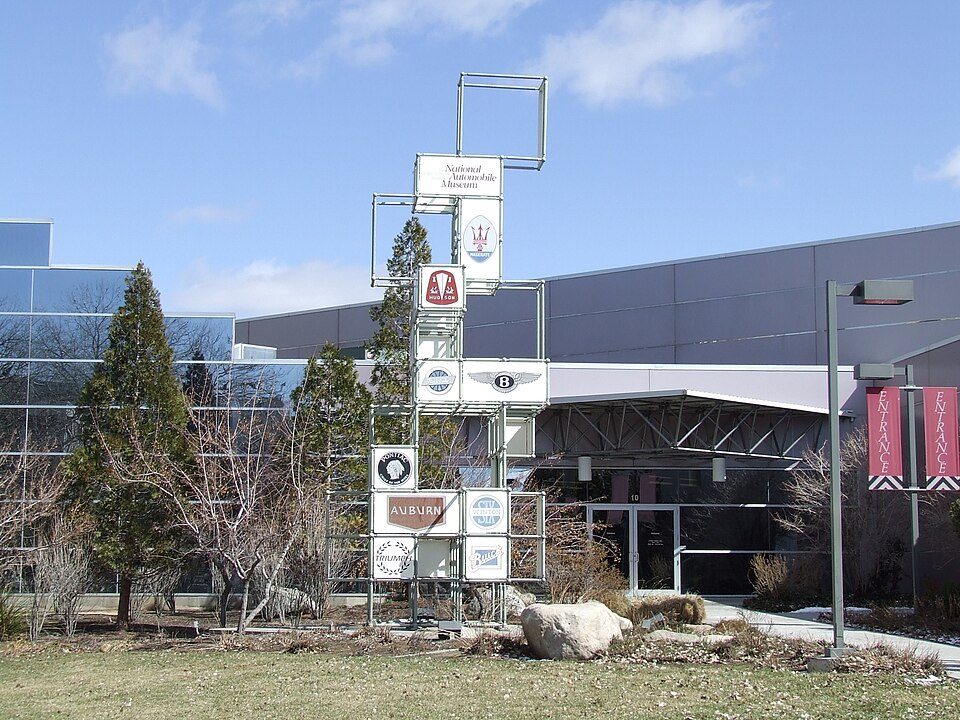
Lake Tahoe: Lara Farhadi, CC BY 2.0 · Mackay Stadium: Lanski, CC BY-SA 4.0 · Pyramid Lake: Rhalden, Public domain · Reno Arch: Mobilus In Mobili, CC BY-SA 2.0 · Donner Lake: J.smith, CC BY-SA 3.0 · National Automobile Museum: User:Jaydec, CC BY-SA 3.0

Getting set up

Moving to Reno: who provides what

Who provides power, water and the rest in Reno, and how to reach them.

The full setup list →
PowerNV Energy13.7¢/kWh · EIA 2025HIFLD · EIA
WaterTruckee Meadows Water AuthorityNo health-based violations in 5 years · EPAEPA
Internet8 providers98% of addresses get 100/20 MbpsFCC
Trash & dumpWMTrash haulerTown site
SchoolsWashoe County School DistrictWhich school depends on your addressNCES
Register to voteOnlineIn Nevada you can register online until 5 days before Election Day, in person up to and including Election Day, or by mail (postmarked 28 days before).vote.gov
Who runs elections hereWashoe County Registrar of VotersWashoe County; contacts on the Handbook page.FVAP, Jun 2023
ZIP codes89502, 89523, 89506, 8950989502 17% · 89523 13% · 89506 13% · 89509 13%Census 2020

EPA SDWIS (Oct 9, 2026) · HIFLD + EIA-861 2025 · Census 2020 ZCTAs · NCES 2024–25 · registration: vote.gov, updated Nov 18, 2024.

The data

Ordered by what stands out in Reno.

Reno has hotter summers than most of the country, though not than most of Nevada; it also has homes that cost more against local pay than most of Nevada and has a long record of flood insurance claims.

SafetyD

Reno earns a D for safety

Reported crimes fell from 8,986 to 8,176 over the last three FBI years, a drop beyond ordinary year-to-year swings.

Reno’s property crime rate is 23.1 per 1,000 residents. Reno reports more crime per resident than most U.S. towns we grade: about 89% report less.

11%of U.S. towns report more crimeDSafety Grade

Violent crime per 1,000 residents

Reno5.5
Nevada3.8
U.S.3.3

Property crime per 1,000 residents

Reno23.1
Nevada20.3
U.S.15.5
11th
percentile among U.S. towns we grade
1,568
violent crimes reported in 2025
6,608
property crimes reported in 2025

FBI crime data, 2025 · crimes reported to police

SchoolsB

Public schools in Reno beat 63% of Nevada districts

Its public schools are run by the Washoe County school district. Three of its 84 schools are below, each with why it’s listed.

63%of NV districts it outscoresBSchool Grade
SchoolLevelStudentsLetter
William Obrien Middle SchoolLargest public middle schoolGrades 6–8Grades 6–81,067C
Reno High SchoolLargest public high schoolGrades 9–12Grades 9–121,741A
Davidson AcademyTop results in townGrades 6–12Grades 6–12169A+

NCES · EDFacts · graded within NV on state tests and graduation

OutdoorsA−

Reno has set aside 4.8% of its land for conservation

201 miles of trail in 87 parks and preserves. The trail density in Reno is 1.8 miles per square mile. Sierra Vista Park, at 234 acres with 2.7 miles of trail, is the biggest park or preserve.

#24for trails in NV
RenoNevada townsU.S. towns
Miles of trail per square mile1.8 miles per square mile2.00.4
Conserved land4.8%5.5%4.3%
4.8%
conserved · 3,421 of 71,394 acres
201 mi
of trails · 1.8 per sq mi
Biggest places to walkTrailsAcres
1. Dorothy McAlinden/Mayor's Park5 mi91
2. Rancho San Rafael4.1 mi134
3. Keystone Canyon Non-Motorized Recreation Area3.9 mi111

Trails & parks © OpenStreetMap contributors · Conserved land: USGS PAD-US

HousingCost of living grade C−

Reno earns a C− for cost of living

At 6.5 years of the Reno metro’s $87K median household income, the typical home (about $572K) costs more against local pay than in 80% of Nevada towns; that ratio is one input to its C− for cost of living.

50% of Reno households own their home. The typical Reno home is worth about $572,000, up 2% in a year, 30% above the Nevada typical home.

$572KZillow home value
RenoNevada townsU.S. towns
Households that own their home50%70%73%
Median rent$1,556 a month$1,404 a month$1,185 a month
Renters paying 30%+ of income on rent53%53%48%

Typical home value

Reno$572K
Nevada$441K
Market temperature
Seller’s marketA seller's marketBuyer’sSeller’s
38
days on market
99.1%
sale-to-list price
+2%
value change, 1 year
326
homes sold in May

Census ACS, 2020–24 · Zillow Home Value Index · Redfin Data Center

Natural hazardsHazard risk grade C−

High risk in Reno, with earthquakes at the top

183 flood insurance claims have been filed here, and 12 properties have flooded more than once.

Expected storm and flood damage is higher than in 75% of U.S. communities. Since 1980, 183 flood insurance claims have been paid out in Reno.

75risk score of 100
FEMA risk score
75High riskLowerHigher
EarthquakesInland flooding
183
paid flood claims since 1980
4
federal disasters paid out here

FEMA flood insurance claims · FEMA National Risk Index · OpenFEMA

Climate

Reno has four seasons and hot summers

July afternoons average 88.6°: hotter than most of the country, but cooler than 75% of Nevada places with climate records; January nights average 24.5°.

Reno has chilly, snowy winters and warm summers, with very little rain. About 33 inches of snow falls in a winter.

33″snow a winter
RenoNevada townsU.S. towns
July high89°F94°F85°F
January low25°F25°F22°F

Typical low → high °F

Winter25–45°
Spring36–61°
Summer53–85°
Fall38–66°
Oct 12
typical first frost
May 8
typical last frost
+1.5°
vs. the 20th-century average

NOAA U.S. Climate Normals, 1991–2020

HealthB

A smaller share of adults have high blood pressure in Reno than in most of Nevada or the rest of the country

28% of adults have high blood pressure in Reno. Reno beats the Nevada average on 6 of 32 CDC measures and trails it on 2. 9.5% of adults have diabetes in Reno.

65%healthier than U.S. townsBHealth Grade
RenoNevada townsU.S. towns
Feel lonely (CDC PLACES)38%35%33%
Binge drink (CDC PLACES)19%16%16%
High blood pressure (CDC PLACES)28%35%35%
Obesity (CDC PLACES)28%33%35%
32 measures vs. Nevada
6 better24 too close to call2 worse
What stands outRenoNV
Fewer adults with diabetes9.5%12%
Fewer adults with high blood pressure28.2%34%
More binge drinkers18.9%15.7%
Saint Mary's Regional Medical Center
2.1 mi away · emergency room
2 of 3
care shortages: primary care, mental health
80th
percentile among NV towns

CDC PLACES 2025 · modeled estimates for adults · CMS · HRSA

Work & commuteJobs & income grade B−

Reno has 1.3 jobs for every working resident, and 84,524 people commute in

Jobs based in Reno grew to 161,459 in 2023, 31,668 more than in 2013. The top destinations are Sparks (13%), Carson City (3%) and Paradise (1%). Half commute less than 6 miles.

63%work in town
RenoNevada townsU.S. towns
Average trip to work20 minutes24 minutes25 minutes
Below the poverty line13%11%9.6%
Work from home12%9%11%

Where working residents work

In Reno63%
Sparks13%
Carson City3%
Paradise1%
Truckee1%
6 mi
median commute distance
161,459
jobs based in Reno
Balanced
jobs vs. working residents
A
Walkability grade: more walkable than 91% of U.S. towns

Census LEHD 2023 · ACS

Who lives here

More young adults than Nevada overall

Adults 18 to 34 are 27% of residents (22% statewide). Reno has grown 7.4% since 2020, to 283,621 residents in the Census Bureau’s 2025 estimate. Only 4 of the 42 Nevada towns we compare have a higher share of adults with a bachelor’s degree than Reno.

37.1median age · NV 39.1
RenoNevada townsU.S. towns
Bachelor’s degree or more, 25+37%22%29%
Median age37.1 years40.4 years40.5 years
Aged 65 or older17%20%18%
Under 1820%21%22%
RenoNevadaUnited States

Ages · share of residents

Education · adults 25 and older

No diploma11%
High school23%
Some college22%
Associate’s8%
Bachelor’s22%
Graduate15%

Women and men · all residents

49.3% women, 50.7% men

About 103 men for every 100 women. Across Nevada, 49.6% of residents are women. Median age: women 37.5, men 36.7.

Ages and education in Reno
RenoNVU.S.
Under 1010.8%11.4%11.6%
10 to 179.1%10.3%10.3%
18 to 249.9%8%9.1%
25 to 3416.8%14.4%13.7%
35 to 4414%13.9%13.2%
45 to 5410.8%12.6%12.2%
55 to 6411.7%12.4%12.7%
65 to 7410.3%10.3%10.2%
75 and older6.6%6.7%7%
No diploma10.7%12.5%10.4%
High school22.9%27.6%26%
Some college21.7%23.3%19.1%
Associate’s8%8.8%8.8%
Bachelor’s22.3%18.1%21.6%
Graduate14.5%9.8%14.1%

Census population estimates, 2025 · U.S. Census Bureau · ACS 2020-2024 5-year estimates

Keep exploring

Everything we know about Reno

19pages on Reno
After high school

Colleges nearby

2 within 15 miles of the center of Reno

A growing town

Reno has grown 26% since 2010

225,221 counted in 2010 and 264,165 in 2020; an estimated 283,621 in 2025.

Growth hasn’t slowed: 7.4% since 2020, after 17.3% in the decade before.

225,2212010
264,1652020
283,6212025 est.

U.S. Census 2010 & 2020 counts · Census Bureau estimate, July 1, 2025

Landmarks

67 places in Reno on the National Register of Historic Places.

All landmarks →

About Reno

City in Nevada, United States

Official town website ↗

Reno (, REE-noh) is a city in the northwest section of the U.S. state of Nevada, along the Nevada–California border. It is the county seat and most populous city of Washoe County. Sitting in the High Eastern Sierra foothills, in the Truckee River valley, on the eastern side of the Sierra Nevada, it is about 23 miles (37 km) northeast of Lake Tahoe. Reno is the 78th most populous city in the United States, the third most populous city in Nevada, and the most populous in Nevada outside the Las Vegas Valley. It is known as "The Biggest Little City in the World" and had a population of 264,165 at the 2020 census. The city is named after Civil War Union major general Jesse L. Reno, who was kille…

From Wikipedia, licensed CC BY-SA 4.0 · facts via Wikidata (CC0)

Established
1868
Area
110 sq mi
Elevation
4,505 ft
ZIP code
89501, 89502, 89503
Area code
775

Reno’s neighbors

7 towns share a border with Reno.

Explore the map →

All 4 graded towns on its borders grade higher than its C; Sparks (C) is closest.

How the neighbors grade
TownNV rankOverallCostSafetySchoolsHealth
Reno#22CC−DBB
Verdi——C−—BB+
Lemmon Valley#12C+C+—BB
Mogul——C+—BA
Sparks#19CC−C−BB
Cold Springs#10C+C—BB
Golden Valley——B−—BB+
Sun Valley#18CB−—BC−

Verdi, Mogul and Golden Valley have fewer than 2,500 residents, so they get subject grades but no overall grade. Verdi, Lemmon Valley, Mogul, Cold Springs, Golden Valley and Sun Valley report no FBI crime data of their own. Compare Reno with a neighbor →

Questions about Reno

Short answers, built from the data on this page.

Is Reno, NV a good place to live?

Reno grades C overall, better than 25% of U.S. towns and #22 of 42 in Nevada. It grades B for health, D for safety and B for schools. Safety is its weak spot, with a D.