111 years in pictures
Census counts: 62,479 in 1980, 114,852 in 2020. The archive holds 6 old photos and papers going back to 1848 and 4 maps from 1948 on.
8 places on the National Register of Historic Places.
- 1915North Charleston is settled
Each edition grades its towns against each other only.

North Charleston is a city of 129,245, and it grades C overall, 106th among South Carolina's 167 graded towns. Its schools outperform 86% of the state's and it is easier to get around on foot or by transit than 83% of U.S. towns. The trade-offs: FEMA rates its natural-hazard risk higher than 96% of U.S. communities, with hurricanes at the top, and its police reported 858 violent crimes reported to the FBI in 2025, a higher rate per resident than 97% of U.S. towns. 34% of working residents work locally in North Charleston, above both the South Carolina town median (6.1%) and the median of U.S. towns (8%). North Charleston is home to Trident Technical College. On the outdoors, just 25 of South Carolina’s 263 towns do better.
Where North Charleston beats most towns, and one thing worth knowing.
| School | Grades | Students |
|---|---|---|
| Meeting Street Brentwood | PK–8 | 806 |
| Fort Dorchester Elementary | PK–5 | 801 |
| Joseph R. Pye Elementary | PK–5 | 775 |
97,471 counted in 2010 and 114,852 in 2020; an estimated 129,245 in 2025.
Growth hasn’t slowed: 12.5% since 2020, after 17.8% in the decade before.
U.S. Census 2010 & 2020 counts · Census Bureau estimate, July 1, 2025
Each subject compared with towns across the country (schools within South Carolina), ordered by how far North Charleston is from typical.
Its grades run from A for schools (better than 86% of comparable towns) to D− for hazard risk (better than 2%), so the C overall blends very different results.
How TownRatings grades towns →
Census counts: 62,479 in 1980, 114,852 in 2020. The archive holds 6 old photos and papers going back to 1848 and 4 maps from 1948 on.
8 places on the National Register of Historic Places.
Museums, parks, gardens and other places to visit around North Charleston. Close and well known come first.
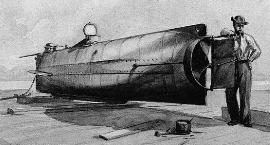
Big drawin town MuseumH. L. Hunley
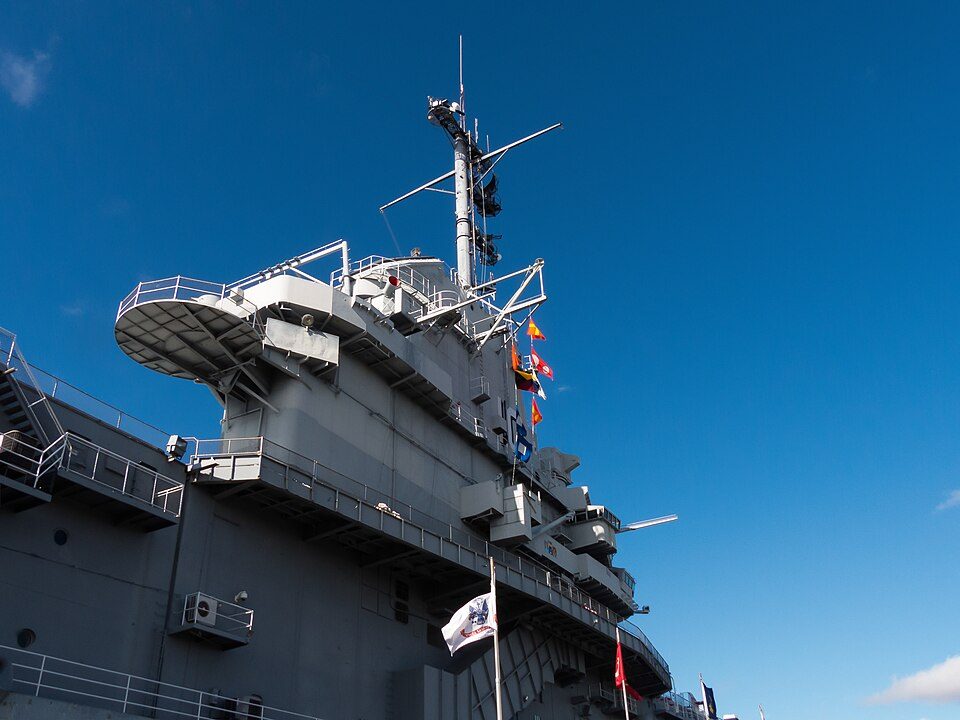
Big draw13 mi MuseumUSS Yorktown
13 mi MuseumUSS Laffey
14 mi Park & preserveAngel Oak
in town Stadium & arenaNorth Charleston Coliseum
13 mi DamThe BatteryH. L. Hunley: Sepia wash drawing by R.G. Skerrett, 1902, after a painting then held by the Con, Public domain · USS Yorktown: David Ratledge, CC BY 4.0 · USS Laffey: U.S. Navy, Public domain · Angel Oak: Galen Parks Smith, CC BY-SA 3.0 · North Charleston Coliseum: Chris Pruitt, CC BY-SA 3.0 · The Battery: Eagledj, CC BY-SA 4.0
Who provides power, water and the rest in North Charleston, and how to reach them.
EPA SDWIS (Oct 9, 2026) · HIFLD + EIA-861 2025 · Census 2020 ZCTAs · NCES 2024–25 · registration: vote.gov, updated Sep 12, 2025.
Ordered by what stands out in North Charleston.
North Charleston draws workers from Charleston and beyond, but it carries more natural-hazard risk than most of South Carolina (mostly hurricanes) and reports more crime than Charleston and its other graded neighbors.
Each of the 3 graded towns on its borders reports less crime per resident, from Charleston (C−) to Hanahan (B−). Reported crimes fell from 6,727 to 5,262 over the last three FBI years, a drop beyond ordinary year-to-year swings.
North Charleston’s property crime rate is 34.2 per 1,000 residents. North Charleston reports more crime per resident than most U.S. towns we grade: about 97% report less. North Charleston’s violent crime rate is 6.7 per 1,000 residents.
| North Charleston | South Carolina towns | U.S. towns | |
|---|---|---|---|
| Property crimes per 1,000 (2025) | 34.2 per 1,000 residents | 21.1 | 9.9 |
| Violent crimes per 1,000 (2025) | 6.7 per 1,000 residents | 3.9 | 1.6 |
FBI crime data, 2025 · crimes reported to police
Its A is the best School Grade on its borders; Charleston (B+) is next.
Its public schools are run by the Charleston 01 school district. Three of its 47 schools are below, each with why it’s listed.
| School | Level | Students | Letter |
|---|---|---|---|
| Meeting Street BrentwoodLargest public elementary schoolGrades PK–8 | Grades PK–8 | 806 | – |
| Fort Dorchester HighLargest public high schoolGrades 9–12 | Grades 9–12 | 2,344 | A |
| Academic Magnet HighTop results in townGrades 9–12 | Grades 9–12 | 740 | A+ |
NCES · EDFacts · graded within SC on state tests and graduation
68 miles of trail in 31 parks and preserves. The trail density in North Charleston is 0.8 miles per square mile. The biggest park or preserve is North Charleston Wannamaker County Park, at 146 acres.
| North Charleston | South Carolina towns | U.S. towns | |
|---|---|---|---|
| Miles of trail per square mile | 0.8 miles per square mile | 0.3 | 0.4 |
| Conserved land | 3.9% | 1.7% | 4.3% |
| Biggest places to walk | Trails | Acres |
|---|---|---|
| 1. North Charleston Wannamaker County Park | 0.8 mi | 146 |
| 2. Riverfront Park | 0.4 mi | 16 |
| 3. Air Park | 0.3 mi | 3 |
Trails & parks © OpenStreetMap contributors · Conserved land: USGS PAD-US
105,850 jobs are based in North Charleston, 2.3 for every working resident, so most of the people who work here commute in.
About one in 3 of North Charleston’s working residents works in town. Since 2013, North Charleston has added 22,762 jobs, to 105,850 in 2023. 14% of residents live below the poverty line in North Charleston.
| North Charleston | South Carolina towns | U.S. towns | |
|---|---|---|---|
| Below the poverty line | 14% | 17% | 9.6% |
| Median household income | $63,000 | $57,000 | $80,000 |
| Work from home | 9.7% | 8.6% | 11% |
Census LEHD 2023 · ACS
FEMA rates its natural-hazard risk higher than 90% of South Carolina towns, with expected losses of about $1,145 per resident a year; that rating is what its D− for hazard risk is built on. 420 flood insurance claims have been filed here, and 97 properties have flooded more than once.
Since 1979, 420 flood insurance claims have been paid out in North Charleston.
FEMA flood insurance claims · FEMA National Risk Index · OpenFEMA
North Charleston has mild winters and warm summers, with plenty of rain. July afternoons reach 92°, January nights drop to 38° and snow is almost unheard of.
NOAA U.S. Climate Normals, 1991–2020
Only 49.8% of households own their home, against 71.9% across South Carolina.
13% of North Charleston residents are 65 or older. North Charleston has grown 12% since 2020, to 129,245 residents in the Census Bureau’s 2025 estimate. 29% of adults 25 and older have a bachelor’s degree or more, vs 32% across South Carolina.
| North Charleston | South Carolina towns | U.S. towns | |
|---|---|---|---|
| Median age | 34.6 years | 38.9 years | 40.5 years |
| Aged 65 or older | 13% | 17% | 18% |
| Bachelor’s degree or more, 25+ | 29% | 23% | 29% |
50% women, 50% men
That’s an even split within the survey’s margin of ±1.2 points. Across South Carolina, 51.3% of residents are women. Median age: women 35.9, men 33.0.
| North Charleston | SC | U.S. | |
|---|---|---|---|
| Under 10 | 12.1% | 11.4% | 11.6% |
| 10 to 17 | 9.8% | 10.1% | 10.3% |
| 18 to 24 | 10.3% | 9.1% | 9.1% |
| 25 to 34 | 18.3% | 12.8% | 13.7% |
| 35 to 44 | 14.6% | 12.5% | 13.2% |
| 45 to 54 | 10.9% | 12% | 12.2% |
| 55 to 64 | 11.4% | 13.2% | 12.7% |
| 65 to 74 | 7.9% | 11.4% | 10.2% |
| 75 and older | 4.5% | 7.4% | 7% |
| No diploma | 11.3% | 9.9% | 10.4% |
| High school | 26.8% | 28.2% | 26% |
| Some college | 22.7% | 19.8% | 19.1% |
| Associate’s | 10.6% | 10% | 8.8% |
| Bachelor’s | 18% | 19.8% | 21.6% |
| Graduate | 10.6% | 12.3% | 14.1% |
Census population estimates, 2025 · U.S. Census Bureau · ACS 2020-2024 5-year estimates
Against the 9,580 U.S. towns with household incomes like North Charleston’s, it is healthier than 68%, so its B− isn’t only a matter of income.
North Charleston beats the South Carolina average on 6 of 32 CDC measures and trails it on 12. Only 6 of the 169 South Carolina towns we compare have a higher share of adults who binge drink than North Charleston.
| North Charleston | South Carolina towns | U.S. towns | |
|---|---|---|---|
| Binge drink (CDC PLACES) | 20% | 15% | 16% |
| No health insurance, 18–64 (CDC PLACES) | 15% | 13% | 8.1% |
| Food insecurity (CDC PLACES) | 24% | 21% | 14% |
| High blood pressure (CDC PLACES) | 33% | 40% | 35% |
| What stands out | North Charleston | SC |
|---|---|---|
| Fewer adults who have had cancer | 5.8% | 8.6% |
| Fewer adults with heart disease | 5.4% | 6.8% |
| More adults facing a utility shut-off | 12.5% | 8.9% |
CDC PLACES 2025 · modeled estimates for adults · CMS · HRSA
The typical North Charleston home is worth about $309,000, down 1.3% in a year, close to the South Carolina typical home.
| North Charleston | South Carolina towns | U.S. towns | |
|---|---|---|---|
| Households that own their home | 50% | 65% | 73% |
| Median rent | $1,430 a month | $1,058 a month | $1,185 a month |
| Renters paying 30%+ of income on rent | 55% | 52% | 48% |
Zillow Home Value Index · Redfin Data Center
7 within 15 miles of the center of North Charleston
About 7 of every 100 North Charleston residents are enrolled in college, about the same as South Carolina.
2 colleges in town.
8 places in North Charleston on the National Register of Historic Places.
9 notable people were born in North Charleston.


City in South Carolina, United States
North Charleston is a city in Berkeley, Charleston, and Dorchester counties in the U.S. state of South Carolina. As of the 2020 census, North Charleston had a population of 114,852, making it the third-most populous city in the state, and the 248th-most populous city in the United States. North Charleston is a principal city within the Charleston-North Charleston, SC Metropolitan Statistical Area, which had an estimated population of 849,417 in 2023.
From Wikipedia, licensed CC BY-SA 4.0 · facts via Wikidata (CC0)
5 towns share a border with North Charleston.
All 5 graded towns on its borders grade higher than its C; Summerville (C+) is closest.
| Town | SC rank | Overall | Cost | Safety | Schools | Health |
|---|---|---|---|---|---|---|
| North Charleston | #106 | C | C+ | D− | A | B− |
| Charleston | #57 | B− | C− | C− | B+ | A |
| Ladson | #63 | B− | B− | — | B+ | C+ |
| Summerville | #73 | C+ | C | — | B+ | B− |
| Hanahan | #64 | B− | C+ | B− | B− | B |
| Goose Creek | #53 | B− | C+ | C+ | B− | B+ |
Ladson and Summerville report no FBI crime data of their own. Compare North Charleston with a neighbor →
Short answers, built from the data on this page.
North Charleston grades C overall, better than 28% of U.S. towns and #106 of 167 in South Carolina. It grades B− for health, D− for safety and A for schools. Hazard risk is its weak spot, with a D−.
Within South Carolina, it does better than 27% of towns.
That is 3.6 years of the area's median household income ($85,254 across the Charleston-North Charleston, SC metro area). Cost of living, which also weighs rents, property taxes and how many households pay 30% or more of their income for housing, grades C+.
9 notable people were born here, including Carlos Dunlap and Mendel Jackson Davis.