Guest, Sign inJoin
Spearman Texas Oct 2015 City HallSpearman, #1 on this list · Photo: Barbara Brannon · CC BY 2.0
Texas rankings · Safety

Safest towns in Texas

Spearman reports the least crime per resident of Texas’ 471 towns with crime figures for 2023–2025; 60 of the 471 grade A− or better on safety nationally.

Crimes reported by each town’s own police, 2023–2025, per 1,000 residents, violent crimes counted four times. The same measure as the Safety grade. For 5 of them one year isn’t in the FBI’s published tables and comes from the FBI Crime Data Explorer or the state’s own reports (named in the row). How grades work

#1

Spearman

Hansford County · 2,956 people
A+

0.00 weighted crimes per 1,000 a year·violent 0.0, property 0.0

#2

Friona

Parmer County · 4,051 people
A+

2.90 weighted crimes per 1,000 a year·violent 0.7, property 0.2
#3

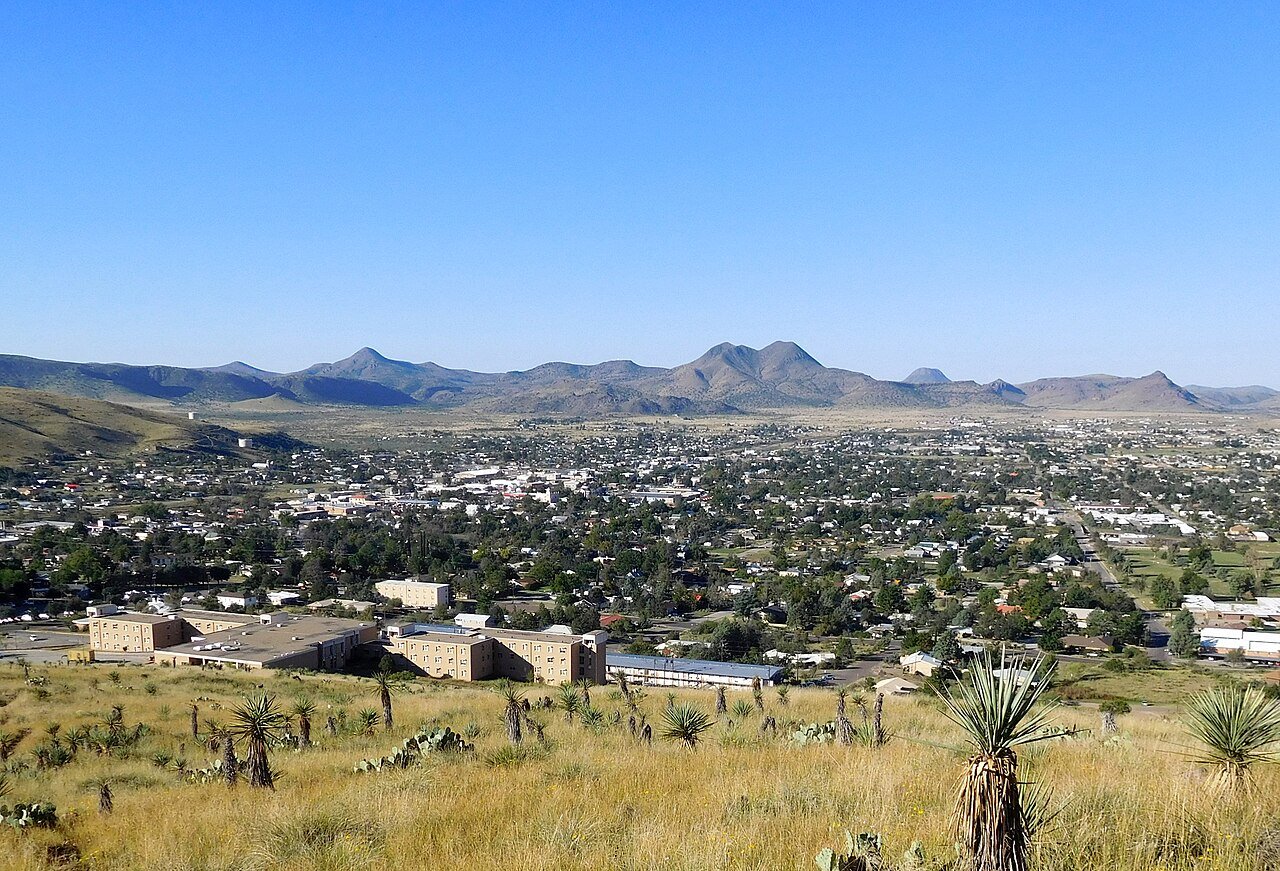
Alpine

Brewster County · 5,989 people
A+

3.62 weighted crimes per 1,000 a year·violent 0.8, property 0.5

All 471 towns

Weighted crimes per 1,000 residents a year, lowest first, to two decimals (the sort uses the exact rate, so there are no rounding ties). Grade = the national Safety grade.

471 towns ranked. Not here? See towns without their own figures.

#TownWeighted rateViolentPropertyGrade
1SpearmanHansford County · 2,956 people0.000.00.0A+
2FrionaParmer County · 4,051 people2.900.70.2A+
3AlpineBrewster County · 5,989 people3.620.80.5A+
4DublinErath County · 3,400 people3.660.71.0A+
5GunterGrayson County · 2,574 people4.230.33.2A
6Trophy ClubDenton County · 13,695 people4.300.23.5A
7Double OakDenton County · 3,051 people · 2024 from the FBI Crime Data Explorer4.340.33.0A
8PonderDenton County · 2,863 people4.350.52.5A
9HoweGrayson County · 3,686 people4.580.43.2A
10HallsvilleHarrison County · 4,895 people4.840.43.2A
11FulshearFort Bend County · 64,630 people4.900.43.3A
12OvillaEllis County · 4,808 people5.080.43.4A
13BullardSmith County · 5,301 people5.320.53.5A
14ParkerCollin County · 6,462 people5.320.53.3A
15MelissaCollin County · 29,969 people5.420.43.8A
16AbernathyHale County · 2,826 people5.701.11.4A
17PalmerEllis County · 2,644 people6.150.54.1A
18ChandlerHenderson County · 4,081 people6.290.44.5A
19CliftonBosque County · 3,523 people6.301.02.2A
20HaskellHaskell County · 3,095 people6.660.44.9A
21Rancho ViejoCameron County · 2,851 people6.750.83.5A
22ColleyvilleTarrant County · 25,727 people6.800.45.1A
23Caddo MillsHunt County · 5,715 people7.141.03.0A−
24HeathRockwall County · 11,671 people7.150.74.2A−
25Fair Oaks RanchBexar County · 12,025 people7.260.26.6A−
26MurphyCollin County · 20,985 people7.290.55.3A−
27FateRockwall County · 29,007 people7.320.83.9A−
28WinnsboroWood County · 3,678 people · 2024 from the FBI Crime Data Explorer7.460.93.8A−
29JunctionKimble County · 2,513 people7.621.32.4A−
30SeymourBaylor County · 2,574 people7.711.42.1A−
31WhitehouseSmith County · 9,970 people7.980.94.5A−
32Laguna VistaCameron County · 3,780 people8.060.56.0A−
33GodleyJohnson County · 5,093 people8.110.84.7A−
34Van AlstyneGrayson County · 8,012 people8.160.75.4A−
35San SabaSan Saba County · 3,126 people8.171.23.3A−
36DimmittCastro County · 4,069 people8.241.33.0A−
37ArgyleDenton County · 6,372 people8.241.04.3A−
38MuleshoeBailey County · 5,162 people8.371.23.6A−
39Flower MoundDenton County · 79,540 people8.380.66.1A−
40BoydWise County · 2,546 people8.401.23.7A−
41CraneCrane County · 3,303 people8.531.62.1A−
42NeedvilleFort Bend County · 3,114 people8.680.85.7A−
43FriendswoodGalveston County · 41,319 people8.930.95.5A−
44Iowa ParkWichita County · 6,542 people9.151.14.7A−
45MagnoliaMontgomery County · 8,095 people9.370.95.7A−
46LumbertonHardin County · 14,123 people9.400.86.1A−
47SachseDallas County · 32,834 people9.480.67.0A−
48WestMcLennan County · 2,629 people9.501.43.8A−
49KellerTarrant County · 46,078 people9.530.76.6A−
50Iowa ColonyBrazoria County · 20,503 people9.540.96.0A−
51OlneyYoung County · 3,000 people9.601.63.4A−
52Fort StocktonPecos County · 8,027 people9.621.63.2A−
53BurnetBurnet County · 6,939 people9.661.05.6A−
54CorinthDenton County · 25,297 people9.790.67.2A−
55StamfordJones County · 2,963 people9.821.05.8A−
56Horseshoe BayLlano County · 5,339 people9.850.77.1A−
57VenusJohnson County · 8,870 people9.861.54.0A−
58JacksboroJack County · 4,735 people9.901.63.6A−
59CanyonRandall County · 16,518 people9.961.06.1A−
60JarrellWilliamson County · 5,870 people9.980.77.1A−
61FredericksburgGillespie County · 11,893 people10.140.87.0B+
62Pilot PointDenton County · 8,052 people10.170.86.8B+
63Lago VistaTravis County · 10,498 people10.171.44.6B+
64LeanderWilliamson County · 91,132 people10.210.67.6B+
65ChildressChildress County · 5,650 people10.241.44.7B+
66WylieCollin County · 63,842 people10.260.77.3B+
67Lake DallasDenton County · 7,852 people10.361.25.7B+
68Horizon CityEl Paso County · 25,118 people10.390.96.9B+
69KermitWinkler County · 6,019 people10.411.44.7B+
70Little ElmDenton County · 62,727 people10.531.64.2B+
71Bridge CityOrange County · 9,645 people10.601.45.0B+
72JoshuaJohnson County · 9,352 people10.621.06.7B+
73SouthlakeTarrant County · 31,175 people10.660.49.2B+
74FairviewCollin County · 10,913 people10.900.58.7B+
75Santa FeGalveston County · 13,913 people11.031.26.2B+
76Karnes CityKarnes County · 3,540 people11.061.26.2B+
77Highland VillageDenton County · 16,029 people11.070.59.2B+
78ProsperCollin County · 45,605 people11.070.59.2B+
79Garden RidgeComal County · 4,371 people11.180.78.5B+
80HuttoWilliamson County · 46,048 people11.210.78.5B+
81RobinsonMcLennan County · 13,028 people11.231.26.5B+
82WhitesboroGrayson County · 4,188 people11.351.65.1B+
83ColemanColeman County · 3,991 people11.361.17.0B+
84KeeneJohnson County · 7,109 people11.451.45.9B+
85CelinaCollin County · 64,427 people11.480.88.2B+
86WolfforthLubbock County · 8,746 people11.491.84.2B+
87HelotesBexar County · 10,387 people11.560.310.4B+
88DilleyFrio County · 3,809 people11.571.55.6B+
89RichwoodBrazoria County · 4,777 people11.611.36.3B+
90CaldwellBurleson County · 4,970 people11.791.55.6B+
91AllenCollin County · 113,447 people11.901.08.0B+
92ManvelBrazoria County · 20,699 people11.980.88.6B+
93VanVan Zandt County · 2,993 people12.110.98.5B+
94White OakGregg County · 6,186 people12.191.08.1B+
95ForneyKaufman County · 41,658 people12.241.46.7B+
96Hickory CreekDenton County · 6,875 people12.281.08.4B+
97McKinneyCollin County · 236,001 people12.471.17.9B+
98CoppellDallas County · 41,386 people12.570.99.0B+
99CiscoEastland County · 3,980 people12.661.28.0B+
100Liberty HillWilliamson County · 13,317 people12.661.37.4B+
101Denver CityYoakum County · 4,311 people12.711.75.8B+
102West University PlaceHarris County · 15,158 people12.830.610.6B+
103PenitasHidalgo County · 6,495 people12.891.08.9B+
104SangerDenton County · 10,238 people12.971.09.1B+
105LakewayTravis County · 19,027 people13.140.710.4B+
106KennedaleTarrant County · 10,626 people13.281.86.2B
107Sulphur SpringsHopkins County · 17,054 people13.391.48.0B
108ShallowaterLubbock County · 2,957 people13.502.53.5B
109Prairie View College campusWaller County · 8,969 people13.671.67.2B
110CiboloGuadalupe County · 39,019 people13.691.57.6B
111LlanoLlano County · 3,587 people13.701.38.5B
112KerrvilleKerr County · 25,578 people13.711.86.6B
113Mount VernonFranklin County · 2,610 people13.772.15.5B
114NashBowie County · 4,269 people · 2024 from the FBI Crime Data Explorer13.802.05.8B
115JosephineCollin County · 10,208 people13.861.67.6B
116MidlothianEllis County · 46,683 people13.901.19.6B
117Shavano ParkBexar County · 3,861 people13.940.511.8B
118GrahamYoung County · 8,814 people14.071.48.5B
119FriscoCollin County · 236,955 people14.160.910.4B
120TaftSan Patricio County · 2,939 people14.181.67.8B
121Grand SalineVan Zandt County · 3,319 people14.322.15.8B
122ClydeCallahan County · 4,024 people14.391.48.8B
123Royse CityRockwall County · 28,307 people14.501.39.4B
124PerrytonOchiltree County · 7,850 people14.602.83.2B
125BridgeportWise County · 6,915 people14.631.77.9B
126GatesvilleCoryell County · 16,422 people14.681.58.7B
127Wake VillageBowie County · 5,796 people14.761.58.8B
128AnnaCollin County · 35,245 people14.841.87.4B
129League CityGalveston County · 119,905 people15.060.911.5B
130BurkburnettWichita County · 11,057 people15.082.26.2B
131SilsbeeHardin County · 6,613 people15.092.16.8B
132Wills PointVan Zandt County · 4,033 people15.242.36.1B
133BoerneKendall County · 24,047 people15.281.011.3B
134University ParkDallas County · 25,323 people15.400.513.6B
135DalhartDallam County · 8,377 people15.462.07.7B
136FalfurriasBrooks County · 4,248 people15.482.84.4B
137Willow ParkParker County · 7,439 people15.661.78.9B
138YoakumLavaca County · 5,900 people15.682.07.7B
139BradyMcCulloch County · 4,980 people15.731.79.0B
140WataugaTarrant County · 22,981 people15.741.310.6B
141SocorroEl Paso County · 38,787 people15.842.17.5B
142Missouri CityFort Bend County · 77,327 people15.851.69.7B
143SchertzGuadalupe County · 45,978 people15.861.78.9B
144SunnyvaleDallas County · 9,008 people15.881.59.7B
145CameronMilam County · 5,489 people15.931.69.4B
146Sugar LandFort Bend County · 107,726 people15.950.813.0B
147PortlandSan Patricio County · 20,833 people15.981.310.8B
148La PorteHarris County · 37,983 people16.071.79.3B
149KyleHays County · 69,917 people16.261.98.6B
150LockhartCaldwell County · 18,159 people16.291.012.3B
151BallingerRunnels County · 3,499 people16.392.27.7B
152SeminoleGaines County · 7,730 people16.412.18.0B
153DenisonGrayson County · 26,822 people16.632.28.0B
154HewittMcLennan County · 16,754 people16.731.411.2B
155PoteetAtascosa County · 3,010 people16.740.315.4B−
156GeorgetownWilliamson County · 106,907 people16.791.610.2B−
157La JoyaHidalgo County · 5,257 people16.892.57.0B−
158RuskCherokee County · 5,568 people16.931.89.9B−
159StephenvilleErath County · 21,793 people16.961.89.9B−
160Galena ParkHarris County · 10,352 people16.991.610.7B−
161Cedar ParkWilliamson County · 79,032 people17.041.013.0B−
162College StationBrazos County · 127,472 people17.041.511.0B−
163PearsallFrio County · 9,170 people17.102.28.3B−
164BurlesonJohnson County · 56,907 people17.121.710.2B−
165NorthlakeDenton County · 12,036 people17.151.411.4B−
166SpringtownParker County · 5,204 people17.172.09.3B−
167KaufmanKaufman County · 10,717 people17.181.212.6B−
168RomaStarr County · 11,543 people17.262.38.2B−
169PrincetonCollin County · 43,524 people17.332.57.5B−
170Terrell HillsBexar County · 5,215 people17.340.415.8B−
171HerefordDeaf Smith County · 14,976 people17.391.610.8B−
172SmithvilleBastrop County · 4,367 people17.412.09.6B−
173RockwallRockwall County · 53,980 people17.461.212.6B−
174Glenn HeightsDallas County · 20,327 people17.492.38.2B−
175Harker HeightsBell County · 35,195 people17.621.611.4B−
176MansfieldTarrant County · 84,444 people17.621.113.4B−
177Deer ParkHarris County · 34,282 people17.651.212.7B−
178CombesCameron County · 3,255 people17.741.711.1B−
179Port NechesJefferson County · 13,768 people17.772.57.7B−
T180SealyAustin County · 7,937 people17.781.910.2B−
T180SweenyBrazoria County · 3,594 people17.782.09.9B−
182PearlandBrazoria County · 129,930 people17.880.914.1B−
183HearneRobertson County · 4,719 people17.973.34.9B−
184CarrolltonDenton County · 134,562 people18.041.312.7B−
185DickinsonGalveston County · 21,908 people18.042.010.0B−
186AtlantaCass County · 5,478 people18.102.48.5B−
187RoanokeDenton County · 10,931 people18.421.014.6B−
188DibollAngelina County · 5,125 people18.442.87.3B−
189MissionHidalgo County · 88,992 people18.491.811.5B−
190Colorado CityMitchell County · 3,884 people18.751.712.0B−
191EdnaJackson County · 6,088 people18.753.54.6B−
192Del RioVal Verde County · 34,496 people19.021.512.8B−
193New BraunfelsComal County · 122,492 people19.311.812.2B−
194HidalgoHidalgo County · 15,376 people19.341.513.4B−
195MontgomeryMontgomery County · 3,105 people19.531.115.0B−
196StantonMartin County · 2,694 people19.561.613.0B−
197RowlettDallas County · 67,890 people19.761.812.7B−
198Hollywood ParkBexar County · 3,140 people19.780.617.2B−
199CleburneJohnson County · 39,942 people19.902.310.6B−
200EnnisEllis County · 25,694 people19.972.012.2B−
201JonestownTravis County · 2,687 people20.081.813.1B−
202RefugioRefugio County · 2,752 people20.123.08.1B−
203SeabrookHarris County · 13,974 people20.222.111.9B−
204MadisonvilleMadison County · 4,605 people20.282.79.4B−
205ManorTravis County · 23,070 people20.381.514.4B−
206PlanoCollin County · 293,028 people20.481.514.4B−
207AngletonBrazoria County · 21,295 people20.502.610.2B−
208SeagovilleDallas County · 21,077 people20.511.415.1B−
209FloresvilleWilson County · 9,105 people20.511.713.7B−
210River OaksTarrant County · 7,467 people20.602.311.4B−
211La VillaHidalgo County · 3,257 people20.692.610.2B−
212FarmersvilleCollin County · 5,531 people20.971.514.9C+
213CactusMoore County · 3,165 people20.983.86.0C+
214EdcouchHidalgo County · 2,650 people21.004.24.0C+
215ColumbusColorado County · 3,821 people21.023.18.5C+
216BellvilleAustin County · 4,379 people21.022.89.7C+
217LindaleSmith County · 7,385 people21.051.813.9C+
218LittlefieldLamb County · 5,675 people21.162.411.6C+
219MarlinFalls County · 5,599 people21.203.28.5C+
220GreenvilleHunt County · 37,069 people21.272.212.4C+
221Mont BelvieuChambers County · 10,673 people21.311.814.3C+
222PharrHidalgo County · 80,830 people21.382.312.3C+
223BrazoriaBrazoria County · 2,882 people21.441.814.4C+
224SaginawTarrant County · 26,706 people21.542.411.9C+
225NederlandJefferson County · 18,108 people21.552.511.6C+
226GiddingsLee County · 5,425 people21.742.611.2C+
227Port LavacaCalhoun County · 11,060 people21.773.09.6C+
228AlvinBrazoria County · 30,115 people21.801.814.5C+
229San JuanHidalgo County · 37,868 people21.822.213.2C+
230ElginBastrop County · 13,327 people21.822.113.2C+
231FerrisEllis County · 4,291 people21.833.010.0C+
232DevineMedina County · 4,652 people21.931.615.3C+
233CantonVan Zandt County · 5,070 people22.010.819.0C+
234WaxahachieEllis County · 50,090 people22.042.113.5C+
235TeagueFreestone County · 3,595 people22.162.910.6C+
236Oak Ridge NorthMontgomery County · 2,991 people22.250.620.0C+
237BudaHays County · 16,166 people22.301.217.4C+
238HondoMedina County · 9,130 people22.342.014.4C+
239WeatherfordParker County · 40,634 people22.502.014.6C+
240West ColumbiaBrazoria County · 3,636 people22.692.014.6C+
241Red OakEllis County · 20,394 people22.801.716.0C+
242McAllenHidalgo County · 150,640 people22.921.417.3C+
243PflugervilleTravis County · 68,316 people23.011.815.6C+
244DumasMoore County · 14,862 people23.161.915.7C+
245CastrovilleMedina County · 3,444 people23.221.517.4C+
246Grand PrairieDallas County · 209,434 people23.232.015.1C+
247RichardsonDallas County · 118,542 people23.281.417.8C+
248RosenbergFort Bend County · 42,701 people23.332.214.7C+
249AlvaradoJohnson County · 7,539 people23.373.210.7C+
250Round RockWilliamson County · 141,282 people23.541.318.4C+
251AnthonyEl Paso County · 4,539 people23.632.513.7C+
252Forest HillTarrant County · 14,056 people23.712.115.2C+
253Nassau BayHarris County · 5,210 people23.732.513.6C+
254The ColonyDenton County · 46,196 people23.821.717.1C+
255VidorOrange County · 9,597 people23.862.314.5C+
256LewisvilleDenton County · 139,006 people23.892.115.5C+
257CrockettHouston County · 6,346 people23.942.215.1C+
258TahokaLynn County · 2,533 people24.004.65.7C+
259LavonCollin County · 11,888 people24.132.713.4C+
260AndrewsAndrews County · 13,665 people24.173.211.3C+
261CrowleyTarrant County · 20,954 people24.182.016.1C+
262PleasantonAtascosa County · 11,511 people24.251.518.2C+
263GainesvilleCooke County · 18,528 people24.352.315.3C+
264BulverdeComal County · 7,337 people24.371.717.4C+
265Rio Grande CityStarr County · 15,451 people24.551.618.0C+
266Cedar HillDallas County · 49,801 people24.921.718.1C+
267BedfordTarrant County · 47,958 people24.941.917.4C+
268DaytonLiberty County · 10,226 people25.072.116.7C+
269GladewaterGregg County · 6,306 people25.093.511.2C+
270GroesbeckLimestone County · 3,995 people25.102.714.4C+
271ConroeMontgomery County · 119,564 people25.302.415.6C+
272EvermanTarrant County · 6,537 people25.322.814.1C+
273HallettsvilleLavaca County · 2,736 people25.344.28.4C+
274AzleTarrant County · 15,365 people25.432.515.6C+
275MineolaWood County · 5,537 people25.551.918.0C+
276GrovesJefferson County · 16,907 people25.593.611.3C+
277PalaciosMatagorda County · 4,370 people25.863.312.7C
278MexiaLimestone County · 7,091 people25.974.19.7C
279SintonSan Patricio County · 5,966 people26.002.416.5C
280Eagle PassMaverick County · 28,926 people26.241.819.2C
281BenbrookTarrant County · 24,279 people26.271.918.6C
282PittsburgCamp County · 4,676 people26.284.48.7C
283NacogdochesNacogdoches County · 32,500 people26.382.615.8C
284LulingCaldwell County · 5,920 people26.383.213.8C
285Highland ParkDallas County · 8,764 people26.730.624.1C
286El PasoEl Paso County · 683,012 people26.813.014.8C
287La GrangeFayette County · 4,509 people27.052.915.3C
288Lake JacksonBrazoria County · 27,803 people27.072.716.3C
289Meadows PlaceFort Bend County · 4,546 people27.070.823.9C
290EulessTarrant County · 60,008 people27.111.819.8C
291BreckenridgeStephens County · 5,123 people27.173.314.0C
292Copperas CoveCoryell County · 40,118 people27.203.314.0C
293HillsboroHill County · 9,036 people27.242.119.0C
294TaylorWilliamson County · 18,402 people27.262.417.6C
295BrownfieldTerry County · 8,762 people27.383.812.4C
296DentonDenton County · 169,431 people27.402.218.8C
297Alamo HeightsBexar County · 7,632 people27.430.824.3C
298Sullivan CityHidalgo County · 3,891 people · 2024 from the FBI Crime Data Explorer27.445.07.6C
299KingsvilleKleberg County · 24,687 people27.492.517.4C
300GrapevineTarrant County · 50,714 people27.551.720.6C
301AubreyDenton County · 9,066 people27.723.115.4C
302Gun Barrel CityHenderson County · 7,133 people27.731.521.6C
303LaredoWebb County · 269,515 people27.883.713.2C
304EastlandEastland County · 3,737 people27.902.916.4C
305BrookshireWaller County · 6,090 people27.923.912.2C
306DecaturWise County · 9,029 people27.951.721.3C
307ComancheComanche County · 4,420 people28.143.315.0C
308LamesaDawson County · 8,103 people28.284.111.7C
309LytleAtascosa County · 3,626 people28.290.526.3C
310EdinburgHidalgo County · 110,700 people28.382.618.0C
311PalmviewHidalgo County · 15,878 people28.573.813.3C
312North Richland HillsTarrant County · 70,843 people28.601.920.9C
313GarlandDallas County · 249,625 people28.712.220.1C
314BryanBrazos County · 91,996 people · 2023 from the FBI Crime Data Explorer28.893.714.1C
315BowieMontague County · 6,113 people28.922.618.6C
316OdessaEctor County · 122,707 people29.013.315.8C
317JacksonvilleCherokee County · 14,658 people29.043.216.0C
318LevellandHockley County · 12,513 people29.284.710.4C
319MathisSan Patricio County · 4,312 people29.413.714.7C
320TerrellKaufman County · 23,921 people29.473.117.1C
321DeSotoDallas County · 56,681 people29.713.017.6C
322SeguinGuadalupe County · 41,048 people29.733.217.0C
323CluteBrazoria County · 10,821 people29.842.818.6C
324WallerWaller County · 5,380 people29.993.117.6C
325Bee CaveTravis County · 8,464 people29.991.623.7C
326Cockrell HillDallas County · 3,638 people30.022.619.8C
327EarlyBrown County · 3,117 people30.244.811.2C
328MonahansWard County · 7,427 people30.243.616.1C
329BellaireHarris County · 17,434 people30.261.524.2C
330Jacinto CityHarris County · 9,388 people30.350.926.6C
331TuliaSwisher County · 4,242 people30.353.815.4C
332OrangeOrange County · 19,419 people30.454.512.3C
333HitchcockGalveston County · 7,722 people30.483.715.7C
334Aransas PassSan Patricio County · 8,842 people30.793.218.2C
335HempsteadWaller County · 7,194 people30.814.015.0C
336RockportAransas County · 11,348 people30.863.118.6C
337ShermanGrayson County · 52,417 people30.943.616.8C
338AthensHenderson County · 13,870 people30.963.915.3C
339VernonWilbarger County · 9,747 people31.023.816.0C
340La FeriaCameron County · 7,222 people31.023.716.1C
341SelmaBexar County · 11,955 people31.112.122.6C
342CommerceHunt County · 9,928 people31.364.513.4C
343OnalaskaPolk County · 3,289 people31.534.314.3C
344Mount PleasantTitus County · 16,225 people31.573.318.2C
345FairfieldFreestone County · 3,029 people31.624.712.9C
346RichmondFort Bend County · 13,389 people31.833.019.8C
347SweetwaterNolan County · 10,141 people31.885.011.7C
348HurstTarrant County · 38,974 people31.912.621.7C
349Lacy-LakeviewMcLennan County · 7,240 people31.944.314.6C
350RockdaleMilam County · 5,688 people32.075.510.0C
351LibertyLiberty County · 9,133 people32.123.319.0C−
352Texas CityGalveston County · 59,733 people32.203.219.3C−
353MidlandMidland County · 147,615 people32.283.817.0C−
354ConverseBexar County · 32,481 people32.494.215.9C−
355IrvingDallas County · 257,076 people32.542.821.3C−
356West Lake HillsTravis County · 3,229 people32.690.829.3C−
357KilgoreGregg County · 13,531 people32.752.821.6C−
358PalestineAnderson County · 19,555 people32.844.415.1C−
359Farmers BranchDallas County · 38,320 people32.971.825.8C−
360WhartonWharton County · 8,776 people33.393.519.4C−
361UvaldeUvalde County · 15,455 people33.533.818.6C−
362West OrangeOrange County · 3,391 people33.542.424.1C−
363BrenhamWashington County · 19,957 people33.743.918.1C−
364AbileneTaylor County · 131,588 people33.984.316.9C−
T365KenedyKarnes County · 3,305 people34.052.424.6C−
T365Marble FallsBurnet County · 9,633 people34.053.719.2C−
367TomballHarris County · 15,768 people34.103.320.9C−
368Haltom CityTarrant County · 45,542 people34.213.221.5C−
369White SettlementTarrant County · 17,932 people34.444.018.6C−
370DuncanvilleDallas County · 38,915 people34.523.221.9C−
371San AngeloTom Green County · 100,640 people34.702.624.3C−
372MarshallHarrison County · 24,467 people34.734.516.7C−
373Universal CityBexar County · 20,399 people34.772.524.9C−
374VictoriaVictoria County · 66,500 people34.803.720.0C−
375BrownsvilleCameron County · 192,957 people34.944.218.3C−
376WilmerDallas County · 6,768 people35.043.321.8C−
377TylerSmith County · 113,723 people35.414.019.6C−
378FreeportBrazoria County · 10,508 people35.445.314.3C−
379HuntsvilleWalker County · 49,088 people35.775.115.2C−
380KilleenBell County · 161,883 people35.875.015.8C−
381GilmerUpshur County · 5,287 people36.153.422.6C−
382PlainviewHale County · 19,314 people36.364.418.6C−
383HarlingenCameron County · 72,467 people36.492.725.8C−
384Richland HillsTarrant County · 8,529 people36.523.024.4C−
385SchulenburgFayette County · 2,837 people36.606.510.6C−
386Hudson OaksParker County · 2,800 people36.782.228.0C−
387SlatonLubbock County · 5,684 people36.985.813.6C−
388BorgerHutchinson County · 11,842 people37.395.017.4C−
389Jersey VillageHarris County · 7,729 people37.532.428.1C−
390San MarcosHays County · 77,830 people37.784.121.5C−
391LongviewGregg County · 83,236 people37.943.723.2C−
392Sansom ParkTarrant County · 5,419 people38.094.819.1C−
393WillisMontgomery County · 7,652 people38.303.723.4C−
394InglesideSan Patricio County · 10,085 people38.384.719.4C−
395PampaGray County · 16,414 people38.555.217.9C−
396BeevilleBee County · 13,086 people38.673.923.0C−
397San BenitoCameron County · 24,980 people38.962.628.6C−
398CarthagePanola County · 6,640 people39.234.919.5C−
399KatyHarris County · 28,373 people39.311.931.8C−
400Mineral WellsPalo Pinto County · 15,983 people39.513.027.7C−
401WacoMcLennan County · 147,788 people39.784.521.8C−
402Wichita FallsWichita County · 101,951 people40.154.024.2C−
403La MarqueGalveston County · 20,324 people40.364.821.0C−
404El CampoWharton County · 12,142 people40.515.120.1C−
405CorsicanaNavarro County · 25,487 people41.064.722.4C−
406GranburyHood County · 13,263 people41.151.933.7C−
407Port IsabelCameron County · 5,302 people41.323.029.2C−
408RobstownNueces County · 10,324 people41.424.025.6C−
409JasperJasper County · 7,511 people41.453.726.7C−
410BrownwoodBrown County · 18,635 people41.464.324.2C−
411ArlingtonTarrant County · 402,134 people41.474.623.2C−
412LampasasLampasas County · 7,988 people41.514.224.5C−
413KemahGalveston County · 3,097 people42.223.329.1D
414ElsaHidalgo County · 5,820 people42.373.727.7D
415Fort WorthTarrant County · 1,028,117 people42.654.425.1D
416AltonHidalgo County · 24,138 people43.058.39.8D
417Port ArthurJefferson County · 55,804 people43.427.015.4D
418RaymondvilleWillacy County · 10,082 people43.756.119.2D
419GalvestonGalveston County · 53,636 people43.785.223.1D
420BellmeadMcLennan County · 10,592 people44.103.629.6D
421LancasterDallas County · 40,526 people44.284.227.5D
422LufkinAngelina County · 34,350 people44.305.223.3D
423PasadenaHarris County · 148,539 people44.525.422.9D
424Bay CityMatagorda County · 17,488 people44.545.024.6D
425CenterShelby County · 5,246 people44.555.721.8D
426HendersonRusk County · 13,496 people44.754.626.4D
427BaytownHarris County · 86,561 people44.874.228.3D
428MercedesHidalgo County · 17,915 people45.104.327.8D
429DaingerfieldMorris County · 2,539 people45.375.623.2D
430Los FresnosCameron County · 8,703 people45.467.614.9D
431Live OakBexar County · 16,426 people45.551.938.0D
432ParisLamar County · 25,205 people46.105.524.2D
433Balch SpringsDallas County · 27,258 people46.264.328.9D
434South HoustonHarris County · 16,407 people46.365.922.8D
435KirbyBexar County · 8,211 people46.628.114.2D
436TexarkanaBowie County · 36,195 people46.665.126.2D
437SnyderScurry County · 11,166 people46.938.513.1D
438StaffordFort Bend County · 18,043 people47.674.031.7D
440CueroDeWitt County · 8,264 people48.418.614.2D
441MesquiteDallas County · 150,693 people48.964.929.4D
442WeslacoHidalgo County · 44,203 people49.354.033.6D
443AliceJim Wells County · 17,550 people49.515.626.9D
444BastropBastrop County · 13,383 people49.854.531.8D
445AustinTravis County · 1,002,632 people50.484.632.0D
446AmarilloRandall County · 205,130 people53.346.627.2D
447HutchinsDallas County · 8,206 people54.974.835.8D
448New BostonBowie County · 4,560 people55.215.632.8D
449Big SpringHoward County · 22,290 people55.897.824.6D
450Castle HillsBexar County · 3,948 people57.284.439.9D
451LivingstonPolk County · 5,386 people57.765.037.9D
452LubbockLubbock County · 273,071 people58.017.827.0D
453DallasDallas County · 1,329,491 people60.136.334.8D
454Corpus ChristiNueces County · 317,247 people63.338.429.8D
455CrandallKaufman County · 7,730 people63.629.425.9D
456AlamoHidalgo County · 20,625 people63.827.135.4D
457Port AransasNueces County · 3,773 people68.965.048.8D−
458San AntonioBexar County · 1,548,422 people70.486.046.3D−
459ShenandoahMontgomery County · 3,833 people71.152.959.4D−
460AddisonDallas County · 17,195 people71.233.856.0D−
461Leon ValleyBexar County · 11,563 people72.554.654.0D−
462GonzalesGonzales County · 7,239 people72.7514.116.4D−
463WebsterHarris County · 12,507 people76.304.956.6D−
464BeaumontJefferson County · 112,967 people77.9011.531.9D−
465PalmhurstHidalgo County · 2,562 people79.991.275.4D−
466HoustonHarris County · 2,397,315 people83.5610.442.0D−
467Lake WorthTarrant County · 4,766 people98.824.979.2D−
468WindcrestBexar County · 5,809 people105.202.794.3D−
469DonnaHidalgo County · 16,698 people109.6117.141.1D−
470HumbleHarris County · 16,484 people133.039.196.8D−
471Balcones HeightsBexar County · 2,728 people186.0117.4116.6D−

Per 1,000 residents a year, 2023–2025. Last on the list: Balcones Heights, 186.01. The rate counts crimes reported to police, not how safe any one street feels.

Not ranked

171 towns without figures of their own

These towns of 2,500+ are not on the list because there are no police figures for them alone for all of 2023–2025, from the FBI or the state. In 2025 the FBI’s tables list State Police figures for 0 of Texas’ counties and county sheriff figures for 235; those cover many towns at once and can’t be split by town, so they aren’t ranked here. Their other grades stand; the overall grade uses the rest.

  • Agua Dulce El Paso County · 2,697 people: no figures of its own in the FBI’s tables for 2023–2025.
  • Aldine Harris County · 17,167 people: no figures of its own in the FBI’s tables for 2023–2025.
  • Aledo Parker County · 7,122 people: no figures of its own in the FBI’s tables for 2023–2025.
  • Annetta Parker County · 3,546 people: no figures of its own in the FBI’s tables for 2023–2025.
  • Anson Jones County · 2,570 people: figures for 2024 and 2025 only (all three years are needed).
  • Atascocita Harris County · 99,354 people: no figures of its own in the FBI’s tables for 2023–2025.
  • Bacliff Galveston County · 9,541 people: no figures of its own in the FBI’s tables for 2023–2025.
  • Barrett Harris County · 3,273 people: no figures of its own in the FBI’s tables for 2023–2025.
  • Barton Creek Travis County · 3,440 people: no figures of its own in the FBI’s tables for 2023–2025.
  • Beach City Chambers County · 3,438 people: no figures of its own in the FBI’s tables for 2023–2025.
  • Belterra Hays County · 6,978 people: no figures of its own in the FBI’s tables for 2023–2025.
  • Belton Bell County · 25,964 people: figures for 2023 and 2024 only (all three years are needed).
  • Big Lake Reagan County · 2,783 people: no figures of its own in the FBI’s tables for 2023–2025.
  • Bishop Nueces County · 3,040 people: figures for 2024 and 2025 only (all three years are needed).
  • Bolivar Peninsula Galveston County · 2,951 people: no figures of its own in the FBI’s tables for 2023–2025.
  • Bonham Fannin County · 11,263 people: figures for 2024 and 2025 only (all three years are needed).
  • Briar Parker County · 7,228 people: no figures of its own in the FBI’s tables for 2023–2025.
  • Brushy Creek Williamson County · 19,576 people: no figures of its own in the FBI’s tables for 2023–2025.
  • Bunker Hill Village Harris County · 3,896 people: no figures of its own in the FBI’s tables for 2023–2025.
  • Bushland Potter County · 2,779 people: no figures of its own in the FBI’s tables for 2023–2025.
  • Cameron Park Cameron County · 5,955 people: no figures of its own in the FBI’s tables for 2023–2025.
  • Camp Swift Bastrop County · 8,239 people: no figures of its own in the FBI’s tables for 2023–2025.
  • Canutillo El Paso County · 5,962 people: no figures of its own in the FBI’s tables for 2023–2025.
  • Canyon Lake Comal County · 33,883 people: no figures of its own in the FBI’s tables for 2023–2025.
  • Carrizo Springs Dimmit County · 4,491 people: figures for 2025 only (all three years are needed).
  • Cedar Creek Bastrop County · 4,440 people: no figures of its own in the FBI’s tables for 2023–2025.
  • Central Gardens Jefferson County · 3,976 people: no figures of its own in the FBI’s tables for 2023–2025.
  • Channelview Harris County · 43,605 people: no figures of its own in the FBI’s tables for 2023–2025.
  • Chula Vista Maverick County · 4,746 people: no figures of its own in the FBI’s tables for 2023–2025.
  • Cinco Ranch Fort Bend County · 18,611 people: no figures of its own in the FBI’s tables for 2023–2025.
  • Circle D-KC Estates Bastrop County · 3,135 people: no figures of its own in the FBI’s tables for 2023–2025.
  • Clarksville Red River County · 2,908 people: figures for 2024 and 2025 only (all three years are needed).
  • Cleveland Liberty County · 9,936 people: figures for 2024 and 2025 only (all three years are needed).
  • Cloverleaf Harris County · 24,063 people: no figures of its own in the FBI’s tables for 2023–2025.
  • Combine Kaufman County · 2,769 people: no figures of its own in the FBI’s tables for 2023–2025.
  • Cotulla La Salle County · 3,583 people: no figures of its own in the FBI’s tables for 2023–2025.
  • Crosby Harris County · 4,617 people: no figures of its own in the FBI’s tables for 2023–2025.
  • Cross Mountain Bexar County · 3,752 people: no figures of its own in the FBI’s tables for 2023–2025.
  • Crystal City Zavala County · 5,871 people: figures for 2023 and 2024 only (all three years are needed).
  • Cumings Fort Bend County · 2,535 people: no figures of its own in the FBI’s tables for 2023–2025.
  • DeCordova Hood County · 3,296 people: no figures of its own in the FBI’s tables for 2023–2025.
  • Doffing Hidalgo County · 5,004 people: no figures of its own in the FBI’s tables for 2023–2025.
  • Doolittle Hidalgo County · 6,203 people: no figures of its own in the FBI’s tables for 2023–2025.
  • Dripping Springs Hays County · 11,167 people: no figures of its own in the FBI’s tables for 2023–2025.
  • Eagle Lake Colorado County · 3,546 people: figures for 2024 and 2025 only (all three years are needed).
  • Edgecliff Village Tarrant County · 3,759 people: no figures of its own in the FBI’s tables for 2023–2025.
  • Eidson Road Maverick County · 9,684 people: no figures of its own in the FBI’s tables for 2023–2025.
  • El Lago Harris County · 2,984 people: no figures of its own in the FBI’s tables for 2023–2025.
  • Elm Creek Maverick County · 3,680 people: no figures of its own in the FBI’s tables for 2023–2025.
  • Elmendorf Bexar County · 3,111 people: figures for 2024 and 2025 only (all three years are needed).
  • Encantada-Ranchito-El Calaboz Cameron County · 2,552 people: no figures of its own in the FBI’s tables for 2023–2025.
  • Escobares Starr County · 2,585 people: no figures of its own in the FBI’s tables for 2023–2025.
  • Fabens El Paso County · 4,818 people: no figures of its own in the FBI’s tables for 2023–2025.
  • Fort Bliss El Paso County · 11,460 people: no figures of its own in the FBI’s tables for 2023–2025.
  • Four Corners Fort Bend County · 11,692 people: no figures of its own in the FBI’s tables for 2023–2025.
  • Fresno Fort Bend County · 24,560 people: no figures of its own in the FBI’s tables for 2023–2025.
  • Glen Rose Somervell County · 3,148 people: no figures of its own in the FBI’s tables for 2023–2025.
  • Granite Shoals Burnet County · 5,498 people: figures for 2024 and 2025 only (all three years are needed).
  • Grape Creek Tom Green County · 4,036 people: no figures of its own in the FBI’s tables for 2023–2025.
  • Hackberry Denton County · 2,954 people: no figures of its own in the FBI’s tables for 2023–2025.
  • Hamilton Hamilton County · 3,016 people: figures for 2023 only (all three years are needed).
  • Haslet Tarrant County · 5,267 people: no figures of its own in the FBI’s tables for 2023–2025.
  • Heartland Kaufman County · 10,607 people: no figures of its own in the FBI’s tables for 2023–2025.
  • Hebbronville Jim Hogg County · 4,194 people: no figures of its own in the FBI’s tables for 2023–2025.
  • Henrietta Clay County · 3,258 people: no figures of its own in the FBI’s tables for 2023–2025.
  • Hideaway Smith County · 3,459 people: no figures of its own in the FBI’s tables for 2023–2025.
  • Highlands Harris County · 6,335 people: no figures of its own in the FBI’s tables for 2023–2025.
  • Holly Lake Ranch Wood County · 2,956 people: no figures of its own in the FBI’s tables for 2023–2025.
  • Homestead Meadows North El Paso County · 5,795 people: no figures of its own in the FBI’s tables for 2023–2025.
  • Homestead Meadows South El Paso County · 6,660 people: no figures of its own in the FBI’s tables for 2023–2025.
  • Hornsby Bend Travis County · 12,367 people: no figures of its own in the FBI’s tables for 2023–2025.
  • Hudson Angelina County · 5,328 people: figures for 2024 only (all three years are needed).
  • Hudson Bend Travis County · 4,127 people: no figures of its own in the FBI’s tables for 2023–2025.
  • Hunters Creek Village Harris County · 4,498 people: no figures of its own in the FBI’s tables for 2023–2025.
  • Indian Hills Hidalgo County · 2,961 people: no figures of its own in the FBI’s tables for 2023–2025.
  • Jourdanton Atascosa County · 4,751 people: figures for 2023 and 2025 only (all three years are needed).
  • Justin Denton County · 7,285 people: figures for 2024 and 2025 only (all three years are needed).
  • Kingsland Llano County · 7,330 people: no figures of its own in the FBI’s tables for 2023–2025.
  • Krum Denton County · 6,808 people: figures for 2024 and 2025 only (all three years are needed).
  • La Blanca Hidalgo County · 2,998 people: no figures of its own in the FBI’s tables for 2023–2025.
  • La Homa Hidalgo County · 11,285 people: no figures of its own in the FBI’s tables for 2023–2025.
  • La Paloma Cameron County · 2,797 people: no figures of its own in the FBI’s tables for 2023–2025.
  • Lackland AFB Bexar County · 6,785 people: no figures of its own in the FBI’s tables for 2023–2025.
  • Lake Cherokee Gregg County · 3,093 people: no figures of its own in the FBI’s tables for 2023–2025.
  • Lakehills Bandera County · 6,130 people: no figures of its own in the FBI’s tables for 2023–2025.
  • Lantana Denton County · 12,766 people: no figures of its own in the FBI’s tables for 2023–2025.
  • Laureles Cameron County · 4,224 people: no figures of its own in the FBI’s tables for 2023–2025.
  • Liberty City Gregg County · 2,648 people: no figures of its own in the FBI’s tables for 2023–2025.
  • Lowry Crossing Collin County · 2,521 people: no figures of its own in the FBI’s tables for 2023–2025.
  • Lucas Collin County · 8,896 people: no figures of its own in the FBI’s tables for 2023–2025.
  • Mabank Kaufman County · 7,294 people: figures for 2025 only (all three years are needed).
  • Mauriceville Orange County · 2,945 people: no figures of its own in the FBI’s tables for 2023–2025.
  • McGregor McLennan County · 6,405 people: no figures of its own in the FBI’s tables for 2023–2025.
  • McLendon-Chisholm Rockwall County · 5,629 people: no figures of its own in the FBI’s tables for 2023–2025.
  • Medina Zapata County · 4,226 people: no figures of its own in the FBI’s tables for 2023–2025.
  • Midway North Hidalgo County · 3,594 people: no figures of its own in the FBI’s tables for 2023–2025.
  • Mila Doce Hidalgo County · 7,731 people: no figures of its own in the FBI’s tables for 2023–2025.
  • Mission Bend Fort Bend County · 36,586 people: no figures of its own in the FBI’s tables for 2023–2025.
  • Morgan's Point Resort Bell County · 4,746 people: figures for 2023 and 2024 only (all three years are needed).
  • Murillo Hidalgo County · 8,883 people: no figures of its own in the FBI’s tables for 2023–2025.
  • Nocona Montague County · 3,277 people: no figures of its own in the FBI’s tables for 2023–2025.
  • Nolanville Bell County · 7,983 people: figures for 2023 and 2024 only (all three years are needed).
  • North Alamo Hidalgo County · 4,819 people: no figures of its own in the FBI’s tables for 2023–2025.
  • Oak Point Denton County · 6,909 people: no figures of its own in the FBI’s tables for 2023–2025.
  • Oak Trail Shores Hood County · 3,040 people: no figures of its own in the FBI’s tables for 2023–2025.
  • Olivarez Hidalgo County · 6,326 people: no figures of its own in the FBI’s tables for 2023–2025.
  • Paloma Creek Denton County · 3,016 people: no figures of its own in the FBI’s tables for 2023–2025.
  • Paloma Creek South Denton County · 8,860 people: no figures of its own in the FBI’s tables for 2023–2025.
  • Panorama Village Montgomery County · 2,522 people: no figures of its own in the FBI’s tables for 2023–2025.
  • Pecan Acres Tarrant County · 4,161 people: no figures of its own in the FBI’s tables for 2023–2025.
  • Pecan Grove Fort Bend County · 24,272 people: no figures of its own in the FBI’s tables for 2023–2025.
  • Pecan Plantation Hood County · 6,452 people: no figures of its own in the FBI’s tables for 2023–2025.
  • Pelican Bay Tarrant County · 2,729 people: figures for 2024 and 2025 only (all three years are needed).
  • Pinehurst Montgomery County · 4,266 people: no figures of its own in the FBI’s tables for 2023–2025.
  • Piney Point Village Harris County · 3,141 people: no figures of its own in the FBI’s tables for 2023–2025.
  • Post Garza County · 3,494 people: no figures of its own in the FBI’s tables for 2023–2025.
  • Potosi Taylor County · 4,322 people: no figures of its own in the FBI’s tables for 2023–2025.
  • Pottsboro Grayson County · 2,767 people: figures for 2024 and 2025 only (all three years are needed).
  • Presidio Presidio County · 2,909 people: figures for 2023 and 2024 only (all three years are needed).
  • Primera Cameron County · 5,478 people: figures for 2023 and 2025 only (all three years are needed).
  • Progreso Hidalgo County · 5,148 people: no figures of its own in the FBI’s tables for 2023–2025.
  • Providence Village Denton County · 12,498 people: no figures of its own in the FBI’s tables for 2023–2025.
  • Redwood Guadalupe County · 3,441 people: no figures of its own in the FBI’s tables for 2023–2025.
  • Rendon Tarrant County · 14,632 people: no figures of its own in the FBI’s tables for 2023–2025.
  • Reno Lamar County · 3,575 people: no figures of its own in the FBI’s tables for 2023–2025.
  • Reno Parker County · 3,823 people: no figures of its own in the FBI’s tables for 2023–2025.
  • Rio Bravo Webb County · 4,523 people: no figures of its own in the FBI’s tables for 2023–2025.
  • Rosita Maverick County · 2,933 people: no figures of its own in the FBI’s tables for 2023–2025.
  • Salado Bell County · 2,565 people: figures for 2023 and 2024 only (all three years are needed).
  • Salida del Sol Estates Hidalgo County · 7,766 people: no figures of its own in the FBI’s tables for 2023–2025.
  • San Carlos Hidalgo County · 3,678 people: no figures of its own in the FBI’s tables for 2023–2025.
  • San Diego Duval County · 3,503 people: no figures of its own in the FBI’s tables for 2023–2025.
  • San Elizario El Paso County · 10,138 people: figures for 2023 only (all three years are needed).
  • San Leon Galveston County · 6,458 people: no figures of its own in the FBI’s tables for 2023–2025.
  • Sandy Oaks Bexar County · 5,874 people: no figures of its own in the FBI’s tables for 2023–2025.
  • Santa Rita Ranch Williamson County · 6,586 people: no figures of its own in the FBI’s tables for 2023–2025.
  • Savannah Denton County · 6,469 people: no figures of its own in the FBI’s tables for 2023–2025.
  • Scenic Oaks Bexar County · 10,569 people: no figures of its own in the FBI’s tables for 2023–2025.
  • Scissors Hidalgo County · 4,267 people: no figures of its own in the FBI’s tables for 2023–2025.
  • Shady Hollow Travis County · 5,709 people: no figures of its own in the FBI’s tables for 2023–2025.
  • Shady Shores Denton County · 2,998 people: no figures of its own in the FBI’s tables for 2023–2025.
  • Shadybrook Cherokee County · 2,810 people: no figures of its own in the FBI’s tables for 2023–2025.
  • Sienna Fort Bend County · 24,992 people: no figures of its own in the FBI’s tables for 2023–2025.
  • Sonterra Williamson County · 10,563 people: no figures of its own in the FBI’s tables for 2023–2025.
  • South Alamo Hidalgo County · 3,309 people: no figures of its own in the FBI’s tables for 2023–2025.
  • Sparks El Paso County · 4,134 people: no figures of its own in the FBI’s tables for 2023–2025.
  • Spring Harris County · 68,580 people: no figures of its own in the FBI’s tables for 2023–2025.
  • Spring Valley Village Harris County · 4,402 people: no figures of its own in the FBI’s tables for 2023–2025.
  • Steiner Ranch Travis County · 18,619 people: no figures of its own in the FBI’s tables for 2023–2025.
  • Talty Kaufman County · 3,299 people: no figures of its own in the FBI’s tables for 2023–2025.
  • Taylor Lake Village Harris County · 3,774 people: no figures of its own in the FBI’s tables for 2023–2025.
  • Temple Bell County · 98,412 people: figures for 2023 and 2024 only (all three years are needed).
  • The Homesteads Johnson County · 3,053 people: no figures of its own in the FBI’s tables for 2023–2025.
  • The Woodlands Harris County · 121,002 people: no figures of its own in the FBI’s tables for 2023–2025.
  • Timberwood Park Bexar County · 35,413 people: no figures of its own in the FBI’s tables for 2023–2025.
  • Town of Pecos · 10,386 people: no figures of its own in the FBI’s tables for 2023–2025.
  • Travis Ranch Kaufman County · 9,025 people: no figures of its own in the FBI’s tables for 2023–2025.
  • Troy Bell County · 3,585 people: figures for 2024 only (all three years are needed).
  • Val Verde Park Val Verde County · 3,139 people: no figures of its own in the FBI’s tables for 2023–2025.
  • Wells Branch Travis County · 13,523 people: no figures of its own in the FBI’s tables for 2023–2025.
  • West Livingston Polk County · 8,199 people: no figures of its own in the FBI’s tables for 2023–2025.
  • West Odessa Ector County · 32,594 people: no figures of its own in the FBI’s tables for 2023–2025.
  • Weston Lakes Fort Bend County · 4,570 people: no figures of its own in the FBI’s tables for 2023–2025.
  • Westway El Paso County · 3,484 people: no figures of its own in the FBI’s tables for 2023–2025.
  • Westworth Village Tarrant County · 2,737 people: no figures of its own in the FBI’s tables for 2023–2025.
  • Wild Peach Village Brazoria County · 2,502 people: no figures of its own in the FBI’s tables for 2023–2025.
  • Wimberley Hays County · 2,909 people: no figures of its own in the FBI’s tables for 2023–2025.
  • Winnie Chambers County · 3,290 people: no figures of its own in the FBI’s tables for 2023–2025.
  • Woodway McLennan County · 9,753 people: figures for 2024 and 2025 only (all three years are needed).
  • Wyldwood Bastrop County · 4,934 people: no figures of its own in the FBI’s tables for 2023–2025.
  • Zapata Zapata County · 4,897 people: no figures of its own in the FBI’s tables for 2023–2025.
Quick answers

Questions people ask

Which is the safest town in Texas?

Spearman (Hansford County) reports the least crime per resident: 0.00 weighted crimes per 1,000 a year over 2023–2025 (0.00 violent and 0.00 property crimes per 1,000), from its police department’s reports to the FBI. Friona (2.90) and Alpine (3.62) follow.

How are these towns ranked?

By crimes reported by each town’s police per 1,000 residents over three years (FBI figures, or the state’s own where the FBI table lacks a year), with violent crimes counted four times as heavily as property crimes. It is the same measure as the Safety grade on each town’s page. How grades work.

Why isn’t my town on this list?

The list needs 2,500+ residents and the town’s own police figures for all three years. 171 Texas towns of 2,500+ lack them; they are listed above with the reason. Smaller towns have a Safety grade on their page but no rank.

Go deeper

More Texas lists

Every list ranks the same 2,500+ towns, so a town’s rank means the same thing on each.

All Texas rankings →
Other states

Safest towns in other states