146 years in pictures
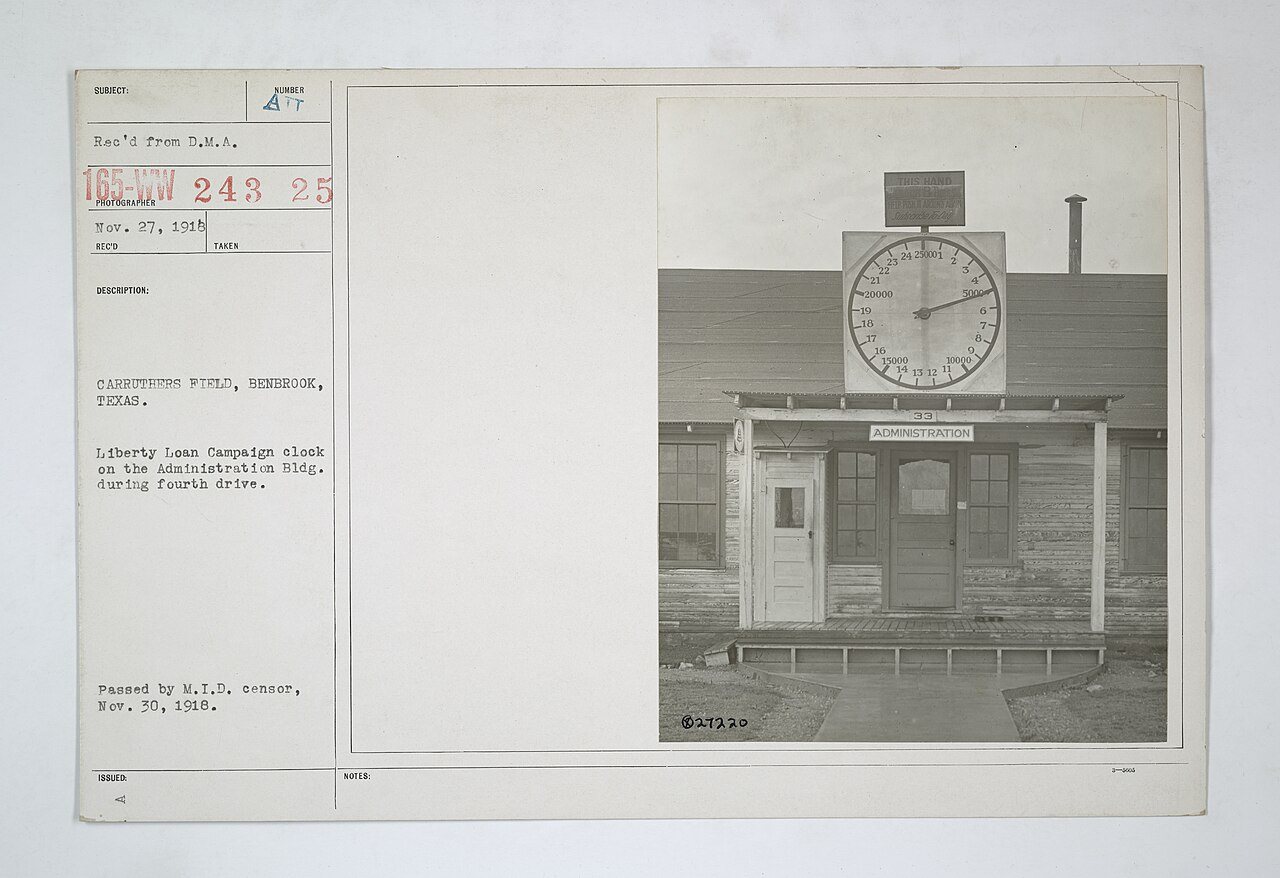
Census counts: 617 in 1950, 24,520 in 2020. The archive holds 4 old photos and papers going back to 1917 and 5 maps from 1955 on.
- 1880Benbrook is settled
Each edition grades its towns against each other only.
Benbrook grades C− overall, ranked 359th of 640 in Texas, with clear strengths and some subjects that lag. Residents are healthier than 82% of U.S. towns on CDC estimates and the median household earns $86K. On the other side, its public schools trail 90% of Texas towns on state tests and graduation. 13% of the land in Benbrook is conserved, above both the Texas town median (1.9%) and the median of U.S. towns (4.3%). Only 32 of Texas’ 1,000 towns score higher on the outdoors. The biggest park or preserve is Dutch Branch Park, at 275 acres.
Where Benbrook beats most towns, and one thing worth knowing.
13% of the town is conserved land, across 5 parks and preserves.
Each subject compared with towns across the country (schools within Texas), ordered by how far Benbrook is from typical.
How TownRatings grades towns →
Census counts: 617 in 1950, 24,520 in 2020. The archive holds 4 old photos and papers going back to 1917 and 5 maps from 1955 on.
Museums, parks, gardens and other places to visit around Benbrook. Close and well known come first.
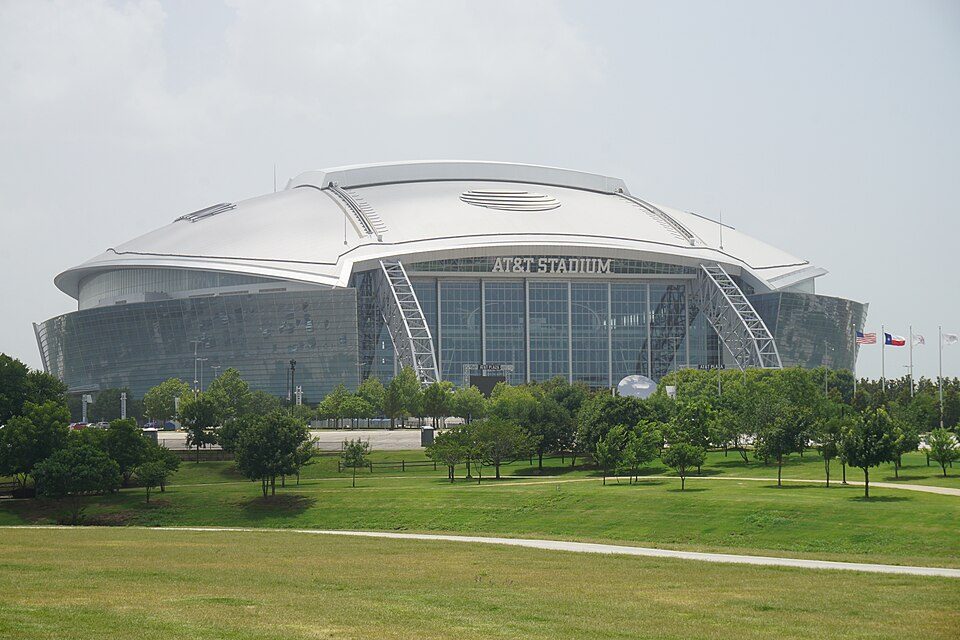
Big draw22 mi Stadium & arenaAT&T Stadium
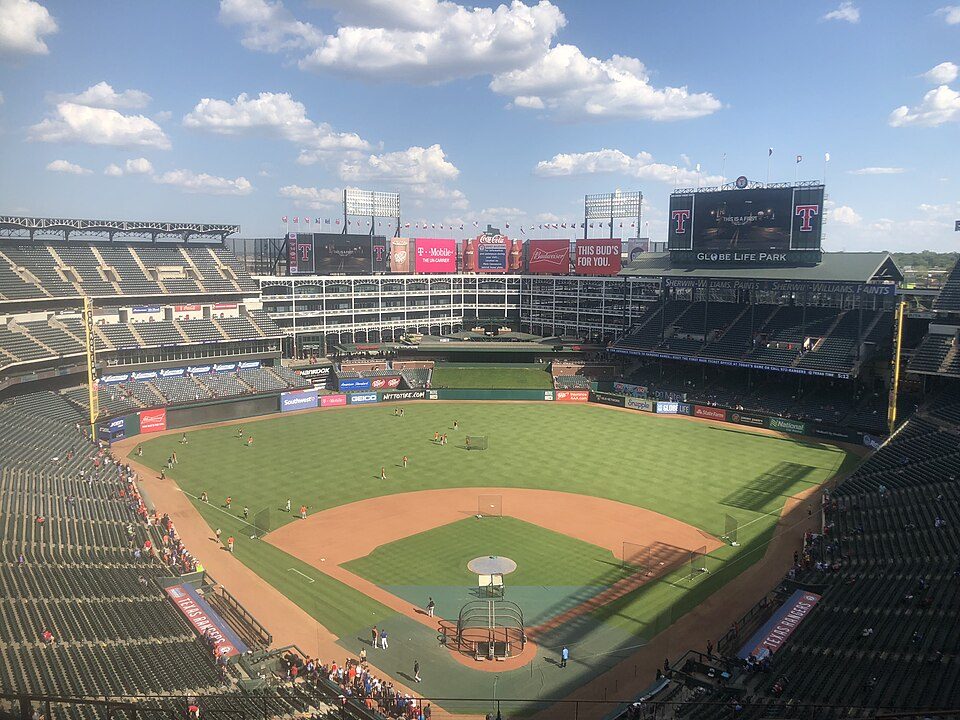
Big draw23 mi Stadium & arenaGlobe Life Field
24 mi Theme parkSix Flags Over Texas
Big draw34 mi Stadium & arenaTexas Stadium
23 mi Stadium & arenaChoctaw Stadium
6 mi Stadium & arenaAmon G. Carter StadiumAT&T Stadium: Michael Barera, CC BY-SA 4.0 · Globe Life Field: Drone To Fly, CC BY 3.0 · Six Flags Over Texas: Chris Hagerman from New Port Richey, FL, US, CC BY 2.0 · Texas Stadium: Allspamme, CC BY-SA 4.0 · Choctaw Stadium: KENGRIFFEY24FAN, CC BY-SA 4.0 · Amon G. Carter Stadium: Michael Barera, CC BY-SA 4.0
Who provides power, water and the rest in Benbrook, and how to reach them.
EPA SDWIS (Oct 9, 2026) · HIFLD + EIA-861 2025 · Census 2020 ZCTAs · NCES 2024–25 · registration: vote.gov, updated Nov 18, 2024.
Ordered by what stands out in Benbrook.
Benbrook has more 90° days than nearly all U.S. towns, has less food insecurity than most of Texas and has seen reported crime fall by a fifth or more.
Its public schools are run by Fort Worth ISD. Three of its 5 schools are below, each with why it’s listed. The largest public high school is Benbrook Middle/High School, with 1,478 students.
| School | Level | Students | Letter |
|---|---|---|---|
| Basis BenbrookLargest public elementary schoolGrades K–7 | Grades K–7 | 534 | – |
| Benbrook Middle/High SchoolLargest public high schoolGrades 6–12 | Grades 6–12 | 1,478 | B− |
| Westpark ElTop results in townGrades PK–5 | Grades PK–5 | 358 | A |
NCES · EDFacts · graded within TX on state tests and graduation
| Biggest places to walk | Trails | Acres |
|---|---|---|
| 1. Dutch Branch Park | — | 275 |
| 2. North Holiday Park | — | 143 |
| 3. Timber Creek Park | 0.1 mi | 12 |
Trails & parks © OpenStreetMap contributors · Conserved land: USGS PAD-US
Its widest gap with Texas is food insecurity: 10.2% of its 19,453 adults worry about having enough food, against 19.3% statewide.
30% of Benbrook adults have obesity, where Texas’ towns sit at 37% and U.S. towns at 35%. 12% of Benbrook adults report frequent physical distress. Benbrook beats the Texas average on 16 of 31 CDC measures and trails it on 2.
| Benbrook | Texas towns | U.S. towns | |
|---|---|---|---|
| Obesity (CDC PLACES) | 30% | 37% | 35% |
| Frequent physical distress (CDC PLACES) | 12% | 15% | 14% |
| Smoke cigarettes (CDC PLACES) | 10% | 14% | 14% |
| Fair or poor health (CDC PLACES) | 16% | 24% | 19% |
| What stands out | Benbrook | TX |
|---|---|---|
| Fewer adults facing food insecurity | 10.2% | 19.3% |
| Fewer uninsured adults | 10.6% | 19.1% |
| More adults who have had cancer | 8.9% | 6.1% |
CDC PLACES 2025 · modeled estimates for adults · CMS · HRSA
Most working residents leave Benbrook for work: only 4% work in town. Jobs based in Benbrook grew to 5,499 in 2023, 982 more than in 2013. 5.9% of residents live below the poverty line in Benbrook.
| Benbrook | Texas towns | U.S. towns | |
|---|---|---|---|
| Below the poverty line | 5.9% | 12% | 9.6% |
| Working residents who work in town | 3.5% | 8.3% | 8% |
| Median household income | $86,000 | $69,000 | $80,000 |
| Work from home | 12% | 9.6% | 11% |
Census LEHD 2023 · ACS
Reported crimes fell from 580 to 417 over the last three FBI years, a drop beyond ordinary year-to-year swings.
Benbrook’s property crime rate is 15 per 1,000 residents.
| Benbrook | Texas towns | U.S. towns | |
|---|---|---|---|
| Property crimes per 1,000 (2025) | 15 per 1,000 residents | 10.7 | 9.9 |
| Violent crimes per 1,000 (2025) | 2 per 1,000 residents | 1.9 | 1.6 |
FBI crime data, 2025 · crimes reported to police
The Benbrook Dam weather station records that about 103 days a year reach 90°, more than in 95% of U.S. towns. July afternoons average 95.7°, hotter than in 97% of U.S. towns; January nights average 34.9°.
Benbrook has mild winters and hot summers. The July high in Benbrook is 96°F. Snow is almost unheard of.
| Benbrook | Texas towns | U.S. towns | |
|---|---|---|---|
| July high | 96°F | 95°F | 85°F |
| January low | 35°F | 37°F | 22°F |
NOAA U.S. Climate Normals, 1991–2020
Adults 18 to 34 are 18% of residents (24% statewide); people 65 and older are 18% of residents (13% statewide). 44% of adults 25 and older have a bachelor’s degree or more, vs 34% across Texas.
| Benbrook | Texas towns | U.S. towns | |
|---|---|---|---|
| Bachelor’s degree or more, 25+ | 44% | 23% | 29% |
| Under 18 | 25% | 26% | 22% |
| Median age | 39.4 years | 35.8 years | 40.5 years |
| Aged 65 or older | 18% | 14% | 18% |
53% women, 47% men
About 90 men for every 100 women (the survey’s margin: ±1.9 points). Across Texas, 50.1% of residents are women. Median age: women 39.5, men 39.3.
| Benbrook | TX | U.S. | |
|---|---|---|---|
| Under 10 | 12.7% | 13.3% | 11.6% |
| 10 to 17 | 12.3% | 11.7% | 10.3% |
| 18 to 24 | 6.3% | 9.7% | 9.1% |
| 25 to 34 | 11.7% | 14.5% | 13.7% |
| 35 to 44 | 15.9% | 14.1% | 13.2% |
| 45 to 54 | 10.9% | 12.3% | 12.2% |
| 55 to 64 | 12% | 11.1% | 12.7% |
| 65 to 74 | 9.8% | 8.2% | 10.2% |
| 75 and older | 8.3% | 5.2% | 7% |
| No diploma | 5.9% | 14% | 10.4% |
| High school | 18.8% | 24.3% | 26% |
| Some college | 23.6% | 20.1% | 19.1% |
| Associate’s | 8% | 7.7% | 8.8% |
| Bachelor’s | 26.3% | 21.5% | 21.6% |
| Graduate | 17.3% | 12.3% | 14.1% |
U.S. Census Bureau · ACS 2020-2024 5-year estimates
Expected storm and flood damage is higher than in 63% of U.S. communities. Since 1979, 55 flood insurance claims have been paid out in Benbrook.
FEMA flood insurance claims · FEMA National Risk Index · OpenFEMA
The typical Benbrook home is worth about $314,000, about the same as a year ago, 6% above the Texas typical home.
| Benbrook | Texas towns | U.S. towns | |
|---|---|---|---|
| Median rent | $1,566 a month | $1,206 a month | $1,185 a month |
| Households that own their home | 68% | 69% | 73% |
Zillow Home Value Index · Redfin Data Center
6 within 15 miles of the center of Benbrook
About 4 of every 100 Benbrook residents are enrolled in college, against 6 across Texas.
21,234 counted in 2010 and 24,520 in 2020; an estimated 24,279 in 2025.
U.S. Census 2010 & 2020 counts · Census Bureau estimate, July 1, 2025
Town in Texas, United States
Benbrook is a town located in the southwestern corner of Tarrant County, Texas, United States, and a suburb of Fort Worth. As of the 2010 United States census, the population was 21,234, reflecting an increase of 1,026 from the 20,208 counted in the 2000 census, which had in turn increased by 644 from the 19,564 counted in the 1990 census. As of the 2020 census, the population grew to 24,520.
From Wikipedia, licensed CC BY-SA 4.0 · facts via Wikidata (CC0)
One town shares a border with Benbrook.
| Town | TX rank | Overall | Cost | Safety | Schools | Health |
|---|---|---|---|---|---|---|
| Benbrook | #359 | C− | C− | C | D | A− |
| Fort Worth | #554 | D | C− | D | D | C+ |
Short answers, built from the data on this page.
Benbrook grades C− overall, better than 23% of U.S. towns and #359 of 640 in Texas. It grades A− for health, C for safety and D for schools. Schools is its weak spot, with a D.
Yes. That is 3.5 years of the area's median household income ($90,275 across the Dallas-Fort Worth-Arlington, TX metro area). Cost of living, which also weighs rents, property taxes and how many households pay 30% or more of their income for housing, grades C−.