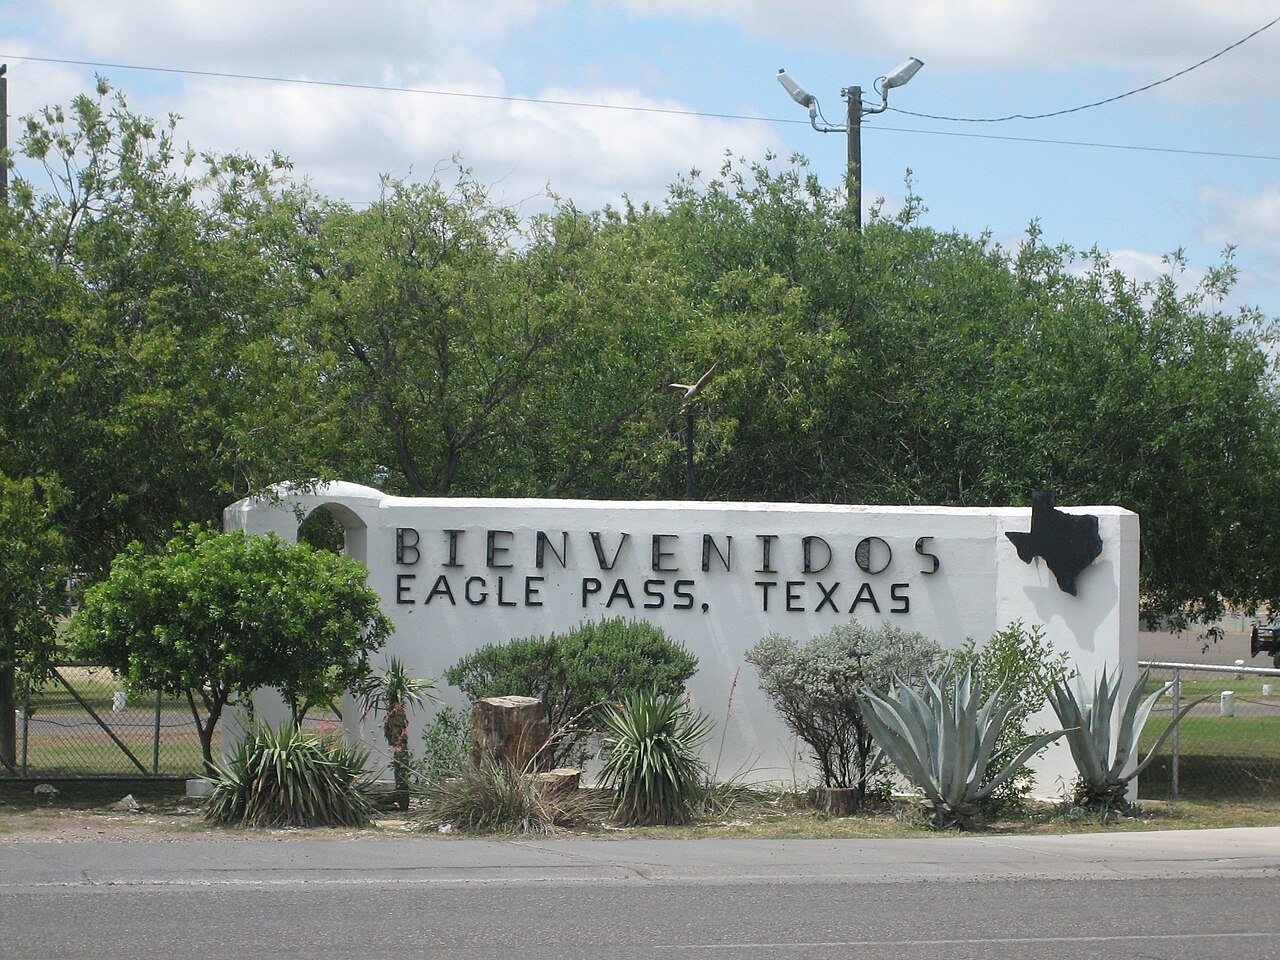
176 years in pictures
Census counts: 383 in 1850, 28,130 in 2020. The archive holds 12 old photos and papers going back to 1887 and 3 maps from 1958 on.
2 places on the National Register of Historic Places.
- 1850Eagle Pass is settled
Each edition grades its towns against each other only.

Eagle Pass earns a D, 558th of 640 graded towns in Texas, mostly because of incomes and health. The median household income is $57K, and 22% of residents live below the poverty line. Residents are less healthy than 85% of U.S. towns on CDC estimates. One bright spot: natural-hazard risk is low. 33% of working residents work locally in Eagle Pass, where Texas’ towns sit at 8.3% and U.S. towns at 8%. Eagle Pass's civic life (library use, community groups, volunteering) trails 98% of U.S. towns. Eagle Pass has 2 places on the National Register of Historic Places, among them Fort Duncan and Maverick County Courthouse.
Where Eagle Pass beats most towns.
Each subject compared with towns across the country (schools within Texas), ordered by how far Eagle Pass is from typical.
Its grades run from A+ for hazard risk (better than 99% of comparable towns) to D for cost of living (better than 12%), so the D overall blends very different results.
How TownRatings grades towns →
Census counts: 383 in 1850, 28,130 in 2020. The archive holds 12 old photos and papers going back to 1887 and 3 maps from 1958 on.
2 places on the National Register of Historic Places.
Who provides power, water and the rest in Eagle Pass, and how to reach them.
EPA SDWIS (Oct 9, 2026) · HIFLD + EIA-861 2025 · Census 2020 ZCTAs · NCES 2024–25 · registration: vote.gov, updated Nov 18, 2024.
Ordered by what stands out in Eagle Pass.
Eagle Pass carries less natural-hazard risk than nearly all of Texas (mostly inland flooding), has more 90° days than nearly all U.S. towns and has seen reported crime fall by a third or more.
17 miles of trail in 17 parks and preserves. The trail density in Eagle Pass is 1.2 miles per square mile. The biggest place to walk is Maverick County Park, 77 acres with 1.4 miles of trail.
| Eagle Pass | Texas towns | U.S. towns | |
|---|---|---|---|
| Miles of trail per square mile | 1.2 miles per square mile | 0.3 | 0.4 |
| Conserved land | 2.8% | 1.9% | 4.3% |
| Biggest places to walk | Trails | Acres |
|---|---|---|
| 1. Maverick County Park | 1.4 mi | 77 |
| 2. Fort Duncan Park | 0.4 mi | 33 |
| 3. San Juan Plaza | 0.4 mi | 4 |
Trails & parks © OpenStreetMap contributors · Conserved land: USGS PAD-US
Its public schools are run by Eagle Pass ISD. Two of its 16 schools are below, each with why it’s listed.
| School | Level | Students | Letter |
|---|---|---|---|
| Eagle Pass J HLargest public middle schoolGrades 7–8 | Grades 7–8 | 1,040 | B− |
| Eagle Pass H SLargest public high schoolGrades 9–12 | Grades 9–12 | 2,326 | B− |
NCES · EDFacts · graded within TX on state tests and graduation
FEMA rates its natural-hazard risk lower than 99% of Texas towns, with expected losses of about $237 per resident a year; that rating is what its A+ for hazard risk is built on. 85 flood insurance claims have been filed here, and 19 properties have flooded more than once.
Eagle Pass’ FEMA risk score is 4 of 100. Since 1992, 85 flood insurance claims have been paid out in Eagle Pass.
FEMA flood insurance claims · FEMA National Risk Index · OpenFEMA
34% of Eagle Pass adults say their health is fair or poor. Eagle Pass beats the Texas average on 1 of 31 CDC measures and trails it on 14. 20% of Eagle Pass adults have diabetes.
| Eagle Pass | Texas towns | U.S. towns | |
|---|---|---|---|
| Fair or poor health (CDC PLACES) | 34% | 24% | 19% |
| Diabetes (CDC PLACES) | 20% | 13% | 12% |
| Get no exercise (CDC PLACES) | 42% | 30% | 25% |
| No health insurance, 18–64 (CDC PLACES) | 35% | 18% | 8.1% |
| What stands out | Eagle Pass | TX |
|---|---|---|
| Fewer adults who have had cancer | 5% | 6.1% |
| More uninsured adults | 35.3% | 19.1% |
CDC PLACES 2025 · modeled estimates for adults · CMS · HRSA
The typical Eagle Pass home is worth about $215,000, down 5.7% in a year, 27% below the Texas typical home. 60% of households own their home in Eagle Pass.
| Eagle Pass | Texas towns | U.S. towns | |
|---|---|---|---|
| Households that own their home | 60% | 69% | 73% |
| Median rent | $880 a month | $1,208 a month | $1,185 a month |
Census ACS, 2020–24 · Zillow Home Value Index · Redfin Data Center
Reported crimes fell from 720 to 494 over the last three FBI years, a drop beyond ordinary year-to-year swings.
FBI crime data, 2025 · crimes reported to police
The Eagle Pass 3n weather station records that about 151 days a year reach 90°, more than in 99% of U.S. towns. January nights average 41.1°, milder than in 95% of U.S. towns; July afternoons average 98.4°.
Eagle Pass has warm winters and hot summers, with very little rain. Snow is almost unheard of.
| Eagle Pass | Texas towns | U.S. towns | |
|---|---|---|---|
| July high | 98°F | 95°F | 85°F |
| January low | 41°F | 37°F | 22°F |
NOAA U.S. Climate Normals, 1991–2020
The average commute for its 11,063 working residents takes 20.1 minutes, against 26.7 across Texas.
About one in 3 of Eagle Pass’s working residents works in town. Jobs based in Eagle Pass grew to 9,213 in 2023, 1,524 more than in 2013. The top destinations are San Antonio (12%), Eidson Road (11%) and Rosita (5%).
| Eagle Pass | Texas towns | U.S. towns | |
|---|---|---|---|
| Average trip to work | 20 minutes | 25 minutes | 25 minutes |
| Work from home | 5.1% | 9.7% | 11% |
| Median household income | $57,000 | $69,000 | $80,000 |
Census LEHD 2023 · ACS
None within 15 miles of Eagle Pass; the nearest are
About 6 of every 100 Eagle Pass residents are enrolled in college, about the same as Texas.
2 places in Eagle Pass on the National Register of Historic Places.
5 notable people were born in Eagle Pass.
City in Texas, United States
Eagle Pass is a city in and the county seat of Maverick County, Texas, United States. Its population was 28,130 as of the 2020 census. Eagle Pass borders the city of Piedras Negras, Coahuila, Mexico, which is to the southwest and across the Rio Grande river.
From Wikipedia, licensed CC BY-SA 4.0 · facts via Wikidata (CC0)
4 towns share a border with Eagle Pass.
| Town | TX rank | Overall | Cost | Safety | Schools | Health |
|---|---|---|---|---|---|---|
| Eagle Pass | #558 | D | D | C | C+ | C− |
| Eidson Road | #501 | D | B | — | C+ | D− |
| Seco Mines | — | — | — | — | — | — |
| Fabrica | — | — | — | — | — | — |
| Chula Vista | #445 | D | B+ | — | C+ | D− |
Eidson Road and Chula Vista report no FBI crime data of their own. Seco Mines and Fabrica aren’t graded (fewer than 1,000 residents, or not enough data). Compare Eagle Pass with a neighbor →
Short answers, built from the data on this page.
Eagle Pass grades D overall, better than 6% of U.S. towns and #558 of 640 in Texas. It grades C− for health, C for safety and C+ for schools. Cost of living is its weak spot, with a D.
Yes. That is 4.3 years of the area's median household income ($49,568 across the Eagle Pass, TX metro area). Cost of living, which also weighs rents, property taxes and how many households pay 30% or more of their income for housing, grades D.
5 notable people were born here, including Louis Lane and Alia M. Ludlum.