Guest, Sign inJoin
Smithfield, UtahSmithfield, #1 on this list · Photo: Ken Lund · CC BY-SA 2.0
Utah rankings · Safety

Safest towns in Utah

Smithfield reports the least crime per resident of Utah’s 62 towns with crime figures for 2023–2025; 11 of the 62 grade A− or better on safety nationally.

Crimes reported by each town’s own police, 2023–2025, per 1,000 residents, violent crimes counted four times. The same measure as the Safety grade. For 7 of them one year isn’t in the FBI’s published tables and comes from the FBI Crime Data Explorer or the state’s own reports (named in the row). How grades work

#1

Smithfield

Cache County · 15,153 people
A+

3.91 weighted crimes per 1,000 a year·violent 0.4, property 2.2

#3

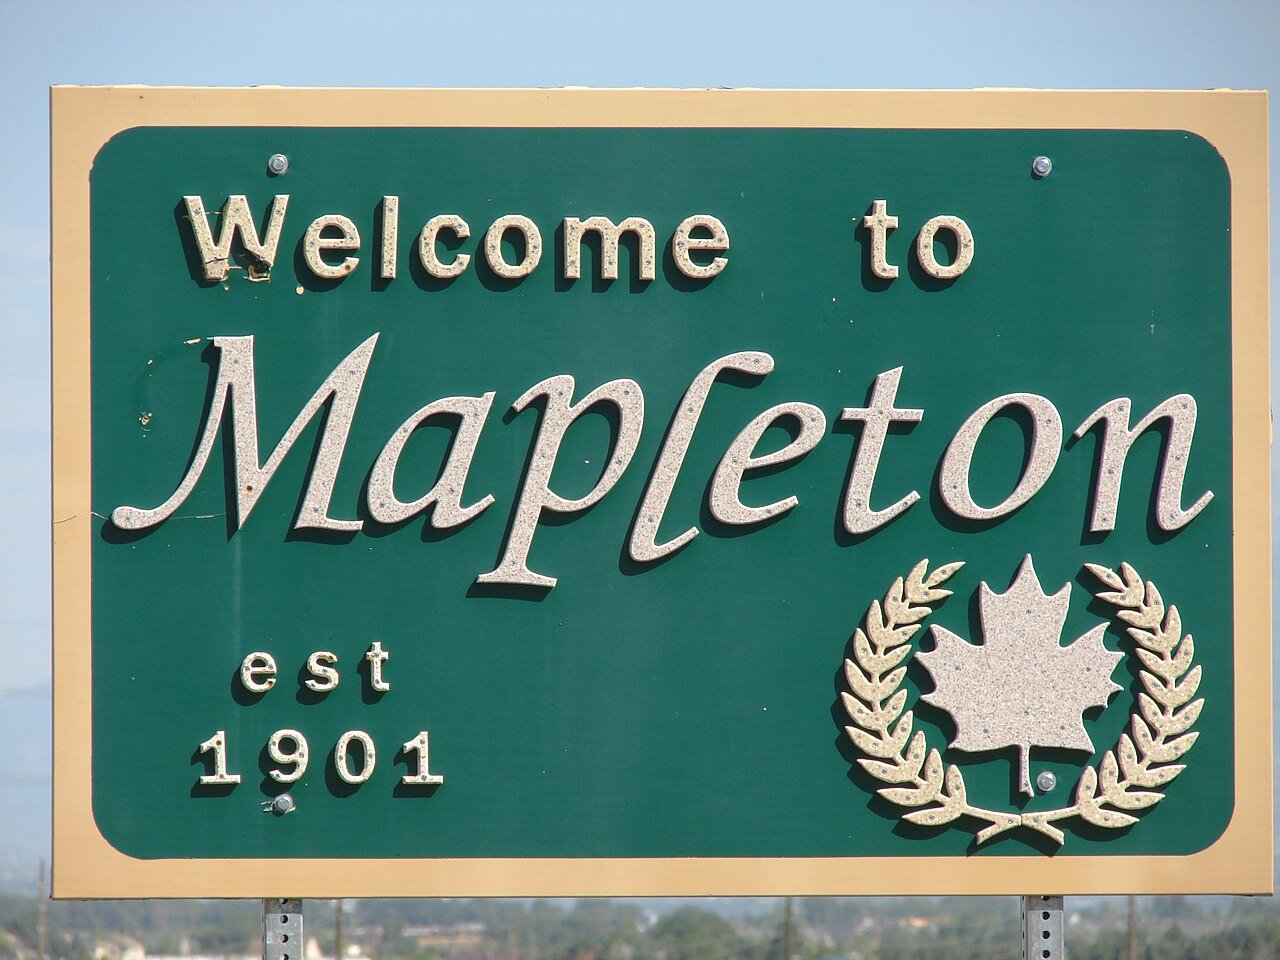
Mapleton

Utah County · 16,275 people
A

6.24 weighted crimes per 1,000 a year·violent 0.7, property 3.4

All 62 towns

Weighted crimes per 1,000 residents a year, lowest first, to two decimals (the sort uses the exact rate, so there are no rounding ties). Grade = the national Safety grade.

62 towns ranked. Not here? See towns without their own figures.

#TownWeighted rateViolentPropertyGrade
1SmithfieldCache County · 15,153 people3.910.42.2A+
2EnochIron County · 8,847 people5.480.82.1A
3MapletonUtah County · 16,275 people6.240.73.4A
4Pleasant ViewWeber County · 11,423 people6.720.64.4A
5SyracuseDavis County · 39,909 people7.540.74.7A−
6Saratoga SpringsUtah County · 61,397 people8.240.84.8A−
7EphraimSanpete County · 6,393 people8.320.85.3A−
8North OgdenWeber County · 21,689 people8.740.95.1A−
9KaysvilleDavis County · 33,307 people8.780.75.9A−
10LehiUtah County · 95,313 people9.260.95.5A−
11HerrimanSalt Lake County · 63,282 people9.400.86.1A−
12KanabKane County · 5,332 people10.650.97.0B+
13NephiJuab County · 7,488 people · 2025 from the FBI Crime Data Explorer10.761.16.4B+
14RivertonSalt Lake County · 47,395 people10.900.68.4B+
15PaysonUtah County · 24,630 people11.111.26.3B+
16Spanish ForkUtah County · 48,837 people11.170.87.8B+
17BluffdaleSalt Lake County · 19,506 people12.921.76.3B+
18FarmingtonDavis County · 26,266 people13.090.610.6B+
19North Salt LakeDavis County · 23,588 people13.310.810.0B
20Pleasant GroveUtah County · 37,773 people13.731.67.4B
21South JordanSalt Lake County · 87,614 people13.881.09.7B
22SpringvilleUtah County · 35,670 people13.941.38.6B
23WashingtonWashington County · 37,107 people14.331.29.6B
24GrantsvilleTooele County · 16,472 people14.922.74.1B
25Brigham CityBox Elder County · 20,633 people · 2024 from the FBI Crime Data Explorer15.581.59.4B
26Cedar CityIron County · 41,871 people15.841.510.0B
27CentervilleDavis County · 16,480 people · 2023 from the FBI Crime Data Explorer16.221.012.4B
28RoyWeber County · 38,794 people16.371.98.6B
29HeberWasatch County · 19,651 people16.442.08.6B
30HurricaneWashington County · 25,745 people17.091.99.4B−
31St. GeorgeWashington County · 108,713 people17.171.99.6B−
32South OgdenWeber County · 17,710 people18.492.110.2B−
33LoganCache County · 55,576 people18.511.711.6B−
34SunsetDavis County · 5,549 people18.632.39.4B−
35DraperSalt Lake County · 50,652 people18.631.712.0B−
36LaytonDavis County · 85,308 people19.021.313.9B−
37Cottonwood HeightsSalt Lake County · 32,265 people19.380.716.5B−
38Woods CrossDavis County · 11,429 people19.491.413.9B−
39OremUtah County · 95,214 people19.741.513.6B−
40ProvoUtah County · 114,527 people19.881.912.5B−
41West BountifulDavis County · 5,931 people · 2023 from the FBI Crime Data Explorer20.281.215.3B−
42La VerkinWashington County · 4,515 people20.700.916.9B−
43ClearfieldDavis County · 35,144 people20.972.511.0C+
44LindonUtah County · 12,015 people22.460.918.8C+
45PerryBox Elder County · 6,226 people23.222.314.0C+
46HarrisvilleWeber County · 7,154 people26.511.221.8C
47TaylorsvilleSalt Lake County · 57,484 people26.851.919.2C
48West JordanSalt Lake County · 116,812 people27.033.114.8C
49PriceCarbon County · 8,368 people28.112.916.7C
50SandySalt Lake County · 92,386 people · 2024 from the FBI Crime Data Explorer; 2025 from the FBI Crime Data Explorer28.412.020.5C
51RooseveltDuchesne County · 7,032 people29.963.516.1C
52TooeleTooele County · 42,270 people30.553.715.8C
53RichfieldSevier County · 8,478 people31.132.321.8C
54VernalUintah County · 10,671 people · 2023 from the FBI Crime Data Explorer33.123.120.6C−
55West Valley CitySalt Lake County · 137,491 people35.804.318.7C−
56Park CitySummit County · 8,587 people38.884.620.4C−
57OgdenWeber County · 89,510 people39.055.118.8C−
58MoabGrand County · 5,206 people41.576.515.6C−
59MurraySalt Lake County · 53,297 people43.402.533.5D
60RiverdaleWeber County · 9,206 people56.473.343.4D
61South Salt LakeSalt Lake County · 26,934 people · 2023 from the FBI Crime Data Explorer80.367.152.1D−
62Salt Lake CitySalt Lake County · 218,428 people86.358.651.8D−

Per 1,000 residents a year, 2023–2025. Last on the list: Salt Lake City, 86.35. The rate counts crimes reported to police, not how safe any one street feels.

Not ranked

57 towns without figures of their own

These towns of 2,500+ are not on the list because there are no police figures for them alone for all of 2023–2025, from the FBI or the state. In 2025 the FBI’s tables list State Police figures for 0 of Utah’s counties and county sheriff figures for 24; those cover many towns at once and can’t be split by town, so they aren’t ranked here. Their other grades stand; the overall grade uses the rest.

  • Alpine Utah County · 10,444 people: no figures of its own in the FBI’s tables for 2023–2025.
  • American Fork Utah County · 41,020 people: no figures of its own in the FBI’s tables for 2023–2025.
  • Beaver Beaver County · 3,699 people: no figures of its own in the FBI’s tables for 2023–2025.
  • Blanding San Juan County · 3,199 people: figures for 2023 and 2025 only (all three years are needed).
  • Bountiful Davis County · 44,988 people: no figures of its own in the FBI’s tables for 2023–2025.
  • Cedar Hills Utah County · 9,755 people: no figures of its own in the FBI’s tables for 2023–2025.
  • Clinton Davis County · 23,797 people: figures for 2024 and 2025 only (all three years are needed).
  • Delta Millard County · 3,868 people: no figures of its own in the FBI’s tables for 2023–2025.
  • Eagle Mountain Utah County · 66,557 people: no figures of its own in the FBI’s tables for 2023–2025.
  • East Basin Summit County · 4,002 people: no figures of its own in the FBI’s tables for 2023–2025.
  • Elk Ridge Utah County · 4,969 people: no figures of its own in the FBI’s tables for 2023–2025.
  • Erda Tooele County · 4,056 people: no figures of its own in the FBI’s tables for 2023–2025.
  • Farr West Weber County · 8,163 people: no figures of its own in the FBI’s tables for 2023–2025.
  • Fillmore Millard County · 2,874 people: no figures of its own in the FBI’s tables for 2023–2025.
  • Fruit Heights Davis County · 5,952 people: no figures of its own in the FBI’s tables for 2023–2025.
  • Garland Box Elder County · 2,915 people: no figures of its own in the FBI’s tables for 2023–2025.
  • Gunnison Sanpete County · 3,693 people: no figures of its own in the FBI’s tables for 2023–2025.
  • Highland Utah County · 21,571 people: no figures of its own in the FBI’s tables for 2023–2025.
  • Holladay Salt Lake County · 31,162 people: no figures of its own in the FBI’s tables for 2023–2025.
  • Hooper Weber County · 9,741 people: no figures of its own in the FBI’s tables for 2023–2025.
  • Hyde Park Cache County · 5,786 people: no figures of its own in the FBI’s tables for 2023–2025.
  • Hyrum Cache County · 11,132 people: no figures of its own in the FBI’s tables for 2023–2025.
  • Ivins Washington County · 11,546 people: no figures of its own in the FBI’s tables for 2023–2025.
  • Kearns Salt Lake County · 35,404 people: no figures of its own in the FBI’s tables for 2023–2025.
  • Lake Point · 2,947 people: no figures of its own in the FBI’s tables for 2023–2025.
  • Maeser Uintah County · 4,435 people: no figures of its own in the FBI’s tables for 2023–2025.
  • Magna Salt Lake County · 35,401 people: no figures of its own in the FBI’s tables for 2023–2025.
  • Manti Sanpete County · 3,794 people: no figures of its own in the FBI’s tables for 2023–2025.
  • Midvale Salt Lake County · 36,099 people: no figures of its own in the FBI’s tables for 2023–2025.
  • Midway Wasatch County · 6,011 people: no figures of its own in the FBI’s tables for 2023–2025.
  • Millcreek Salt Lake County · 63,926 people: no figures of its own in the FBI’s tables for 2023–2025.
  • Millville Cache County · 2,508 people: no figures of its own in the FBI’s tables for 2023–2025.
  • Monroe Sevier County · 2,738 people: no figures of its own in the FBI’s tables for 2023–2025.
  • Morgan Morgan County · 4,580 people: no figures of its own in the FBI’s tables for 2023–2025.
  • Mount Pleasant Sanpete County · 4,018 people: figures for 2023 and 2024 only (all three years are needed).
  • Mountain Green Morgan County · 3,976 people: no figures of its own in the FBI’s tables for 2023–2025.
  • Nibley Cache County · 8,975 people: no figures of its own in the FBI’s tables for 2023–2025.
  • North Logan Cache County · 11,608 people: no figures of its own in the FBI’s tables for 2023–2025.
  • Parowan Iron County · 3,282 people: no figures of its own in the FBI’s tables for 2023–2025.
  • Plain City Weber County · 9,256 people: no figures of its own in the FBI’s tables for 2023–2025.
  • Providence Cache County · 9,539 people: no figures of its own in the FBI’s tables for 2023–2025.
  • Richmond Cache County · 3,130 people: no figures of its own in the FBI’s tables for 2023–2025.
  • Salem Utah County · 12,234 people: figures for 2023 and 2024 only (all three years are needed).
  • Salina Sevier County · 2,640 people: figures for 2023 only (all three years are needed).
  • Santa Clara Washington County · 8,722 people: no figures of its own in the FBI’s tables for 2023–2025.
  • Santaquin Utah County · 18,989 people: no figures of its own in the FBI’s tables for 2023–2025.
  • Snyderville Summit County · 5,948 people: no figures of its own in the FBI’s tables for 2023–2025.
  • South Weber Davis County · 8,218 people: no figures of its own in the FBI’s tables for 2023–2025.
  • Stansbury Park Tooele County · 11,242 people: no figures of its own in the FBI’s tables for 2023–2025.
  • Summit Park Summit County · 8,537 people: no figures of its own in the FBI’s tables for 2023–2025.
  • Tremonton Box Elder County · 12,934 people: no figures of its own in the FBI’s tables for 2023–2025.
  • Vineyard Utah County · 16,092 people: no figures of its own in the FBI’s tables for 2023–2025.
  • Washington Terrace Weber County · 9,075 people: no figures of its own in the FBI’s tables for 2023–2025.
  • Wellsville Cache County · 4,303 people: no figures of its own in the FBI’s tables for 2023–2025.
  • West Haven Weber County · 25,627 people: no figures of its own in the FBI’s tables for 2023–2025.
  • West Point Davis County · 13,058 people: no figures of its own in the FBI’s tables for 2023–2025.
  • White City Salt Lake County · 5,146 people: no figures of its own in the FBI’s tables for 2023–2025.
Quick answers

Questions people ask

Which is the safest town in Utah?

Smithfield (Cache County) reports the least crime per resident: 3.91 weighted crimes per 1,000 a year over 2023–2025 (0.42 violent and 2.23 property crimes per 1,000), from its police department’s reports to the FBI. Enoch (5.48) and Mapleton (6.24) follow.

How are these towns ranked?

By crimes reported by each town’s police per 1,000 residents over three years (FBI figures, or the state’s own where the FBI table lacks a year), with violent crimes counted four times as heavily as property crimes. It is the same measure as the Safety grade on each town’s page. How grades work.

Why isn’t my town on this list?

The list needs 2,500+ residents and the town’s own police figures for all three years. 57 Utah towns of 2,500+ lack them; they are listed above with the reason. Smaller towns have a Safety grade on their page but no rank.

Go deeper

More Utah lists

Every list ranks the same 2,500+ towns, so a town’s rank means the same thing on each.

All Utah rankings →
Other states

Safest towns in other states