Guest, Sign inJoin
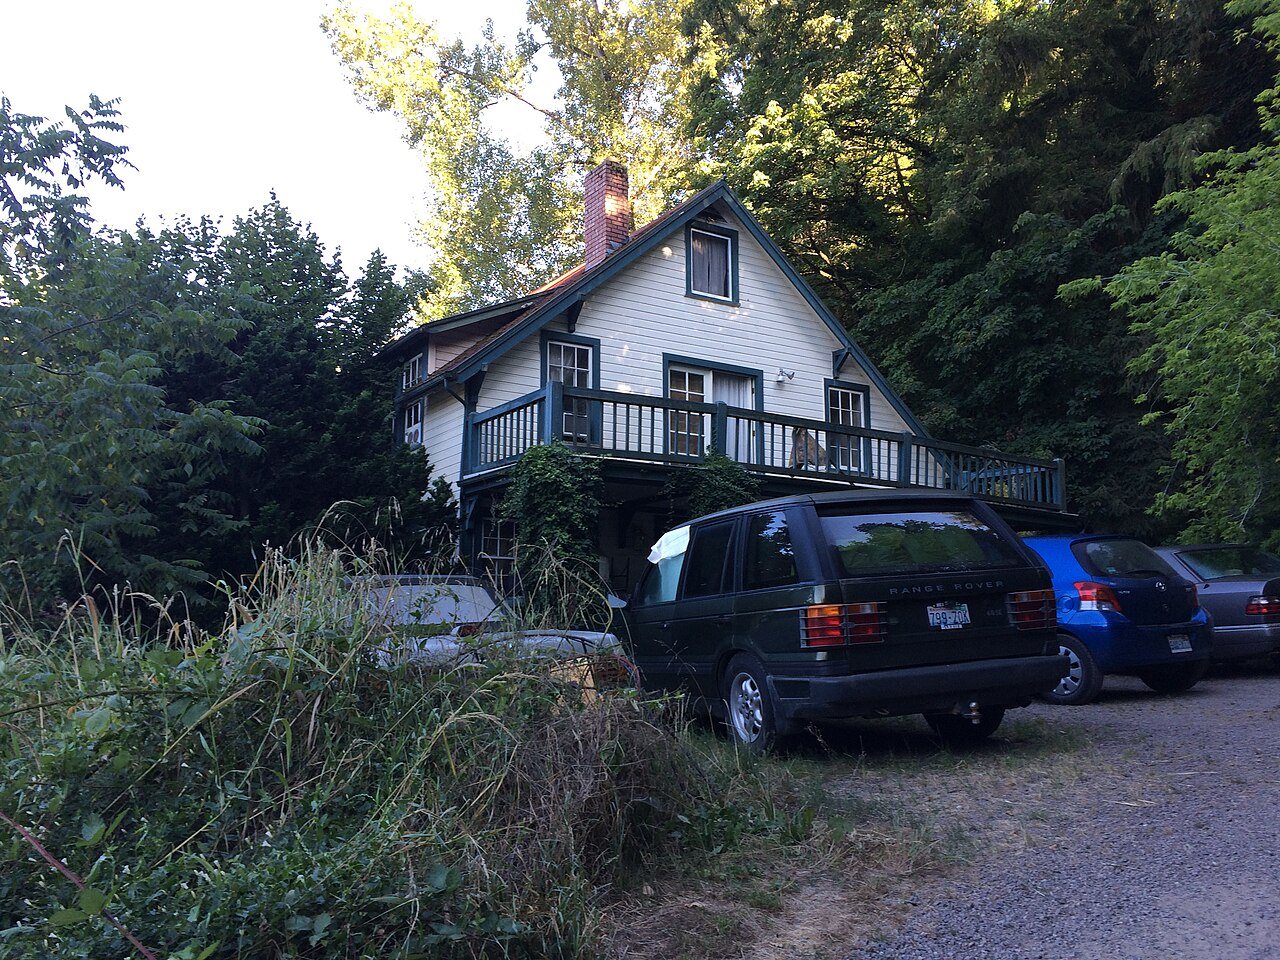
Horatio and Laura Allen FarmDuvall, #1 on this list · Horatio and Laura Allen Farm · Photo: Jon Roanhaus · CC BY-SA 3.0
Washington rankings · Safety

Safest towns in Washington

Duvall reports the least crime per resident of Washington’s 130 towns with crime figures for 2023–2025; 10 of the 130 grade A− or better on safety nationally.

Crimes reported by each town’s own police, 2023–2025, per 1,000 residents, violent crimes counted four times. The same measure as the Safety grade. For 5 of them one year isn’t in the FBI’s published tables and comes from the FBI Crime Data Explorer or the state’s own reports (named in the row). How grades work

#1

Duvall

King County · 9,440 people
A+

3.25 weighted crimes per 1,000 a year·violent 0.3, property 1.9

#3

Sammamish

King County · 66,110 people
A

5.78 weighted crimes per 1,000 a year·violent 0.2, property 4.9

All 130 towns

Weighted crimes per 1,000 residents a year, lowest first, to two decimals (the sort uses the exact rate, so there are no rounding ties). Grade = the national Safety grade.

130 towns ranked. Not here? See towns without their own figures.

#TownWeighted rateViolentPropertyGrade
1DuvallKing County · 9,440 people · 2023 from the FBI Crime Data Explorer; 2024 from the FBI Crime Data Explorer3.250.31.9A+
2EversonWhatcom County · 3,254 people · 2023 from the FBI Crime Data Explorer5.600.63.1A
3SammamishKing County · 66,110 people5.780.24.9A
4ColvilleStevens County · 5,116 people6.000.34.7A
5Black DiamondKing County · 6,978 people6.140.25.2A
6WinlockLewis County · 2,640 people8.760.66.4A−
7Sedro-WoolleySkagit County · 13,308 people9.150.47.7A−
8Ocean ShoresGrays Harbor County · 7,892 people · 2024 from the FBI Crime Data Explorer9.200.76.3A−
9MoxeeYakima County · 4,765 people9.301.43.6A−
10Clyde HillKing County · 3,161 people9.890.86.9A−
11Bainbridge IslandKitsap County · 24,691 people10.080.48.4B+
12CamasClark County · 27,749 people10.210.48.5B+
13MedinaKing County · 2,974 people10.540.110.1B+
14Lake StevensSnohomish County · 42,091 people11.231.16.9B+
15West RichlandBenton County · 19,257 people11.341.26.4B+
16KenmoreKing County · 24,249 people11.420.69.0B+
17SultanSnohomish County · 7,230 people12.461.75.6B+
18SnoqualmieKing County · 13,640 people13.220.411.7B
19Oak HarborIsland County · 24,083 people13.391.09.3B
20Mercer IslandKing County · 25,422 people13.480.611.2B
21RidgefieldClark County · 16,132 people14.020.910.5B
22Battle GroundClark County · 23,513 people14.551.110.2B
23SteilacoomPierce County · 6,648 people14.641.58.8B
24PullmanWhitman County · 33,756 people14.891.68.6B
25SelahYakima County · 8,678 people15.071.110.6B
26StanwoodSnohomish County · 9,421 people15.201.49.8B
27Granite FallsSnohomish County · 4,686 people15.221.49.5B
28DuPontPierce County · 9,778 people15.480.912.0B
29Maple ValleyKing County · 28,482 people15.930.912.4B
30BuckleyPierce County · 5,688 people15.991.98.4B
31MontesanoGrays Harbor County · 4,181 people16.070.812.9B
32OrtingPierce County · 8,884 people16.292.08.2B
33KalamaCowlitz County · 3,165 people16.560.913.1B
34Normandy ParkKing County · 6,609 people16.771.012.7B−
35BothellKing County · 52,199 people17.411.013.5B−
36EnumclawKing County · 13,172 people18.420.715.7B−
37LyndenWhatcom County · 16,881 people18.481.612.2B−
38AlgonaKing County · 3,253 people18.721.014.6B−
39WashougalClark County · 18,028 people19.072.210.5B−
40MukilteoSnohomish County · 21,239 people19.891.115.5B−
41College PlaceWalla Walla County · 9,923 people19.950.816.7B−
42AnacortesSkagit County · 18,080 people20.160.916.7B−
43FerndaleWhatcom County · 17,559 people20.591.614.3B−
44Lake Forest ParkKing County · 13,191 people20.620.817.5B−
45KirklandKing County · 97,410 people20.640.817.5B−
46WardenGrant County · 2,830 people20.702.112.4B−
47ProsserBenton County · 6,654 people21.402.112.9C+
48Liberty LakeSpokane County · 14,029 people21.541.615.2C+
49EatonvillePierce County · 2,861 people22.213.96.6C+
50Bonney LakePierce County · 22,139 people22.711.516.8C+
51East WenatcheeDouglas County · 14,414 people23.161.318.1C+
52PoulsboKitsap County · 12,749 people23.581.617.1C+
53NewcastleKing County · 13,128 people24.430.821.4C+
54Mount VernonSkagit County · 35,193 people24.711.717.7C+
55PacificKing County · 7,056 people25.012.116.5C+
56Port TownsendJefferson County · 10,678 people25.062.913.5C+
57ElmaGrays Harbor County · 3,534 people25.392.117.0C+
58SnohomishSnohomish County · 10,719 people25.401.718.6C+
59MarysvilleSnohomish County · 77,686 people25.692.117.3C+
60BlaineWhatcom County · 6,475 people25.902.316.6C
61FircrestPierce County · 6,959 people26.652.815.4C
62EdgewoodPierce County · 13,548 people27.472.119.2C
63YelmThurston County · 12,043 people · 2023 from the FBI Crime Data Explorer27.572.716.7C
64North BendKing County · 8,758 people28.600.427.0C
65Mountlake TerraceSnohomish County · 25,430 people28.621.722.0C
66ShorelineKing County · 66,542 people28.641.622.2C
67MonroeSnohomish County · 20,025 people29.012.419.5C
68WoodinvilleKing County · 14,548 people29.570.826.4C
69EllensburgKittitas County · 21,308 people29.652.121.2C
70TumwaterThurston County · 28,010 people29.712.420.2C
71SequimClallam County · 8,215 people29.892.619.5C
72WoodlandCowlitz County · 6,611 people29.991.324.9C
73University PlacePierce County · 35,479 people30.042.420.3C
74RedmondKing County · 82,506 people30.231.225.4C
75CheneySpokane County · 12,650 people30.663.317.6C
76GoldendaleKlickitat County · 3,528 people31.011.026.8C
77KelsoCowlitz County · 12,801 people31.242.122.9C
78OthelloAdams County · 9,237 people31.432.521.4C
79RichlandBenton County · 65,258 people31.842.521.8C
80LaceyThurston County · 58,833 people32.352.024.4C−
81PascoFranklin County · 82,848 people33.043.320.0C−
82EdmondsSnohomish County · 42,748 people33.412.124.9C−
83IssaquahKing County · 39,423 people · 2024 from the FBI Crime Data Explorer33.440.830.4C−
84ArlingtonSnohomish County · 22,031 people34.003.221.0C−
85SunnysideYakima County · 16,430 people34.102.325.1C−
86GrandviewYakima County · 12,062 people34.163.619.6C−
87CovingtonKing County · 21,496 people34.301.428.5C−
88Walla WallaWalla Walla County · 34,058 people34.363.420.7C−
89BellevueKing County · 154,193 people35.121.329.8C−
90WenatcheeChelan County · 35,547 people35.692.724.8C−
91EphrataGrant County · 8,834 people35.781.729.0C−
92Gig HarborPierce County · 12,630 people39.332.429.6C−
93Des MoinesKing County · 33,032 people39.772.828.6C−
94MiltonPierce County · 8,911 people40.563.128.3C−
95CentraliaLewis County · 19,375 people41.313.128.8C−
96LongviewCowlitz County · 38,362 people41.732.631.1C−
97YakimaYakima County · 97,458 people41.795.221.1C−
98BremertonKitsap County · 45,482 people41.823.926.3C−
99Port OrchardKitsap County · 19,839 people41.883.428.1C−
100AberdeenGrays Harbor County · 17,088 people43.233.728.4D
101Spokane ValleySpokane County · 108,405 people44.512.634.2D
102Port AngelesClallam County · 20,146 people44.555.024.5D
103EverettSnohomish County · 113,567 people44.833.032.8D
104SheltonMason County · 10,921 people46.255.524.4D
105KennewickBenton County · 88,366 people47.323.732.5D
106RentonKing County · 104,975 people47.333.433.9D
107SumnerPierce County · 10,871 people47.423.334.4D
108BurienKing County · 51,859 people48.204.032.1D
109BellinghamWhatcom County · 96,395 people49.663.137.2D
110SeaTacKing County · 34,578 people50.833.736.0D
111ClarkstonAsotin County · 7,189 people51.563.637.0D
112Moses LakeGrant County · 27,469 people52.974.036.8D
113PuyallupPierce County · 42,682 people53.663.639.5D
114Airway HeightsSpokane County · 11,811 people53.803.938.2D
115KentKing County · 134,871 people53.824.436.4D
116OlympiaThurston County · 56,724 people54.125.432.7D
117ChehalisLewis County · 7,764 people54.573.441.1D
118AuburnKing County · 86,301 people58.214.839.0D
119VancouverClark County · 199,698 people59.606.035.8D
120ToppenishYakima County · 8,635 people60.924.642.4D
121Federal WayKing County · 99,729 people61.675.141.2D
122LakewoodPierce County · 62,755 people62.996.437.4D
123BurlingtonSkagit County · 11,356 people65.141.658.7D
124LynnwoodSnohomish County · 42,132 people68.603.056.8D−
125SpokaneSpokane County · 230,783 people75.266.648.7D−
126SeattleKing County · 784,777 people78.057.548.1D−
127Union GapYakima County · 6,617 people78.381.871.4D−
128TacomaPierce County · 229,816 people98.2810.556.1D−
129FifePierce County · 11,061 people111.4311.764.6D−
130TukwilaKing County · 22,003 people173.687.7143.0D−

Per 1,000 residents a year, 2023–2025. Last on the list: Tukwila, 173.68. The rate counts crimes reported to police, not how safe any one street feels.

Not ranked

155 towns without figures of their own

These towns of 2,500+ are not on the list because there are no police figures for them alone for all of 2023–2025, from the FBI or the state. In 2025 the FBI’s tables list State Police figures for 0 of Washington’s counties and county sheriff figures for 34; those cover many towns at once and can’t be split by town, so they aren’t ranked here. Their other grades stand; the overall grade uses the rest.

  • Ahtanum Yakima County · 3,777 people: no figures of its own in the FBI’s tables for 2023–2025.
  • Alderton Pierce County · 2,706 people: no figures of its own in the FBI’s tables for 2023–2025.
  • Alderwood Manor Snohomish County · 10,266 people: no figures of its own in the FBI’s tables for 2023–2025.
  • Arlington Heights Snohomish County · 2,727 people: no figures of its own in the FBI’s tables for 2023–2025.
  • Artondale Pierce County · 14,073 people: no figures of its own in the FBI’s tables for 2023–2025.
  • Bangor Base Kitsap County · 6,112 people: no figures of its own in the FBI’s tables for 2023–2025.
  • Barberton Clark County · 8,668 people: no figures of its own in the FBI’s tables for 2023–2025.
  • Belfair Mason County · 4,557 people: no figures of its own in the FBI’s tables for 2023–2025.
  • Benton City Benton County · 4,019 people: no figures of its own in the FBI’s tables for 2023–2025.
  • Bethel Kitsap County · 4,394 people: no figures of its own in the FBI’s tables for 2023–2025.
  • Birch Bay Whatcom County · 10,837 people: no figures of its own in the FBI’s tables for 2023–2025.
  • Bothell East Snohomish County · 14,578 people: no figures of its own in the FBI’s tables for 2023–2025.
  • Bothell West Snohomish County · 22,029 people: no figures of its own in the FBI’s tables for 2023–2025.
  • Boulevard Park King County · 4,575 people: no figures of its own in the FBI’s tables for 2023–2025.
  • Brier Snohomish County · 6,597 people: figures for 2023 and 2024 only (all three years are needed).
  • Brush Prairie Clark County · 2,526 people: no figures of its own in the FBI’s tables for 2023–2025.
  • Bryant Snohomish County · 2,648 people: no figures of its own in the FBI’s tables for 2023–2025.
  • Bryn Mawr-Skyway King County · 17,638 people: no figures of its own in the FBI’s tables for 2023–2025.
  • Bunk Foss Snohomish County · 3,627 people: no figures of its own in the FBI’s tables for 2023–2025.
  • Burbank Walla Walla County · 3,589 people: no figures of its own in the FBI’s tables for 2023–2025.
  • Camano Island County · 17,303 people: no figures of its own in the FBI’s tables for 2023–2025.
  • Canterwood Pierce County · 2,971 people: no figures of its own in the FBI’s tables for 2023–2025.
  • Canyon Creek Snohomish County · 3,910 people: no figures of its own in the FBI’s tables for 2023–2025.
  • Cascade Valley Grant County · 4,609 people: no figures of its own in the FBI’s tables for 2023–2025.
  • Cashmere Chelan County · 3,326 people: no figures of its own in the FBI’s tables for 2023–2025.
  • Central Park Grays Harbor County · 3,206 people: no figures of its own in the FBI’s tables for 2023–2025.
  • Chain Lake Snohomish County · 4,950 people: no figures of its own in the FBI’s tables for 2023–2025.
  • Chelan Chelan County · 4,494 people: no figures of its own in the FBI’s tables for 2023–2025.
  • Chewelah Stevens County · 2,712 people: no figures of its own in the FBI’s tables for 2023–2025.
  • Chico Kitsap County · 3,336 people: no figures of its own in the FBI’s tables for 2023–2025.
  • Clarkston Heights-Vineland Asotin County · 7,884 people: no figures of its own in the FBI’s tables for 2023–2025.
  • Clearview Snohomish County · 3,254 people: no figures of its own in the FBI’s tables for 2023–2025.
  • Clover Creek Pierce County · 7,345 people: no figures of its own in the FBI’s tables for 2023–2025.
  • Colfax Whitman County · 2,667 people: no figures of its own in the FBI’s tables for 2023–2025.
  • Connell Franklin County · 5,080 people: figures for 2023 and 2024 only (all three years are needed).
  • Cottage Lake King County · 22,518 people: no figures of its own in the FBI’s tables for 2023–2025.
  • Country Homes Spokane County · 6,198 people: no figures of its own in the FBI’s tables for 2023–2025.
  • Dayton Columbia County · 2,538 people: no figures of its own in the FBI’s tables for 2023–2025.
  • Deer Park Spokane County · 5,370 people: no figures of its own in the FBI’s tables for 2023–2025.
  • Desert Aire Grant County · 2,788 people: no figures of its own in the FBI’s tables for 2023–2025.
  • East Port Orchard Kitsap County · 4,725 people: no figures of its own in the FBI’s tables for 2023–2025.
  • East Renton Highlands King County · 12,582 people: no figures of its own in the FBI’s tables for 2023–2025.
  • Eastmont Snohomish County · 23,721 people: no figures of its own in the FBI’s tables for 2023–2025.
  • Elk Plain Pierce County · 14,276 people: no figures of its own in the FBI’s tables for 2023–2025.
  • Esperance Snohomish County · 4,189 people: no figures of its own in the FBI’s tables for 2023–2025.
  • Fairchild AFB Spokane County · 2,931 people: no figures of its own in the FBI’s tables for 2023–2025.
  • Fairwood Spokane County · 10,674 people: no figures of its own in the FBI’s tables for 2023–2025.
  • Fairwood King County · 17,856 people: no figures of its own in the FBI’s tables for 2023–2025.
  • Felida Clark County · 10,841 people: no figures of its own in the FBI’s tables for 2023–2025.
  • Finley Benton County · 5,634 people: no figures of its own in the FBI’s tables for 2023–2025.
  • Five Corners Clark County · 21,194 people: no figures of its own in the FBI’s tables for 2023–2025.
  • Fobes Hill Snohomish County · 2,569 people: no figures of its own in the FBI’s tables for 2023–2025.
  • Forks Clallam County · 3,488 people: no figures of its own in the FBI’s tables for 2023–2025.
  • Fort Lewis Pierce County · 15,167 people: no figures of its own in the FBI’s tables for 2023–2025.
  • Fox Island Pierce County · 3,414 people: no figures of its own in the FBI’s tables for 2023–2025.
  • Frederickson Pierce County · 25,383 people: no figures of its own in the FBI’s tables for 2023–2025.
  • Friday Harbor San Juan County · 2,729 people: no figures of its own in the FBI’s tables for 2023–2025.
  • Gleed Yakima County · 2,844 people: no figures of its own in the FBI’s tables for 2023–2025.
  • Gold Bar Snohomish County · 2,561 people: figures for 2024 and 2025 only (all three years are needed).
  • Graham Pierce County · 35,079 people: no figures of its own in the FBI’s tables for 2023–2025.
  • Grand Mound Thurston County · 3,287 people: no figures of its own in the FBI’s tables for 2023–2025.
  • Granger Yakima County · 3,831 people: no figures of its own in the FBI’s tables for 2023–2025.
  • Hansville Kitsap County · 3,384 people: no figures of its own in the FBI’s tables for 2023–2025.
  • Hazel Dell Clark County · 23,237 people: no figures of its own in the FBI’s tables for 2023–2025.
  • High Bridge Snohomish County · 3,196 people: no figures of its own in the FBI’s tables for 2023–2025.
  • Hobart King County · 6,552 people: no figures of its own in the FBI’s tables for 2023–2025.
  • Hockinson Clark County · 6,150 people: no figures of its own in the FBI’s tables for 2023–2025.
  • Hoquiam Grays Harbor County · 8,710 people: figures for 2023 and 2024 only (all three years are needed).
  • Indianola Kitsap County · 3,468 people: no figures of its own in the FBI’s tables for 2023–2025.
  • Key Center Pierce County · 3,544 people: no figures of its own in the FBI’s tables for 2023–2025.
  • La Center Clark County · 4,433 people: figures for 2023 and 2024 only (all three years are needed).
  • Lake Cassidy Snohomish County · 3,292 people: no figures of its own in the FBI’s tables for 2023–2025.
  • Lake Goodwin Snohomish County · 5,536 people: no figures of its own in the FBI’s tables for 2023–2025.
  • Lake Holm King County · 3,555 people: no figures of its own in the FBI’s tables for 2023–2025.
  • Lake Morton-Berrydale King County · 11,183 people: no figures of its own in the FBI’s tables for 2023–2025.
  • Lake Shore Clark County · 6,978 people: no figures of its own in the FBI’s tables for 2023–2025.
  • Lake Stickney Snohomish County · 15,890 people: no figures of its own in the FBI’s tables for 2023–2025.
  • Lake Tapps Pierce County · 12,798 people: no figures of its own in the FBI’s tables for 2023–2025.
  • Lakeland North King County · 15,950 people: no figures of its own in the FBI’s tables for 2023–2025.
  • Lakeland South King County · 13,100 people: no figures of its own in the FBI’s tables for 2023–2025.
  • Larch Way Snohomish County · 4,424 people: no figures of its own in the FBI’s tables for 2023–2025.
  • Leavenworth Chelan County · 3,373 people: no figures of its own in the FBI’s tables for 2023–2025.
  • Lexington Cowlitz County · 4,413 people: no figures of its own in the FBI’s tables for 2023–2025.
  • Lochsloy Snohomish County · 3,029 people: no figures of its own in the FBI’s tables for 2023–2025.
  • Longbranch Pierce County · 4,638 people: no figures of its own in the FBI’s tables for 2023–2025.
  • Longview Heights Cowlitz County · 4,357 people: no figures of its own in the FBI’s tables for 2023–2025.
  • Maltby Snohomish County · 10,910 people: no figures of its own in the FBI’s tables for 2023–2025.
  • Manchester Kitsap County · 5,956 people: no figures of its own in the FBI’s tables for 2023–2025.
  • Maple Heights-Lake Desire King County · 4,113 people: no figures of its own in the FBI’s tables for 2023–2025.
  • Maplewood Pierce County · 5,803 people: no figures of its own in the FBI’s tables for 2023–2025.
  • Marietta-Alderwood Whatcom County · 3,754 people: no figures of its own in the FBI’s tables for 2023–2025.
  • Martha Lake Snohomish County · 22,634 people: no figures of its own in the FBI’s tables for 2023–2025.
  • Mattawa Grant County · 3,874 people: no figures of its own in the FBI’s tables for 2023–2025.
  • McChord AFB Pierce County · 2,999 people: no figures of its own in the FBI’s tables for 2023–2025.
  • Mead Spokane County · 6,893 people: no figures of its own in the FBI’s tables for 2023–2025.
  • Meadowdale Snohomish County · 3,009 people: no figures of its own in the FBI’s tables for 2023–2025.
  • Medical Lake Spokane County · 4,964 people: no figures of its own in the FBI’s tables for 2023–2025.
  • Midland Pierce County · 9,050 people: no figures of its own in the FBI’s tables for 2023–2025.
  • Mill Creek Snohomish County · 20,902 people: figures for 2023 and 2024 only (all three years are needed).
  • Mill Creek East Snohomish County · 25,453 people: no figures of its own in the FBI’s tables for 2023–2025.
  • Minnehaha Clark County · 11,482 people: no figures of its own in the FBI’s tables for 2023–2025.
  • Mirrormont King County · 4,019 people: no figures of its own in the FBI’s tables for 2023–2025.
  • Moses Lake North Grant County · 4,517 people: no figures of its own in the FBI’s tables for 2023–2025.
  • Mount Vista Clark County · 10,764 people: no figures of its own in the FBI’s tables for 2023–2025.
  • Navy Yard City Kitsap County · 2,672 people: no figures of its own in the FBI’s tables for 2023–2025.
  • North Fort Lewis Pierce County · 6,337 people: no figures of its own in the FBI’s tables for 2023–2025.
  • North Lynnwood Snohomish County · 23,339 people: no figures of its own in the FBI’s tables for 2023–2025.
  • North Yelm Thurston County · 2,522 people: no figures of its own in the FBI’s tables for 2023–2025.
  • Omak Okanogan County · 5,185 people: no figures of its own in the FBI’s tables for 2023–2025.
  • Orchards Clark County · 29,438 people: no figures of its own in the FBI’s tables for 2023–2025.
  • Otis Orchards-East Farms Spokane County · 5,454 people: no figures of its own in the FBI’s tables for 2023–2025.
  • Parkland Pierce County · 38,742 people: no figures of its own in the FBI’s tables for 2023–2025.
  • Parkwood Kitsap County · 6,873 people: no figures of its own in the FBI’s tables for 2023–2025.
  • Peaceful Valley Whatcom County · 2,858 people: no figures of its own in the FBI’s tables for 2023–2025.
  • Picnic Point Snohomish County · 10,261 people: no figures of its own in the FBI’s tables for 2023–2025.
  • Port Angeles East Clallam County · 3,137 people: no figures of its own in the FBI’s tables for 2023–2025.
  • Port Hadlock-Irondale Jefferson County · 3,884 people: no figures of its own in the FBI’s tables for 2023–2025.
  • Port Ludlow Jefferson County · 2,891 people: no figures of its own in the FBI’s tables for 2023–2025.
  • Prairie Heights Pierce County · 4,998 people: no figures of its own in the FBI’s tables for 2023–2025.
  • Prairie Ridge Pierce County · 12,074 people: no figures of its own in the FBI’s tables for 2023–2025.
  • Quincy Grant County · 8,510 people: figures for 2023 and 2024 only (all three years are needed).
  • Raymond Pacific County · 3,235 people: figures for 2023 and 2024 only (all three years are needed).
  • Rochester Thurston County · 5,834 people: no figures of its own in the FBI’s tables for 2023–2025.
  • Rosedale Pierce County · 4,208 people: no figures of its own in the FBI’s tables for 2023–2025.
  • Salmon Creek Clark County · 20,017 people: no figures of its own in the FBI’s tables for 2023–2025.
  • Silver Firs Snohomish County · 22,306 people: no figures of its own in the FBI’s tables for 2023–2025.
  • Silverdale Kitsap County · 20,685 people: no figures of its own in the FBI’s tables for 2023–2025.
  • Sisco Heights Snohomish County · 3,015 people: no figures of its own in the FBI’s tables for 2023–2025.
  • South Hill Pierce County · 68,025 people: no figures of its own in the FBI’s tables for 2023–2025.
  • Spanaway Pierce County · 34,019 people: no figures of its own in the FBI’s tables for 2023–2025.
  • Sudden Valley Whatcom County · 6,084 people: no figures of its own in the FBI’s tables for 2023–2025.
  • Summit Pierce County · 8,791 people: no figures of its own in the FBI’s tables for 2023–2025.
  • Summit View Pierce County · 8,480 people: no figures of its own in the FBI’s tables for 2023–2025.
  • Suncrest Stevens County · 5,345 people: no figures of its own in the FBI’s tables for 2023–2025.
  • Sunnyslope Chelan County · 3,706 people: no figures of its own in the FBI’s tables for 2023–2025.
  • Suquamish Kitsap County · 4,084 people: no figures of its own in the FBI’s tables for 2023–2025.
  • Tanglewilde Thurston County · 6,314 people: no figures of its own in the FBI’s tables for 2023–2025.
  • Tehaleh Pierce County · 9,561 people: no figures of its own in the FBI’s tables for 2023–2025.
  • Terrace Heights Yakima County · 10,041 people: no figures of its own in the FBI’s tables for 2023–2025.
  • Three Lakes Snohomish County · 4,055 people: no figures of its own in the FBI’s tables for 2023–2025.
  • Town and Country Spokane County · 4,890 people: no figures of its own in the FBI’s tables for 2023–2025.
  • Tracyton Kitsap County · 6,137 people: no figures of its own in the FBI’s tables for 2023–2025.
  • Union Hill-Novelty Hill King County · 23,047 people: no figures of its own in the FBI’s tables for 2023–2025.
  • Vashon King County · 9,934 people: no figures of its own in the FBI’s tables for 2023–2025.
  • Venersborg Clark County · 4,262 people: no figures of its own in the FBI’s tables for 2023–2025.
  • Waller Pierce County · 7,683 people: no figures of its own in the FBI’s tables for 2023–2025.
  • Wapato Yakima County · 4,469 people: no figures of its own in the FBI’s tables for 2023–2025.
  • Warm Beach Snohomish County · 3,442 people: no figures of its own in the FBI’s tables for 2023–2025.
  • Wauna Pierce County · 4,805 people: no figures of its own in the FBI’s tables for 2023–2025.
  • West Clarkston-Highland Asotin County · 5,444 people: no figures of its own in the FBI’s tables for 2023–2025.
  • White Center King County · 14,886 people: no figures of its own in the FBI’s tables for 2023–2025.
  • White Salmon Klickitat County · 2,655 people: figures for 2024 and 2025 only (all three years are needed).
  • Wollochet Pierce County · 6,689 people: no figures of its own in the FBI’s tables for 2023–2025.
  • Woods Creek Snohomish County · 6,943 people: no figures of its own in the FBI’s tables for 2023–2025.
  • Zillah Yakima County · 3,111 people: figures for 2024 only (all three years are needed).
Quick answers

Questions people ask

Which is the safest town in Washington?

Duvall (King County) reports the least crime per resident: 3.25 weighted crimes per 1,000 a year over 2023–2025 (0.34 violent and 1.90 property crimes per 1,000), from its police department’s reports (2023 from the FBI Crime Data Explorer; 2024 from the FBI Crime Data Explorer). Everson (5.60) and Sammamish (5.78) follow.

How are these towns ranked?

By crimes reported by each town’s police per 1,000 residents over three years (FBI figures, or the state’s own where the FBI table lacks a year), with violent crimes counted four times as heavily as property crimes. It is the same measure as the Safety grade on each town’s page. How grades work.

Why isn’t my town on this list?

The list needs 2,500+ residents and the town’s own police figures for all three years. 155 Washington towns of 2,500+ lack them; they are listed above with the reason. Smaller towns have a Safety grade on their page but no rank.

Go deeper

More Washington lists

Every list ranks the same 2,500+ towns, so a town’s rank means the same thing on each.

All Washington rankings →
Other states

Safest towns in other states