Guest, Sign inJoin
Hot springs south dakota welcome signHot Springs, #1 on this list · Photo: devriesm · CC BY 2.0
South Dakota rankings · Safety

Safest towns in South Dakota

Hot Springs reports the least crime per resident of South Dakota’s 23 towns with crime figures for 2023–2025; 2 of the 23 grade A− or better on safety nationally.

Crimes reported by each town’s own police, 2023–2025, per 1,000 residents, violent crimes counted four times. The same measure as the Safety grade. For 1 of them one year isn’t in the FBI’s published tables and comes from the FBI Crime Data Explorer or the state’s own reports (named in the row). How grades work

#1

Hot Springs

Fall River County · 3,670 people
A

5.89 weighted crimes per 1,000 a year·violent 1.2, property 1.2

#2

Lennox

Lincoln County · 2,657 people
A−

8.45 weighted crimes per 1,000 a year·violent 1.4, property 2.6
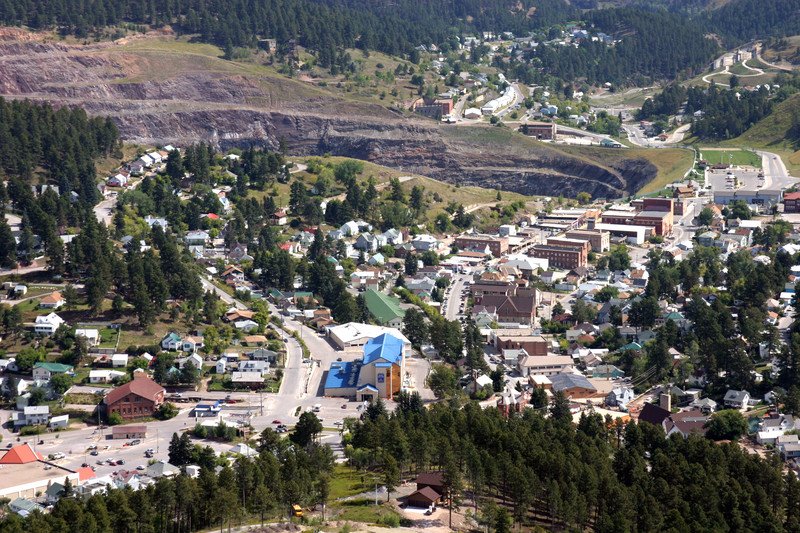
#3

Lead

Lawrence County · 3,064 people
B+

11.16 weighted crimes per 1,000 a year·violent 1.5, property 5.0

All 23 towns

Weighted crimes per 1,000 residents a year, lowest first, to two decimals (the sort uses the exact rate, so there are no rounding ties). Grade = the national Safety grade.

23 towns ranked. Not here? See towns without their own figures.

#TownWeighted rateViolentPropertyGrade
1Hot SpringsFall River County · 3,670 people5.891.21.2A
2LennoxLincoln County · 2,657 people8.451.42.6A−
3LeadLawrence County · 3,064 people11.161.55.0B+
4SummersetMeade County · 3,030 people11.400.97.9B+
5WinnerTripp County · 2,969 people12.201.46.7B+
6MadisonLake County · 6,065 people13.511.48.0B
7BrookingsBrookings County · 25,355 people14.731.010.7B
8TeaLincoln County · 8,019 people15.831.410.3B
9CantonLincoln County · 3,001 people · 2024 from the FBI Crime Data Explorer19.372.210.5B−
10VermillionClay County · 11,720 people20.281.912.7B−
11WatertownCodington County · 23,736 people21.722.611.4C+
12Belle FourcheButte County · 5,791 people23.002.214.2C+
13North Sioux CityUnion County · 3,036 people25.082.216.3C+
14HuronBeadle County · 14,607 people26.572.516.4C
15SpearfishLawrence County · 14,154 people28.252.319.1C
16Box ElderPennington County · 13,936 people28.593.614.0C
17YanktonYankton County · 15,816 people30.332.719.4C
18AberdeenBrown County · 27,961 people30.664.014.7C
19MitchellDavison County · 15,756 people30.682.919.2C
20SturgisMeade County · 6,922 people34.063.221.4C−
21PierreHughes County · 13,848 people40.715.120.4C−
22Sioux FallsMinnehaha County · 213,748 people42.774.425.1D
23Rapid CityPennington County · 80,589 people67.467.437.8D−

Per 1,000 residents a year, 2023–2025. Last on the list: Rapid City, 67.46. The rate counts crimes reported to police, not how safe any one street feels.

Not ranked

12 towns without figures of their own

These towns of 2,500+ are not on the list because there are no police figures for them alone for all of 2023–2025, from the FBI or the state. In 2025 the FBI’s tables list State Police figures for 0 of South Dakota’s counties and county sheriff figures for 44; those cover many towns at once and can’t be split by town, so they aren’t ranked here. Their other grades stand; the overall grade uses the rest.

  • Big Sioux Township Union County · 5,152 people: no figures of its own in the FBI’s tables for 2023–2025.
  • Blackhawk Meade County · 2,934 people: no figures of its own in the FBI’s tables for 2023–2025.
  • Brandon Minnehaha County · 11,306 people: figures for 2024 and 2025 only (all three years are needed).
  • Colonial Pine Hills Pennington County · 2,609 people: no figures of its own in the FBI’s tables for 2023–2025.
  • Dakota Dunes Union County · 3,936 people: no figures of its own in the FBI’s tables for 2023–2025.
  • Dell Rapids Minnehaha County · 3,852 people: no figures of its own in the FBI’s tables for 2023–2025.
  • Harrisburg Lincoln County · 10,405 people: no figures of its own in the FBI’s tables for 2023–2025.
  • Hartford Minnehaha County · 3,635 people: no figures of its own in the FBI’s tables for 2023–2025.
  • Milbank Grant County · 3,512 people: no figures of its own in the FBI’s tables for 2023–2025.
  • Mobridge Walworth County · 3,192 people: figures for 2024 and 2025 only (all three years are needed).
  • Rapid Valley Pennington County · 6,975 people: no figures of its own in the FBI’s tables for 2023–2025.
  • Split Rock Township Minnehaha County · 3,086 people: no figures of its own in the FBI’s tables for 2023–2025.
Quick answers

Questions people ask

Which is the safest town in South Dakota?

Hot Springs (Fall River County) reports the least crime per resident: 5.89 weighted crimes per 1,000 a year over 2023–2025 (1.18 violent and 1.18 property crimes per 1,000), from its police department’s reports to the FBI. Lennox (8.45) and Lead (11.16) follow.

How are these towns ranked?

By crimes reported by each town’s police per 1,000 residents over three years (FBI figures, or the state’s own where the FBI table lacks a year), with violent crimes counted four times as heavily as property crimes. It is the same measure as the Safety grade on each town’s page. How grades work.

Why isn’t my town on this list?

The list needs 2,500+ residents and the town’s own police figures for all three years. 12 South Dakota towns of 2,500+ lack them; they are listed above with the reason. Smaller towns have a Safety grade on their page but no rank.

Go deeper

More South Dakota lists

Every list ranks the same 2,500+ towns, so a town’s rank means the same thing on each.

All South Dakota rankings →
Other states

Safest towns in other states