Guest, Sign inJoin
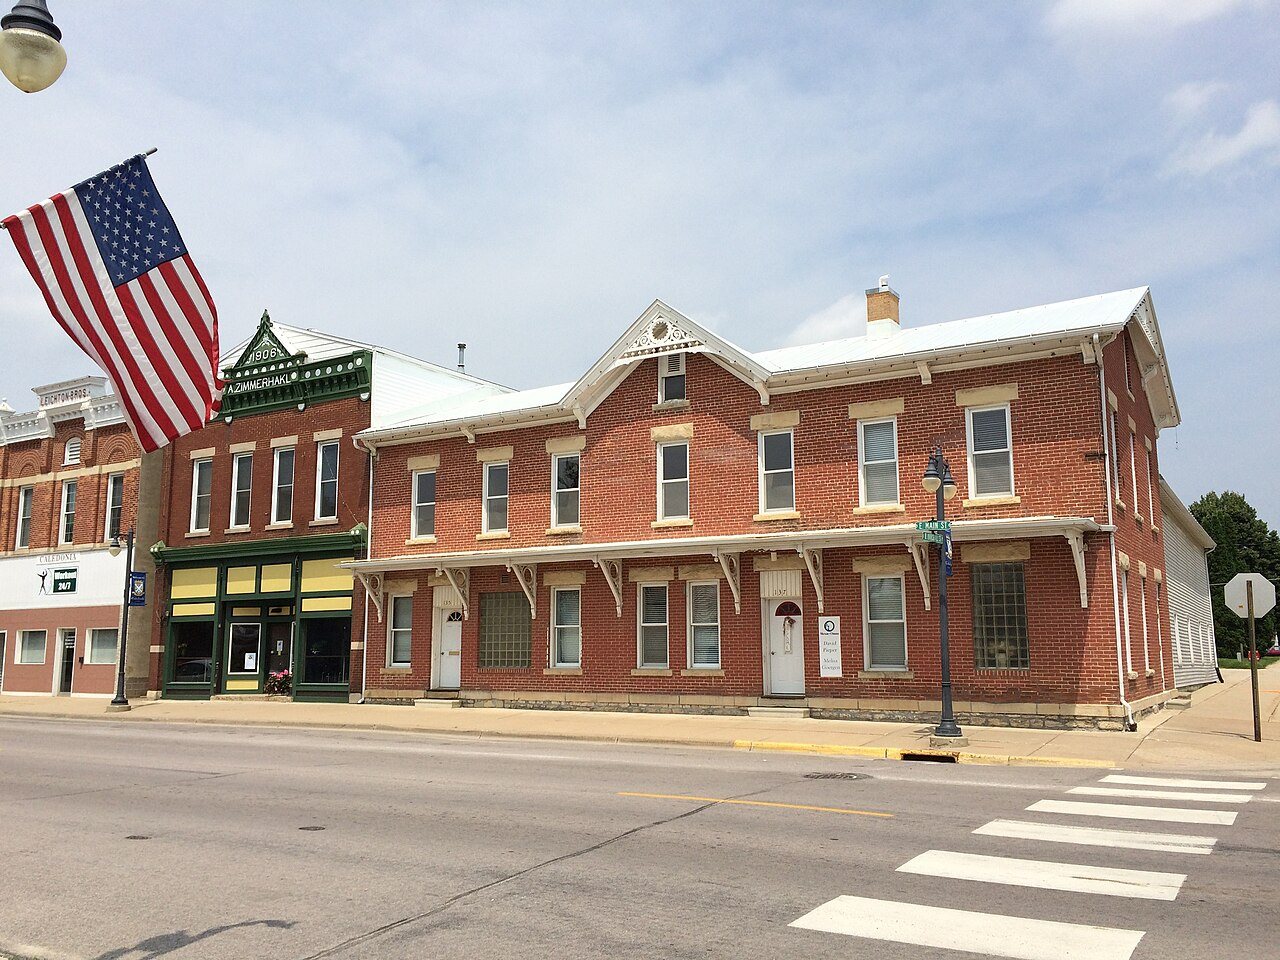
Williams, Spafford, HotelCaledonia, #1 on this list · Williams, Spafford, Hotel · Photo: Jon Roanhaus · CC BY-SA 3.0
Minnesota rankings · Safety

Safest towns in Minnesota

Caledonia reports the least crime per resident of Minnesota’s 166 towns with crime figures for 2023–2025; 49 of the 166 grade A− or better on safety nationally.

Crimes reported by each town’s own police, 2023–2025, per 1,000 residents, violent crimes counted four times. The same measure as the Safety grade. For 1 of them one year isn’t in the FBI’s published tables and comes from the FBI Crime Data Explorer or the state’s own reports (named in the row). How grades work

#T1

Caledonia

Houston County · 2,768 people
A+

0.00 weighted crimes per 1,000 a year·violent 0.0, property 0.0
#T1

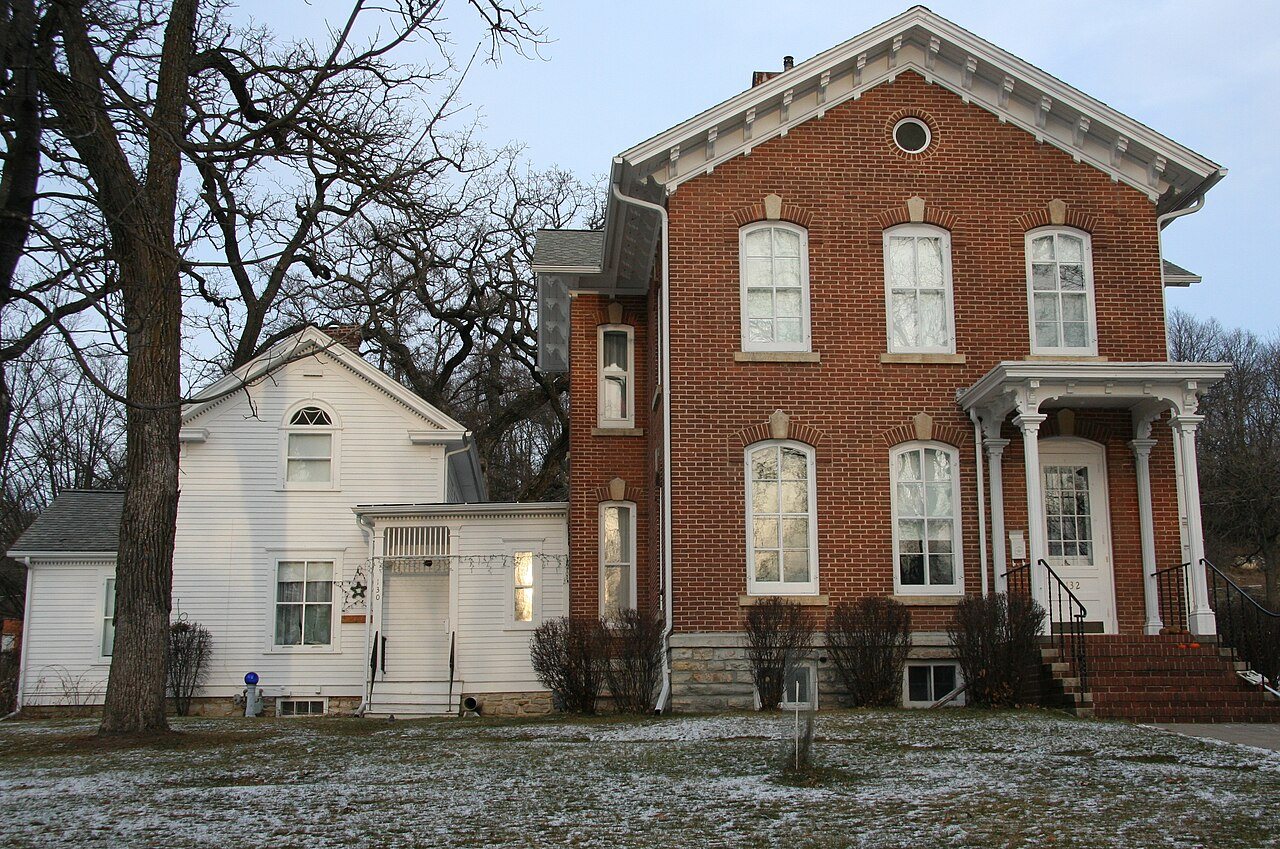
Chatfield

Fillmore County · 3,018 people
A+

0.00 weighted crimes per 1,000 a year·violent 0.0, property 0.0
#T1

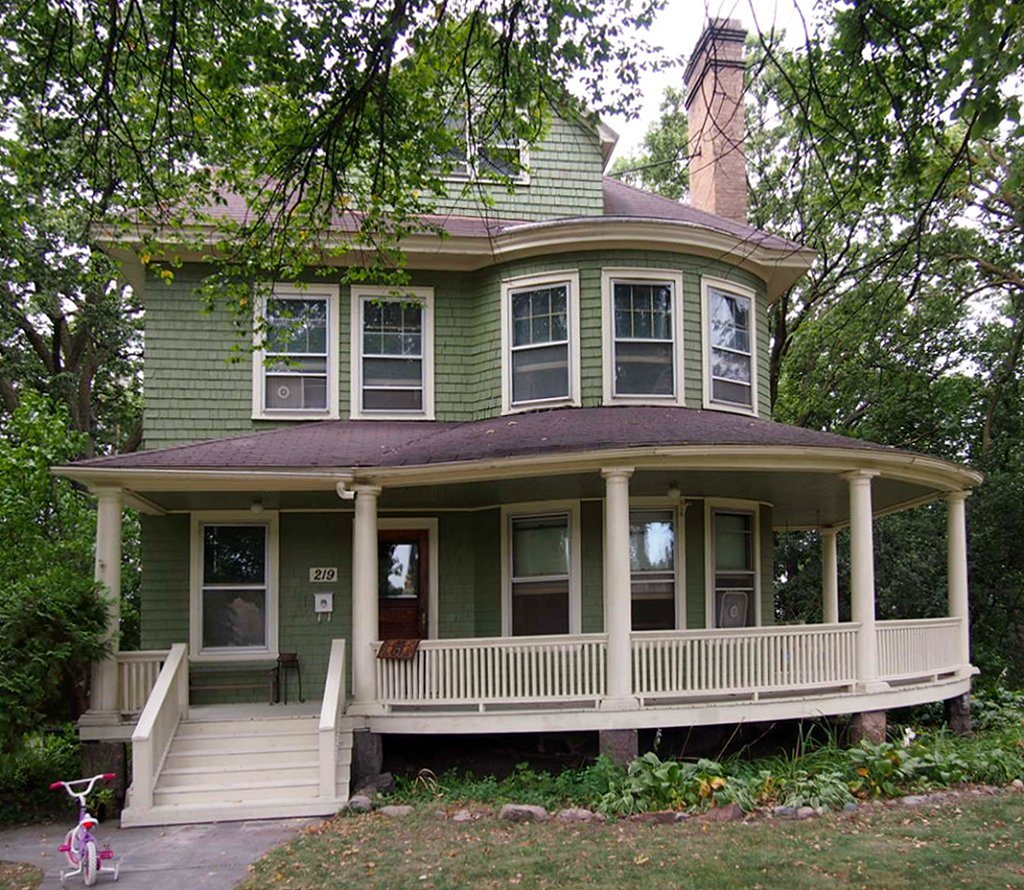
Montevideo

Chippewa County · 5,335 people
A+

0.00 weighted crimes per 1,000 a year·violent 0.0, property 0.0

All 166 towns

Weighted crimes per 1,000 residents a year, lowest first, to two decimals (the sort uses the exact rate, so there are no rounding ties). Grade = the national Safety grade.

166 towns ranked. Not here? See towns without their own figures.

#TownWeighted rateViolentPropertyGrade
T1CaledoniaHouston County · 2,768 people0.000.00.0A+
T1ChatfieldFillmore County · 3,018 people0.000.00.0A+
T1MontevideoChippewa County · 5,335 people0.000.00.0A+
4GoodviewWinona County · 4,122 people0.490.10.2A+
5MontgomeryLe Sueur County · 3,539 people1.940.50.1A+
6Le CenterLe Sueur County · 2,524 people · 2023 from the FBI Crime Data Explorer2.650.50.5A+
7Breezy PointCrow Wing County · 2,771 people2.740.41.3A+
8DeephavenHennepin County · 3,794 people3.940.23.2A+
9CorcoranHennepin County · 9,269 people3.950.32.7A+
10LonsdaleRice County · 5,117 people4.020.52.2A
11Pelican RapidsOtter Tail County · 2,608 people4.100.90.5A
12BayportWashington County · 3,721 people4.270.33.2A
13Le SueurLe Sueur County · 4,210 people4.730.71.9A
14La CrescentHouston County · 5,261 people4.980.33.7A
15Two HarborsLake County · 3,443 people5.160.53.2A
16MinnetristaHennepin County · 9,458 people5.430.43.9A
17PlainviewWabasha County · 3,482 people5.581.01.8A
18BarnesvilleClay County · 2,767 people5.650.72.8A
19DaytonHennepin County · 11,402 people5.990.44.6A
20North BranchChisago County · 12,398 people6.170.73.2A
21FarmingtonDakota County · 25,425 people6.430.83.3A
22MedinaHennepin County · 7,460 people6.480.54.6A
23PaynesvilleStearns County · 2,591 people6.591.31.5A
24East Grand ForksPolk County · 8,906 people6.630.92.9A
25BuffaloWright County · 16,878 people6.650.54.6A
26AlbanyStearns County · 2,873 people6.751.41.2A
27RamseyAnoka County · 29,624 people6.870.54.8A
28RosemountDakota County · 31,881 people6.900.64.6A
29ZumbrotaGoodhue County · 4,072 people6.990.74.1A
30HibbingSt. Louis County · 15,823 people7.260.26.3A−
31New PragueScott County · 8,238 people7.320.64.8A−
32Belle PlaineScott County · 7,632 people7.460.74.8A−
33AnnandaleWright County · 3,801 people7.530.74.8A−
34Big LakeSherburne County · 12,929 people7.600.94.0A−
35Lino LakesAnoka County · 23,220 people7.640.46.1A−
36JordanScott County · 6,988 people7.960.94.4A−
37MelroseStearns County · 3,888 people8.021.61.6A−
38OronoHennepin County · 8,301 people8.100.94.4A−
39Sleepy EyeBrown County · 3,461 people8.461.42.7A−
40IsantiIsanti County · 7,714 people8.600.85.6A−
41BeckerSherburne County · 5,425 people8.630.85.3A−
42Cottage GroveWashington County · 43,604 people9.000.66.6A−
43ChaskaCarver County · 30,513 people9.170.85.9A−
44LakevilleDakota County · 79,270 people9.400.95.9A−
45St. PeterNicollet County · 12,275 people9.460.96.0A−
46New UlmBrown County · 13,863 people9.500.47.8A−
47KassonDodge County · 7,350 people9.601.24.6A−
48BensonSwift County · 3,444 people9.852.30.5A−
49WyomingChisago County · 8,121 people9.951.06.0A−
50Lake CityWabasha County · 5,306 people10.190.87.2B+
51Blue EarthFaribault County · 3,165 people10.531.93.0B+
52GlenwoodPope County · 2,631 people10.581.45.0B+
53SavageScott County · 32,970 people10.760.97.2B+
54ProctorSt. Louis County · 3,054 people10.930.97.5B+
55Long PrairieTodd County · 3,830 people11.011.54.9B+
56StillwaterWashington County · 19,354 people11.390.97.9B+
57Golden ValleyHennepin County · 21,325 people11.690.88.7B+
58St. FrancisAnoka County · 8,635 people11.971.46.5B+
59PlymouthHennepin County · 78,942 people12.320.69.8B+
60Elk RiverSherburne County · 27,896 people12.780.99.3B+
61GlencoeMcLeod County · 5,632 people12.931.37.7B+
62St. JosephStearns County · 6,846 people12.941.76.2B+
63Sauk CentreStearns County · 4,663 people12.940.610.6B+
64Grand RapidsItasca County · 11,181 people13.041.18.8B+
65St. JamesWatonwan County · 4,863 people13.151.57.2B+
66ChamplinHennepin County · 23,125 people13.200.99.7B
67CloquetCarlton County · 12,399 people13.521.95.9B
68Cannon FallsGoodhue County · 4,209 people13.961.38.9B
69Granite FallsYellow Medicine County · 2,691 people14.602.25.6B
70HastingsDakota County · 22,563 people14.671.210.0B
71St. Paul ParkWashington County · 5,396 people14.852.16.4B
72Eden PrairieHennepin County · 63,075 people14.940.612.4B
73OwatonnaSteele County · 26,633 people14.971.87.8B
74ElySt. Louis County · 3,231 people15.151.97.7B
75WoodburyWashington County · 81,558 people15.180.812.1B
76Mendota HeightsDakota County · 11,475 people15.631.49.9B
77North MankatoNicollet County · 14,165 people15.651.78.8B
78Prior LakeScott County · 28,140 people15.781.211.0B
79New BrightonRamsey County · 22,159 people15.861.011.7B
80SartellStearns County · 19,918 people16.210.613.8B
81CambridgeIsanti County · 11,090 people16.320.514.3B
82MarshallLyon County · 14,171 people16.512.56.3B
83Mounds ViewRamsey County · 12,786 people16.611.710.0B
84ShakopeeScott County · 49,366 people16.761.112.2B−
85WayzataHennepin County · 4,344 people16.871.211.9B−
86NorthfieldRice County · 21,992 people16.941.510.8B−
87LitchfieldMeeker County · 6,528 people17.151.710.2B−
88BlaineAnoka County · 76,603 people17.280.814.1B−
89Sauk RapidsBenton County · 13,768 people17.771.312.7B−
90WasecaWaseca County · 9,035 people17.871.711.2B−
91BreckenridgeWilkin County · 3,323 people17.993.44.2B−
92WindomCottonwood County · 4,817 people18.122.77.5B−
93Forest LakeWashington County · 20,952 people18.130.914.6B−
94White Bear LakeRamsey County · 23,392 people18.161.113.8B−
95EdinaHennepin County · 54,356 people18.180.715.4B−
96Thief River FallsPennington County · 8,799 people18.591.712.0B−
97HutchinsonMcLeod County · 14,655 people18.992.210.3B−
98PrincetonMille Lacs County · 5,480 people19.140.915.5B−
99MinnetonkaHennepin County · 53,969 people19.401.015.4B−
100RoseauRoseau County · 2,685 people20.513.18.2B−
101Redwood FallsRedwood County · 5,040 people20.672.311.4B−
102Maple GroveHennepin County · 73,893 people20.671.116.4B−
103AnokaAnoka County · 18,169 people20.752.411.1B−
104AlexandriaDouglas County · 15,045 people20.912.211.9C+
105Inver Grove HeightsDakota County · 36,873 people20.961.714.2C+
106RochesterOlmsted County · 124,292 people21.301.714.6C+
107EaganDakota County · 67,109 people21.491.116.9C+
108MilacaMille Lacs County · 3,041 people21.511.615.0C+
109WabashaWabasha County · 2,599 people21.752.412.0C+
110RogersHennepin County · 15,606 people21.851.017.7C+
111WorthingtonNobles County · 13,979 people21.953.29.2C+
112OakdaleWashington County · 30,588 people22.311.516.2C+
113FaribaultRice County · 25,040 people22.452.711.6C+
114Coon RapidsAnoka County · 64,193 people22.571.815.4C+
115Little FallsMorrison County · 9,277 people22.591.416.9C+
116OsseoHennepin County · 2,534 people22.620.520.5C+
117CrookstonPolk County · 7,375 people22.703.68.1C+
118StaplesTodd County · 3,074 people22.761.218.0C+
119FoleyBenton County · 2,650 people22.881.417.5C+
120FairmontMartin County · 10,099 people23.842.314.5C+
121Detroit LakesBecker County · 10,019 people23.921.916.2C+
122New HopeHennepin County · 20,807 people24.011.318.8C+
123WadenaWadena County · 4,341 people24.112.613.7C+
124South St. PaulDakota County · 20,532 people24.172.614.0C+
125AustinMower County · 26,689 people24.582.016.5C+
126Spring Lake ParkAnoka County · 7,127 people24.741.817.7C+
127HopkinsHennepin County · 19,523 people24.992.714.3C+
128Apple ValleyDakota County · 55,248 people25.232.216.5C+
129North St. PaulRamsey County · 12,780 people25.731.918.2C+
130Albert LeaFreeborn County · 18,217 people25.961.918.3C
131ChisholmSt. Louis County · 4,625 people26.162.516.2C
132International FallsKoochiching County · 5,481 people26.184.58.1C
133BurnsvilleDakota County · 65,244 people26.402.117.9C
134HermantownSt. Louis County · 10,110 people26.680.624.1C
135Red WingGoodhue County · 16,805 people26.942.019.1C
136WinonaWinona County · 26,530 people28.771.622.2C
137Columbia HeightsAnoka County · 22,482 people29.442.917.7C
138WillmarKandiyohi County · 22,001 people29.654.013.5C
139BaxterCrow Wing County · 9,217 people30.531.524.5C
140RobbinsdaleHennepin County · 14,030 people31.243.616.7C
141RichfieldHennepin County · 36,593 people31.672.322.3C
142Fergus FallsOtter Tail County · 14,246 people31.732.123.5C
143MoorheadClay County · 46,533 people32.624.016.6C−
144Park RapidsHubbard County · 4,447 people33.343.619.0C−
145CrystalHennepin County · 22,239 people33.602.921.8C−
146St. AnthonyHennepin County · 9,989 people34.051.627.5C−
147Oak Park HeightsWashington County · 4,625 people34.232.623.9C−
148BrainerdCrow Wing County · 14,428 people35.324.218.6C−
149VirginiaSt. Louis County · 8,187 people35.763.521.7C−
150MankatoBlue Earth County · 46,529 people36.512.825.2C−
151Brooklyn ParkHennepin County · 83,543 people37.313.423.7C−
152St. Louis ParkHennepin County · 50,027 people38.151.532.2C−
153EvelethSt. Louis County · 3,381 people38.343.823.1C−
154DuluthSt. Louis County · 88,330 people39.182.429.7C−
155FridleyAnoka County · 30,829 people42.682.731.9D
156MaplewoodRamsey County · 40,717 people44.024.027.8D
157St. CloudStearns County · 72,647 people44.243.729.5D
158BloomingtonHennepin County · 89,034 people46.013.034.0D
159West St. PaulDakota County · 21,950 people49.252.140.9D
160Brooklyn CenterHennepin County · 31,846 people51.786.526.0D
161St. PaulRamsey County · 306,684 people52.065.829.0D
162Waite ParkStearns County · 8,450 people58.811.951.2D
163DilworthClay County · 4,823 people64.141.657.8D
164BemidjiBeltrami County · 15,770 people77.726.750.8D−
165RosevilleRamsey County · 35,663 people86.703.473.0D−
166MinneapolisHennepin County · 430,324 people93.4711.049.6D−

Per 1,000 residents a year, 2023–2025. Last on the list: Minneapolis, 93.47. The rate counts crimes reported to police, not how safe any one street feels.

Not ranked

108 towns without figures of their own

These towns of 2,500+ are not on the list because there are no police figures for them alone for all of 2023–2025, from the FBI or the state. In 2025 the FBI’s tables list State Police figures for 0 of Minnesota’s counties and county sheriff figures for 83; those cover many towns at once and can’t be split by town, so they aren’t ranked here. Their other grades stand; the overall grade uses the rest.

  • Afton Washington County · 2,960 people: no figures of its own in the FBI’s tables for 2023–2025.
  • Albertville Wright County · 8,544 people: no figures of its own in the FBI’s tables for 2023–2025.
  • Alexandria Township Douglas County · 3,114 people: no figures of its own in the FBI’s tables for 2023–2025.
  • Andover Anoka County · 33,874 people: no figures of its own in the FBI’s tables for 2023–2025.
  • Arden Hills Ramsey County · 9,583 people: no figures of its own in the FBI’s tables for 2023–2025.
  • Baldwin · 7,231 people: no figures of its own in the FBI’s tables for 2023–2025.
  • Bemidji Township Beltrami County · 4,031 people: no figures of its own in the FBI’s tables for 2023–2025.
  • Big Lake Township Sherburne County · 8,283 people: no figures of its own in the FBI’s tables for 2023–2025.
  • Blue Hill Township Sherburne County · 2,625 people: no figures of its own in the FBI’s tables for 2023–2025.
  • Bradford Township Isanti County · 3,549 people: no figures of its own in the FBI’s tables for 2023–2025.
  • Brockway Township Stearns County · 3,016 people: no figures of its own in the FBI’s tables for 2023–2025.
  • Byron Olmsted County · 6,740 people: no figures of its own in the FBI’s tables for 2023–2025.
  • Cambridge Township Isanti County · 2,592 people: no figures of its own in the FBI’s tables for 2023–2025.
  • Carver Carver County · 7,198 people: no figures of its own in the FBI’s tables for 2023–2025.
  • Cascade Township Olmsted County · 2,810 people: no figures of its own in the FBI’s tables for 2023–2025.
  • Cedar Lake Township Scott County · 3,080 people: no figures of its own in the FBI’s tables for 2023–2025.
  • Centerville Anoka County · 3,978 people: no figures of its own in the FBI’s tables for 2023–2025.
  • Chanhassen Carver County · 25,748 people: no figures of its own in the FBI’s tables for 2023–2025.
  • Chisago City Chisago County · 5,955 people: no figures of its own in the FBI’s tables for 2023–2025.
  • Chisago Lake Township Chisago County · 4,958 people: no figures of its own in the FBI’s tables for 2023–2025.
  • Circle Pines Anoka County · 4,967 people: no figures of its own in the FBI’s tables for 2023–2025.
  • Cohasset Itasca County · 2,728 people: no figures of its own in the FBI’s tables for 2023–2025.
  • Cokato Wright County · 2,793 people: no figures of its own in the FBI’s tables for 2023–2025.
  • Cold Spring Stearns County · 4,329 people: no figures of its own in the FBI’s tables for 2023–2025.
  • Collegeville Township Stearns County · 3,262 people: no figures of its own in the FBI’s tables for 2023–2025.
  • Columbus Anoka County · 4,356 people: no figures of its own in the FBI’s tables for 2023–2025.
  • Corinna Township Wright County · 2,596 people: no figures of its own in the FBI’s tables for 2023–2025.
  • Credit River · 5,644 people: no figures of its own in the FBI’s tables for 2023–2025.
  • Delano Wright County · 7,788 people: no figures of its own in the FBI’s tables for 2023–2025.
  • Dodge Center Dodge County · 2,951 people: no figures of its own in the FBI’s tables for 2023–2025.
  • Eagle Lake Blue Earth County · 3,357 people: no figures of its own in the FBI’s tables for 2023–2025.
  • East Bethel Anoka County · 12,605 people: no figures of its own in the FBI’s tables for 2023–2025.
  • Elko New Market Scott County · 5,300 people: figures for 2024 and 2025 only (all three years are needed).
  • Empire · 3,063 people: no figures of its own in the FBI’s tables for 2023–2025.
  • Falcon Heights Ramsey County · 5,071 people: no figures of its own in the FBI’s tables for 2023–2025.
  • Franklin Township Wright County · 2,939 people: no figures of its own in the FBI’s tables for 2023–2025.
  • Grand Lake Township St. Louis County · 2,705 people: no figures of its own in the FBI’s tables for 2023–2025.
  • Grant Washington County · 3,954 people: no figures of its own in the FBI’s tables for 2023–2025.
  • Greenfield Hennepin County · 2,962 people: no figures of its own in the FBI’s tables for 2023–2025.
  • Ham Lake Anoka County · 17,104 people: no figures of its own in the FBI’s tables for 2023–2025.
  • Hanover Wright County · 4,392 people: no figures of its own in the FBI’s tables for 2023–2025.
  • Harris Township Itasca County · 3,364 people: no figures of its own in the FBI’s tables for 2023–2025.
  • Hugo Washington County · 17,167 people: no figures of its own in the FBI’s tables for 2023–2025.
  • Independence Hennepin County · 3,763 people: no figures of its own in the FBI’s tables for 2023–2025.
  • Jackson Jackson County · 3,305 people: no figures of its own in the FBI’s tables for 2023–2025.
  • La Grand Township Douglas County · 4,309 people: no figures of its own in the FBI’s tables for 2023–2025.
  • Lake Elmo Washington County · 14,376 people: no figures of its own in the FBI’s tables for 2023–2025.
  • Lexington Anoka County · 3,081 people: no figures of its own in the FBI’s tables for 2023–2025.
  • Lindstrom Chisago County · 5,039 people: no figures of its own in the FBI’s tables for 2023–2025.
  • Linwood Township Anoka County · 5,403 people: no figures of its own in the FBI’s tables for 2023–2025.
  • Little Canada Ramsey County · 10,567 people: no figures of its own in the FBI’s tables for 2023–2025.
  • Livonia Township Sherburne County · 6,436 people: no figures of its own in the FBI’s tables for 2023–2025.
  • Luverne Rock County · 4,984 people: no figures of its own in the FBI’s tables for 2023–2025.
  • Mahtomedi Washington County · 8,189 people: no figures of its own in the FBI’s tables for 2023–2025.
  • Marion Township Olmsted County · 4,111 people: no figures of its own in the FBI’s tables for 2023–2025.
  • May Township Washington County · 2,638 people: no figures of its own in the FBI’s tables for 2023–2025.
  • Mayer Carver County · 2,563 people: no figures of its own in the FBI’s tables for 2023–2025.
  • Monticello Wright County · 15,670 people: no figures of its own in the FBI’s tables for 2023–2025.
  • Monticello Township Wright County · 3,374 people: no figures of its own in the FBI’s tables for 2023–2025.
  • Montrose Wright County · 3,986 people: no figures of its own in the FBI’s tables for 2023–2025.
  • Moose Lake Carlton County · 2,948 people: figures for 2023 only (all three years are needed).
  • Mora Kanabec County · 3,763 people: no figures of its own in the FBI’s tables for 2023–2025.
  • Morris Stevens County · 5,150 people: no figures of its own in the FBI’s tables for 2023–2025.
  • Mound Hennepin County · 9,064 people: no figures of its own in the FBI’s tables for 2023–2025.
  • Mountain Iron St. Louis County · 2,835 people: no figures of its own in the FBI’s tables for 2023–2025.
  • New London Township Kandiyohi County · 2,965 people: no figures of its own in the FBI’s tables for 2023–2025.
  • New Market Township Scott County · 3,574 people: no figures of its own in the FBI’s tables for 2023–2025.
  • Newport Washington County · 5,525 people: no figures of its own in the FBI’s tables for 2023–2025.
  • North Oaks Ramsey County · 5,283 people: no figures of its own in the FBI’s tables for 2023–2025.
  • Northern Township Beltrami County · 3,701 people: no figures of its own in the FBI’s tables for 2023–2025.
  • Norwood Young America Carver County · 3,777 people: no figures of its own in the FBI’s tables for 2023–2025.
  • Nowthen Anoka County · 4,630 people: no figures of its own in the FBI’s tables for 2023–2025.
  • Oak Grove Anoka County · 9,476 people: no figures of its own in the FBI’s tables for 2023–2025.
  • Orrock Township Sherburne County · 3,698 people: no figures of its own in the FBI’s tables for 2023–2025.
  • Otsego Wright County · 24,525 people: no figures of its own in the FBI’s tables for 2023–2025.
  • Palmer Township Sherburne County · 2,633 people: no figures of its own in the FBI’s tables for 2023–2025.
  • Perham Otter Tail County · 3,746 people: figures for 2023 and 2024 only (all three years are needed).
  • Pine City Pine County · 3,820 people: no figures of its own in the FBI’s tables for 2023–2025.
  • Pine Island Goodhue County · 3,911 people: no figures of its own in the FBI’s tables for 2023–2025.
  • Pipestone Pipestone County · 4,100 people: no figures of its own in the FBI’s tables for 2023–2025.
  • Pokegama Township Pine County · 2,884 people: no figures of its own in the FBI’s tables for 2023–2025.
  • Rice Lake St. Louis County · 4,169 people: no figures of its own in the FBI’s tables for 2023–2025.
  • Rockford Wright County · 4,827 people: no figures of its own in the FBI’s tables for 2023–2025.
  • Rockford Township Wright County · 3,474 people: no figures of its own in the FBI’s tables for 2023–2025.
  • Rush City Chisago County · 3,300 people: no figures of its own in the FBI’s tables for 2023–2025.
  • Sandstone Pine County · 2,543 people: no figures of its own in the FBI’s tables for 2023–2025.
  • Scandia Washington County · 3,979 people: no figures of its own in the FBI’s tables for 2023–2025.
  • Shoreview Ramsey County · 26,906 people: no figures of its own in the FBI’s tables for 2023–2025.
  • Shorewood Hennepin County · 7,620 people: no figures of its own in the FBI’s tables for 2023–2025.
  • Silver Creek Township Wright County · 2,620 people: no figures of its own in the FBI’s tables for 2023–2025.
  • Spring Lake Township Scott County · 3,498 people: no figures of its own in the FBI’s tables for 2023–2025.
  • St. Augusta Stearns County · 3,799 people: no figures of its own in the FBI’s tables for 2023–2025.
  • St. Charles Winona County · 4,090 people: figures for 2023 and 2024 only (all three years are needed).
  • St. Michael Wright County · 22,498 people: no figures of its own in the FBI’s tables for 2023–2025.
  • Stacy Chisago County · 4,367 people: no figures of its own in the FBI’s tables for 2023–2025.
  • Stewartville Olmsted County · 6,850 people: no figures of its own in the FBI’s tables for 2023–2025.
  • Sylvan Township Cass County · 3,030 people: no figures of its own in the FBI’s tables for 2023–2025.
  • Thomson Township Carlton County · 5,624 people: no figures of its own in the FBI’s tables for 2023–2025.
  • Vadnais Heights Ramsey County · 13,052 people: no figures of its own in the FBI’s tables for 2023–2025.
  • Victoria Carver County · 12,447 people: no figures of its own in the FBI’s tables for 2023–2025.
  • Waconia Carver County · 14,113 people: no figures of its own in the FBI’s tables for 2023–2025.
  • Wakefield Township Stearns County · 2,829 people: no figures of its own in the FBI’s tables for 2023–2025.
  • Watab Township Benton County · 3,478 people: no figures of its own in the FBI’s tables for 2023–2025.
  • Watertown Carver County · 4,789 people: no figures of its own in the FBI’s tables for 2023–2025.
  • West Lakeland Township Washington County · 3,931 people: no figures of its own in the FBI’s tables for 2023–2025.
  • White Bear Township Ramsey County · 10,399 people: no figures of its own in the FBI’s tables for 2023–2025.
  • White Township St. Louis County · 3,088 people: no figures of its own in the FBI’s tables for 2023–2025.
  • Zimmerman Sherburne County · 6,904 people: no figures of its own in the FBI’s tables for 2023–2025.
Quick answers

Questions people ask

Which is the safest town in Minnesota?

Caledonia (Houston County) reports the least crime per resident: 0.00 weighted crimes per 1,000 a year over 2023–2025 (0.00 violent and 0.00 property crimes per 1,000), from its police department’s reports to the FBI. Chatfield (0.00) and Montevideo (0.00) follow.

How are these towns ranked?

By crimes reported by each town’s police per 1,000 residents over three years (FBI figures, or the state’s own where the FBI table lacks a year), with violent crimes counted four times as heavily as property crimes. It is the same measure as the Safety grade on each town’s page. How grades work.

Why isn’t my town on this list?

The list needs 2,500+ residents and the town’s own police figures for all three years. 108 Minnesota towns of 2,500+ lack them; they are listed above with the reason. Smaller towns have a Safety grade on their page but no rank.

Go deeper

More Minnesota lists

Every list ranks the same 2,500+ towns, so a town’s rank means the same thing on each.

All Minnesota rankings →
Other states

Safest towns in other states