Guest, Sign inJoin
North Carolina rankings · Safety

Safest towns in North Carolina

Whispering Pines reports the least crime per resident of North Carolina’s 163 towns with crime figures for 2023–2025; 9 of the 163 grade A− or better on safety nationally.

Crimes reported by each town’s own police, 2023–2025, per 1,000 residents, violent crimes counted four times. The same measure as the Safety grade. For 27 of them one year isn’t in the FBI’s published tables and comes from the FBI Crime Data Explorer or the state’s own reports (named in the row). How grades work

#2

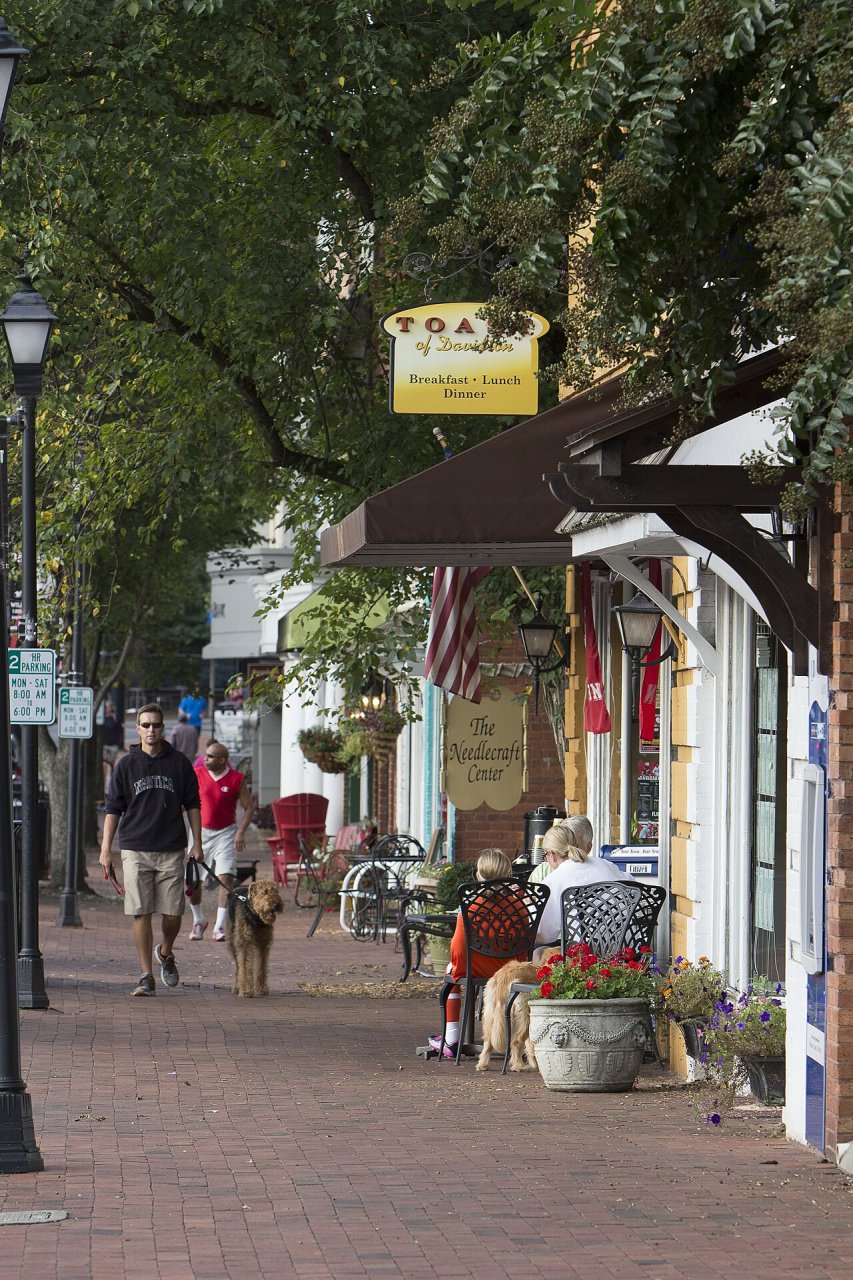
Davidson

Mecklenburg County · 16,662 people
A

4.72 weighted crimes per 1,000 a year·violent 0.3, property 3.6

#3

Pinehurst

Moore County · 18,670 people
A

5.05 weighted crimes per 1,000 a year·violent 0.5, property 3.0

All 163 towns

Weighted crimes per 1,000 residents a year, lowest first, to two decimals (the sort uses the exact rate, so there are no rounding ties). Grade = the national Safety grade.

163 towns ranked. Not here? See towns without their own figures.

#TownWeighted rateViolentPropertyGrade
1Whispering PinesMoore County · 5,505 people2.940.12.7A+
2DavidsonMecklenburg County · 16,662 people4.720.33.6A
3PinehurstMoore County · 18,670 people5.050.53.0A
4RolesvilleWake County · 12,839 people5.610.43.8A
5WaxhawUnion County · 23,140 people6.380.64.2A
6ElonAlamance County · 11,366 people6.500.64.0A
7Fuquay-VarinaWake County · 48,536 people8.260.75.5A−
8Holly RidgeOnslow County · 5,908 people9.040.66.5A−
9StallingsUnion County · 17,760 people9.520.67.1A−
10Southern ShoresDare County · 3,110 people · 2023 from the FBI Crime Data Explorer; 2025 from the FBI Crime Data Explorer11.420.111.0B+
11LelandBrunswick County · 35,731 people11.671.17.4B+
12Holly SpringsWake County · 50,288 people · 2024 from the FBI Crime Data Explorer; 2025 from the FBI Crime Data Explorer12.481.08.6B+
13WintervillePitt County · 10,973 people12.851.57.0B+
14Mint HillMecklenburg County · 29,476 people13.160.99.4B+
15China GroveRowan County · 4,650 people13.460.810.3B
16Black MountainBuncombe County · 8,491 people13.850.512.0B
17CorneliusMecklenburg County · 35,094 people14.501.29.5B
18Boone College campusWatauga County · 19,929 people14.711.210.0B
19GibsonvilleGuilford County · 9,876 people14.831.58.8B
20WendellWake County · 19,687 people14.911.110.5B
21RanloGaston County · 4,848 people14.942.06.8B
22CaryWake County · 183,582 people15.020.811.7B
23ConcordCabarrus County · 114,598 people15.201.310.0B
24HudsonCaldwell County · 3,786 people15.410.513.3B
25FletcherHenderson County · 8,373 people16.720.514.8B
26Granite QuarryRowan County · 3,129 people · 2024 from the FBI Crime Data Explorer; 2025 from the FBI Crime Data Explorer17.121.610.7B−
27ArchdaleRandolph County · 12,254 people17.201.013.2B−
28CramertonGaston County · 5,713 people · 2023 from the FBI Crime Data Explorer; 2025 from the FBI Crime Data Explorer17.331.013.5B−
29Four OaksJohnston County · 2,978 people17.522.19.0B−
30BrevardTransylvania County · 8,098 people · 2024 from the FBI Crime Data Explorer17.661.611.1B−
31Wake ForestWake County · 58,147 people18.051.312.9B−
32WoodfinBuncombe County · 8,229 people · 2025 from the FBI Crime Data Explorer18.432.010.2B−
33ClaytonJohnston County · 32,633 people18.491.413.0B−
34RaefordHoke County · 4,703 people18.701.413.1B−
35HuntersvilleMecklenburg County · 68,535 people19.051.513.0B−
36KingStokes County · 7,977 people19.290.716.4B−
37Boiling Spring LakesBrunswick County · 6,875 people20.352.112.0B−
38LandisRowan County · 3,885 people · 2023 from the FBI Crime Data Explorer; 2024 from the FBI Crime Data Explorer20.892.411.1B−
39Mount HollyGaston County · 19,033 people21.011.813.9C+
40StanleyGaston County · 4,237 people · 2024 from the FBI Crime Data Explorer21.041.315.9C+
41HavelockCraven County · 17,430 people · 2025 from the FBI Crime Data Explorer21.471.814.1C+
42CreedmoorGranville County · 5,046 people21.552.412.1C+
43LowellGaston County · 3,939 people22.642.114.4C+
44SwansboroOnslow County · 4,174 people · 2025 from the FBI Crime Data Explorer23.940.721.1C+
45ButnerGranville County · 8,112 people24.592.912.8C+
46KannapolisCabarrus County · 61,708 people24.991.917.5C+
47Kitty HawkDare County · 3,670 people · 2025 from the FBI Crime Data Explorer25.022.116.8C+
48DallasGaston County · 6,392 people · 2025 from the FBI Crime Data Explorer25.251.917.8C+
49BurgawPender County · 3,903 people25.852.217.0C
50Bessemer CityGaston County · 5,834 people · 2025 from the FBI Crime Data Explorer26.243.412.7C
51BeaufortCarteret County · 4,912 people · 2025 from the FBI Crime Data Explorer27.093.114.9C
52ValdeseBurke County · 4,712 people27.222.118.7C
53NewportCarteret County · 4,500 people27.332.915.6C
54Emerald IsleCarteret County · 3,970 people27.342.019.4C
55SpencerRowan County · 3,450 people · 2023 from the FBI Crime Data Explorer; 2024 from the FBI Crime Data Explorer27.523.115.3C
56WindsorBertie County · 3,469 people27.584.011.5C
57YadkinvilleYadkin County · 3,055 people28.272.518.1C
58Chapel HillOrange County · 63,565 people28.621.422.8C
59Wilson's MillsJohnston County · 2,987 people28.644.311.3C
60JacksonvilleOnslow County · 72,732 people · 2023 from the FBI Crime Data Explorer; 2024 from the FBI Crime Data Explorer28.692.518.6C
61Tabor CityColumbus County · 3,886 people28.732.718.1C
62MorrisvilleWake County · 32,466 people28.731.024.6C
63WeavervilleBuncombe County · 4,790 people29.060.626.8C
64MooresvilleIredell County · 55,842 people29.512.220.7C
65AydenPitt County · 5,263 people30.083.615.6C
66CarrboroOrange County · 20,962 people30.122.420.6C
67TroyMontgomery County · 3,020 people30.153.018.1C
68Surf CityPender County · 5,142 people30.763.417.1C
69GrahamAlamance County · 20,131 people31.323.417.5C
70EdentonChowan County · 4,546 people31.484.115.2C
71New BernCraven County · 34,724 people31.643.417.8C
72CherryvilleGaston County · 6,523 people31.992.123.6C
73Carolina BeachNew Hanover County · 6,870 people32.163.518.1C−
74PittsboroChatham County · 5,054 people32.252.024.4C−
75MatthewsMecklenburg County · 32,769 people · 2025 from the FBI Crime Data Explorer33.221.726.3C−
76Southern PinesMoore County · 17,357 people33.733.519.8C−
77North WilkesboroWilkes County · 4,369 people33.812.424.2C−
78Granite FallsCaldwell County · 4,964 people34.251.528.3C−
79Mount AirySurry County · 10,682 people34.812.525.0C−
80FranklinMacon County · 4,403 people34.962.126.4C−
81KnightdaleWake County · 23,144 people35.662.326.4C−
82LillingtonHarnett County · 5,040 people · 2024 from the FBI Crime Data Explorer36.344.020.5C−
83LincolntonLincoln County · 12,465 people36.783.223.9C−
84NewtonCatawba County · 13,822 people37.144.120.9C−
85RandlemanRandolph County · 4,767 people · 2024 from the FBI Crime Data Explorer37.812.428.1C−
86AsheboroRandolph County · 27,990 people · 2024 from the FBI Crime Data Explorer38.193.424.8C−
87BelmontGaston County · 16,415 people38.783.126.2C−
88Siler CityChatham County · 8,155 people39.064.222.3C−
89Morehead CityCarteret County · 10,434 people39.113.226.4C−
90Elizabeth CityPasquotank County · 19,622 people39.623.924.1C−
91ZebulonWake County · 11,933 people39.823.625.2C−
92ErwinHarnett County · 4,956 people39.843.824.7C−
93LenoirCaldwell County · 18,372 people41.232.730.5C−
94AberdeenMoore County · 10,066 people41.442.531.6C−
95HendersonvilleHenderson County · 15,867 people41.553.029.5C−
96RutherfordtonRutherford County · 3,723 people41.922.432.2C−
97High PointGuilford County · 120,571 people42.054.723.1D
98KernersvilleForsyth County · 29,128 people42.202.532.0D
99MarionMcDowell County · 7,440 people42.312.034.2D
100TroutmanIredell County · 4,336 people42.522.432.8D
101EdenRockingham County · 15,500 people42.734.524.9D
102MebaneAlamance County · 21,952 people43.333.031.3D
103RaleighWake County · 506,306 people44.354.725.6D
104WilsonWilson County · 49,572 people45.005.323.9D
105Nags HeadDare County · 3,117 people45.763.133.4D
106GreenvillePitt County · 96,443 people47.294.828.1D
107Kings MountainCleveland County · 12,117 people47.375.923.7D
108TarboroEdgecombe County · 10,979 people47.385.824.2D
109WarsawDuplin County · 2,853 people48.465.227.7D
110HickoryCatawba County · 45,975 people48.634.929.1D
111LexingtonDavidson County · 20,238 people · 2023 from the FBI Crime Data Explorer48.844.929.4D
112WaynesvilleHaywood County · 11,006 people50.194.930.6D
113HillsboroughOrange County · 9,778 people51.192.939.6D
114WilmingtonNew Hanover County · 126,809 people51.314.633.0D
115Spring LakeCumberland County · 11,252 people52.425.231.6D
116SmithfieldJohnston County · 13,114 people53.653.937.9D
117ReidsvilleRockingham County · 14,692 people53.886.030.0D
118SelmaJohnston County · 7,406 people54.817.524.6D
119WallaceDuplin County · 3,570 people55.394.139.0D
120WashingtonBeaufort County · 9,910 people55.755.732.9D
121ShallotteBrunswick County · 5,335 people · 2025 from the FBI Crime Data Explorer56.212.944.4D
122MarshvilleUnion County · 2,739 people56.457.526.4D
123MonroeUnion County · 42,644 people57.346.730.5D
124GarnerWake County · 41,562 people57.474.340.1D
125ClintonSampson County · 8,466 people57.745.934.2D
126FayettevilleCumberland County · 209,120 people58.117.129.7D
127WilkesboroWilkes County · 3,618 people58.443.444.9D
128BensonJohnston County · 4,660 people59.947.131.5D
129ElkinSurry County · 4,130 people · 2024 from the FBI Crime Data Explorer60.454.542.5D
130DurhamDurham County · 305,561 people60.595.937.1D
131Winston-SalemForsyth County · 257,271 people62.218.129.7D
132CharlotteMecklenburg County · 964,784 people63.306.736.4D
133ShelbyCleveland County · 23,309 people63.319.625.0D
134BurlingtonAlamance County · 61,496 people63.498.031.3D
135FarmvillePitt County · 4,577 people63.829.924.2D
136StatesvilleIredell County · 32,181 people · 2024 from the FBI Crime Data Explorer65.987.536.0D
137Rocky MountNash County · 55,120 people66.177.735.4D−
138GreensboroGuilford County · 308,667 people · 2025 from the FBI Crime Data Explorer66.288.233.6D−
139OxfordGranville County · 8,985 people66.848.433.1D−
140GastoniaGaston County · 87,067 people67.688.433.9D−
141SylvaJackson County · 2,691 people68.997.041.2D−
142ElizabethtownBladen County · 3,306 people · 2024 from the FBI Crime Data Explorer69.326.842.3D−
143SalisburyRowan County · 36,879 people72.358.438.8D−
144AhoskieHertford County · 4,608 people72.459.534.3D−
145RoxboroPerson County · 8,380 people74.149.635.7D−
146AshevilleBuncombe County · 93,523 people74.458.042.6D−
147LouisburgFranklin County · 3,480 people75.315.652.8D−
148Forest CityRutherford County · 7,410 people75.405.055.4D−
149Roanoke RapidsHalifax County · 14,386 people75.448.641.2D−
150Red SpringsRobeson County · 3,216 people76.316.649.8D−
151DunnHarnett County · 8,814 people77.467.049.7D−
152KinstonLenoir County · 19,705 people77.668.842.6D−
153MayodanRockingham County · 2,503 people80.342.869.0D−
154PlymouthWashington County · 3,170 people83.3413.330.2D−
155GoldsboroWayne County · 35,012 people102.6412.353.5D−
156PembrokeRobeson County · 2,888 people108.937.678.4D−
157LaurinburgScotland County · 14,582 people111.1816.445.8D−
158PinevilleMecklenburg County · 11,851 people111.647.283.0D−
159WilliamstonMartin County · 5,086 people · 2023 from the FBI Crime Data Explorer114.1412.265.2D−
160HendersonVance County · 15,013 people115.1415.652.6D−
161WhitevilleColumbus County · 4,765 people120.098.785.4D−
162WadesboroAnson County · 5,035 people149.2819.870.1D−
163LumbertonRobeson County · 18,955 people166.8116.5100.9D−

Per 1,000 residents a year, 2023–2025. Last on the list: Lumberton, 166.81. The rate counts crimes reported to police, not how safe any one street feels.

Not ranked

127 towns without figures of their own

These towns of 2,500+ are not on the list because there are no police figures for them alone for all of 2023–2025, from the FBI or the state. In 2025 the FBI’s tables list State Police figures for 0 of North Carolina’s counties and county sheriff figures for 82; those cover many towns at once and can’t be split by town, so they aren’t ranked here. Their other grades stand; the overall grade uses the rest.

  • Albemarle Stanly County · 17,769 people: figures for 2023 and 2025 only (all three years are needed).
  • Anderson Creek Harnett County · 13,927 people: no figures of its own in the FBI’s tables for 2023–2025.
  • Angier Harnett County · 9,410 people: figures for 2024 and 2025 only (all three years are needed).
  • Apex Wake County · 80,419 people: figures for 2023 and 2025 only (all three years are needed).
  • Archer Lodge Johnston County · 5,649 people: no figures of its own in the FBI’s tables for 2023–2025.
  • Avery Creek Buncombe County · 2,887 people: no figures of its own in the FBI’s tables for 2023–2025.
  • Barbecue · 5,910 people: no figures of its own in the FBI’s tables for 2023–2025.
  • Bayshore New Hanover County · 2,949 people: no figures of its own in the FBI’s tables for 2023–2025.
  • Belville Brunswick County · 3,199 people: no figures of its own in the FBI’s tables for 2023–2025.
  • Bermuda Run Davie County · 3,323 people: no figures of its own in the FBI’s tables for 2023–2025.
  • Bethlehem Alexander County · 4,101 people: no figures of its own in the FBI’s tables for 2023–2025.
  • Boiling Springs Cleveland County · 4,799 people: no figures of its own in the FBI’s tables for 2023–2025.
  • Briar Chapel Chatham County · 6,049 people: no figures of its own in the FBI’s tables for 2023–2025.
  • Brices Creek Craven County · 3,415 people: no figures of its own in the FBI’s tables for 2023–2025.
  • Brogden Wayne County · 2,733 people: no figures of its own in the FBI’s tables for 2023–2025.
  • Buies Creek Harnett County · 3,746 people: no figures of its own in the FBI’s tables for 2023–2025.
  • Cajah's Mountain Caldwell County · 2,702 people: no figures of its own in the FBI’s tables for 2023–2025.
  • Calabash Brunswick County · 3,069 people: no figures of its own in the FBI’s tables for 2023–2025.
  • Canton Haywood County · 4,418 people: figures for 2023 and 2024 only (all three years are needed).
  • Carolina Shores Brunswick County · 5,540 people: no figures of its own in the FBI’s tables for 2023–2025.
  • Carthage Moore County · 3,070 people: no figures of its own in the FBI’s tables for 2023–2025.
  • Clemmons Forsyth County · 22,808 people: no figures of its own in the FBI’s tables for 2023–2025.
  • Conover Catawba County · 8,938 people: no figures of its own in the FBI’s tables for 2023–2025.
  • Cullowhee Jackson County · 7,973 people: no figures of its own in the FBI’s tables for 2023–2025.
  • Dana Henderson County · 4,147 people: no figures of its own in the FBI’s tables for 2023–2025.
  • East Flat Rock Henderson County · 6,323 people: no figures of its own in the FBI’s tables for 2023–2025.
  • East Rockingham Richmond County · 2,779 people: no figures of its own in the FBI’s tables for 2023–2025.
  • Eastover Cumberland County · 3,743 people: no figures of its own in the FBI’s tables for 2023–2025.
  • Edneyville Henderson County · 2,716 people: no figures of its own in the FBI’s tables for 2023–2025.
  • Elroy Wayne County · 3,251 people: no figures of its own in the FBI’s tables for 2023–2025.
  • Emma Buncombe County · 2,657 people: no figures of its own in the FBI’s tables for 2023–2025.
  • Enochville Rowan County · 3,321 people: no figures of its own in the FBI’s tables for 2023–2025.
  • Etowah Henderson County · 7,968 people: no figures of its own in the FBI’s tables for 2023–2025.
  • Fairfield Harbour Craven County · 2,948 people: no figures of its own in the FBI’s tables for 2023–2025.
  • Fairview Union County · 3,805 people: no figures of its own in the FBI’s tables for 2023–2025.
  • Flat Rock Henderson County · 3,643 people: no figures of its own in the FBI’s tables for 2023–2025.
  • Forest Oaks Guilford County · 4,293 people: no figures of its own in the FBI’s tables for 2023–2025.
  • Franklinton Franklin County · 2,890 people: figures for 2023 and 2024 only (all three years are needed).
  • Gamewell Caldwell County · 3,713 people: no figures of its own in the FBI’s tables for 2023–2025.
  • Glen Raven Alamance County · 3,506 people: no figures of its own in the FBI’s tables for 2023–2025.
  • Green Level Alamance County · 3,409 people: no figures of its own in the FBI’s tables for 2023–2025.
  • Grifton Pitt County · 2,539 people: no figures of its own in the FBI’s tables for 2023–2025.
  • Half Moon Onslow County · 7,378 people: no figures of its own in the FBI’s tables for 2023–2025.
  • Hamlet Richmond County · 5,870 people: no figures of its own in the FBI’s tables for 2023–2025.
  • Hampstead Pender County · 9,292 people: no figures of its own in the FBI’s tables for 2023–2025.
  • Harrisburg Cabarrus County · 20,742 people: no figures of its own in the FBI’s tables for 2023–2025.
  • Hope Mills Cumberland County · 18,324 people: figures for 2023 only (all three years are needed).
  • Indian Trail Union County · 44,303 people: no figures of its own in the FBI’s tables for 2023–2025.
  • James City Craven County · 4,789 people: no figures of its own in the FBI’s tables for 2023–2025.
  • Jamestown Guilford County · 3,803 people: no figures of its own in the FBI’s tables for 2023–2025.
  • Kill Devil Hills Dare County · 7,731 people: figures for 2023 and 2024 only (all three years are needed).
  • Kings Grant New Hanover County · 9,003 people: no figures of its own in the FBI’s tables for 2023–2025.
  • La Grange Lenoir County · 2,947 people: no figures of its own in the FBI’s tables for 2023–2025.
  • Lake Junaluska Haywood County · 3,175 people: no figures of its own in the FBI’s tables for 2023–2025.
  • Lake Norman of Catawba Catawba County · 9,906 people: no figures of its own in the FBI’s tables for 2023–2025.
  • Lake Norman of Iredell Iredell County · 12,494 people: no figures of its own in the FBI’s tables for 2023–2025.
  • Lake Park Union County · 3,609 people: no figures of its own in the FBI’s tables for 2023–2025.
  • Lake Royale Franklin County · 3,168 people: no figures of its own in the FBI’s tables for 2023–2025.
  • Lewisville Forsyth County · 14,421 people: no figures of its own in the FBI’s tables for 2023–2025.
  • Liberty Randolph County · 2,739 people: figures for 2023 and 2025 only (all three years are needed).
  • Locust Stanly County · 6,120 people: no figures of its own in the FBI’s tables for 2023–2025.
  • Long View Catawba County · 5,387 people: no figures of its own in the FBI’s tables for 2023–2025.
  • Lowesville Lincoln County · 3,874 people: no figures of its own in the FBI’s tables for 2023–2025.
  • Maiden Catawba County · 3,922 people: no figures of its own in the FBI’s tables for 2023–2025.
  • Mar-Mac Wayne County · 2,877 people: no figures of its own in the FBI’s tables for 2023–2025.
  • Marvin Union County · 7,040 people: no figures of its own in the FBI’s tables for 2023–2025.
  • Midland Cabarrus County · 5,151 people: no figures of its own in the FBI’s tables for 2023–2025.
  • Midway Davidson County · 5,104 people: no figures of its own in the FBI’s tables for 2023–2025.
  • Mills River Henderson County · 7,504 people: no figures of its own in the FBI’s tables for 2023–2025.
  • Mineral Springs Union County · 3,514 people: no figures of its own in the FBI’s tables for 2023–2025.
  • Mocksville Davie County · 6,282 people: no figures of its own in the FBI’s tables for 2023–2025.
  • Morganton Burke County · 17,849 people: no figures of its own in the FBI’s tables for 2023–2025.
  • Mount Olive Wayne County · 4,521 people: figures for 2023 and 2024 only (all three years are needed).
  • Mountain Home Henderson County · 3,437 people: no figures of its own in the FBI’s tables for 2023–2025.
  • Mountain View Catawba County · 3,982 people: no figures of its own in the FBI’s tables for 2023–2025.
  • Moyock Currituck County · 5,684 people: no figures of its own in the FBI’s tables for 2023–2025.
  • Murraysville New Hanover County · 16,339 people: no figures of its own in the FBI’s tables for 2023–2025.
  • Myrtle Grove New Hanover County · 12,637 people: no figures of its own in the FBI’s tables for 2023–2025.
  • Nashville Nash County · 5,911 people: no figures of its own in the FBI’s tables for 2023–2025.
  • Neuse Forest Craven County · 2,671 people: no figures of its own in the FBI’s tables for 2023–2025.
  • Northchase New Hanover County · 5,896 people: no figures of its own in the FBI’s tables for 2023–2025.
  • Norwood Stanly County · 2,568 people: no figures of its own in the FBI’s tables for 2023–2025.
  • Oak Island Brunswick County · 9,337 people: no figures of its own in the FBI’s tables for 2023–2025.
  • Oak Ridge Guilford County · 7,896 people: no figures of its own in the FBI’s tables for 2023–2025.
  • Ogden New Hanover County · 8,249 people: no figures of its own in the FBI’s tables for 2023–2025.
  • Piney Green Onslow County · 14,078 people: no figures of its own in the FBI’s tables for 2023–2025.
  • Pleasant Garden Guilford County · 5,165 people: no figures of its own in the FBI’s tables for 2023–2025.
  • Porters Neck New Hanover County · 7,654 people: no figures of its own in the FBI’s tables for 2023–2025.
  • Red Oak Nash County · 3,523 people: no figures of its own in the FBI’s tables for 2023–2025.
  • River Bend Craven County · 2,890 people: no figures of its own in the FBI’s tables for 2023–2025.
  • River Road Beaufort County · 3,366 people: no figures of its own in the FBI’s tables for 2023–2025.
  • Rockfish Hoke County · 3,574 people: no figures of its own in the FBI’s tables for 2023–2025.
  • Rockingham Richmond County · 8,815 people: figures for 2023 and 2024 only (all three years are needed).
  • Royal Pines Buncombe County · 4,325 people: no figures of its own in the FBI’s tables for 2023–2025.
  • Rural Hall Forsyth County · 3,607 people: no figures of its own in the FBI’s tables for 2023–2025.
  • Sanford Lee County · 34,138 people: no figures of its own in the FBI’s tables for 2023–2025.
  • Sawmills Caldwell County · 5,105 people: no figures of its own in the FBI’s tables for 2023–2025.
  • Seven Lakes Moore County · 4,535 people: no figures of its own in the FBI’s tables for 2023–2025.
  • Silver Lake New Hanover County · 6,563 people: no figures of its own in the FBI’s tables for 2023–2025.
  • Skippers Corner New Hanover County · 3,792 people: no figures of its own in the FBI’s tables for 2023–2025.
  • Sneads Ferry Onslow County · 2,728 people: no figures of its own in the FBI’s tables for 2023–2025.
  • Southport Brunswick County · 4,434 people: figures for 2024 only (all three years are needed).
  • Spindale Rutherford County · 4,180 people: no figures of its own in the FBI’s tables for 2023–2025.
  • Spout Springs Harnett County · 11,242 people: no figures of its own in the FBI’s tables for 2023–2025.
  • St. James Brunswick County · 7,318 people: no figures of its own in the FBI’s tables for 2023–2025.
  • St. Stephens Catawba County · 9,457 people: no figures of its own in the FBI’s tables for 2023–2025.
  • Stokesdale Guilford County · 6,133 people: no figures of its own in the FBI’s tables for 2023–2025.
  • Summerfield Guilford County · 11,327 people: no figures of its own in the FBI’s tables for 2023–2025.
  • Sunset Beach Brunswick County · 4,642 people: figures for 2024 and 2025 only (all three years are needed).
  • Swannanoa Buncombe County · 6,901 people: no figures of its own in the FBI’s tables for 2023–2025.
  • Swepsonville Alamance County · 2,632 people: no figures of its own in the FBI’s tables for 2023–2025.
  • Thomasville Davidson County · 27,733 people: figures for 2023 and 2024 only (all three years are needed).
  • Tobaccoville Forsyth County · 2,770 people: no figures of its own in the FBI’s tables for 2023–2025.
  • Trent Woods Craven County · 4,070 people: figures for 2023 only (all three years are needed).
  • Trinity Randolph County · 7,274 people: no figures of its own in the FBI’s tables for 2023–2025.
  • Tyro Davidson County · 3,833 people: no figures of its own in the FBI’s tables for 2023–2025.
  • Unionville Union County · 7,322 people: no figures of its own in the FBI’s tables for 2023–2025.
  • Valley Hill Henderson County · 2,675 people: no figures of its own in the FBI’s tables for 2023–2025.
  • Walkertown Forsyth County · 6,120 people: no figures of its own in the FBI’s tables for 2023–2025.
  • Wallburg Davidson County · 3,255 people: no figures of its own in the FBI’s tables for 2023–2025.
  • Weddington Union County · 14,517 people: no figures of its own in the FBI’s tables for 2023–2025.
  • Welcome Davidson County · 3,521 people: no figures of its own in the FBI’s tables for 2023–2025.
  • Wentworth Rockingham County · 2,774 people: no figures of its own in the FBI’s tables for 2023–2025.
  • Wesley Chapel Union County · 9,566 people: no figures of its own in the FBI’s tables for 2023–2025.
  • Westport Lincoln County · 5,915 people: no figures of its own in the FBI’s tables for 2023–2025.
  • Wingate Union County · 4,628 people: no figures of its own in the FBI’s tables for 2023–2025.
  • Wrightsboro New Hanover County · 6,287 people: no figures of its own in the FBI’s tables for 2023–2025.
Quick answers

Questions people ask

Which is the safest town in North Carolina?

Whispering Pines (Moore County) reports the least crime per resident: 2.94 weighted crimes per 1,000 a year over 2023–2025 (0.06 violent and 2.70 property crimes per 1,000), from its police department’s reports to the FBI. Davidson (4.72) and Pinehurst (5.05) follow.

How are these towns ranked?

By crimes reported by each town’s police per 1,000 residents over three years (FBI figures, or the state’s own where the FBI table lacks a year), with violent crimes counted four times as heavily as property crimes. It is the same measure as the Safety grade on each town’s page. How grades work.

Why isn’t my town on this list?

The list needs 2,500+ residents and the town’s own police figures for all three years. 127 North Carolina towns of 2,500+ lack them; they are listed above with the reason. Smaller towns have a Safety grade on their page but no rank.

Go deeper

More North Carolina lists

Every list ranks the same 2,500+ towns, so a town’s rank means the same thing on each.

All North Carolina rankings →
Other states

Safest towns in other states