Guest, Sign inJoin
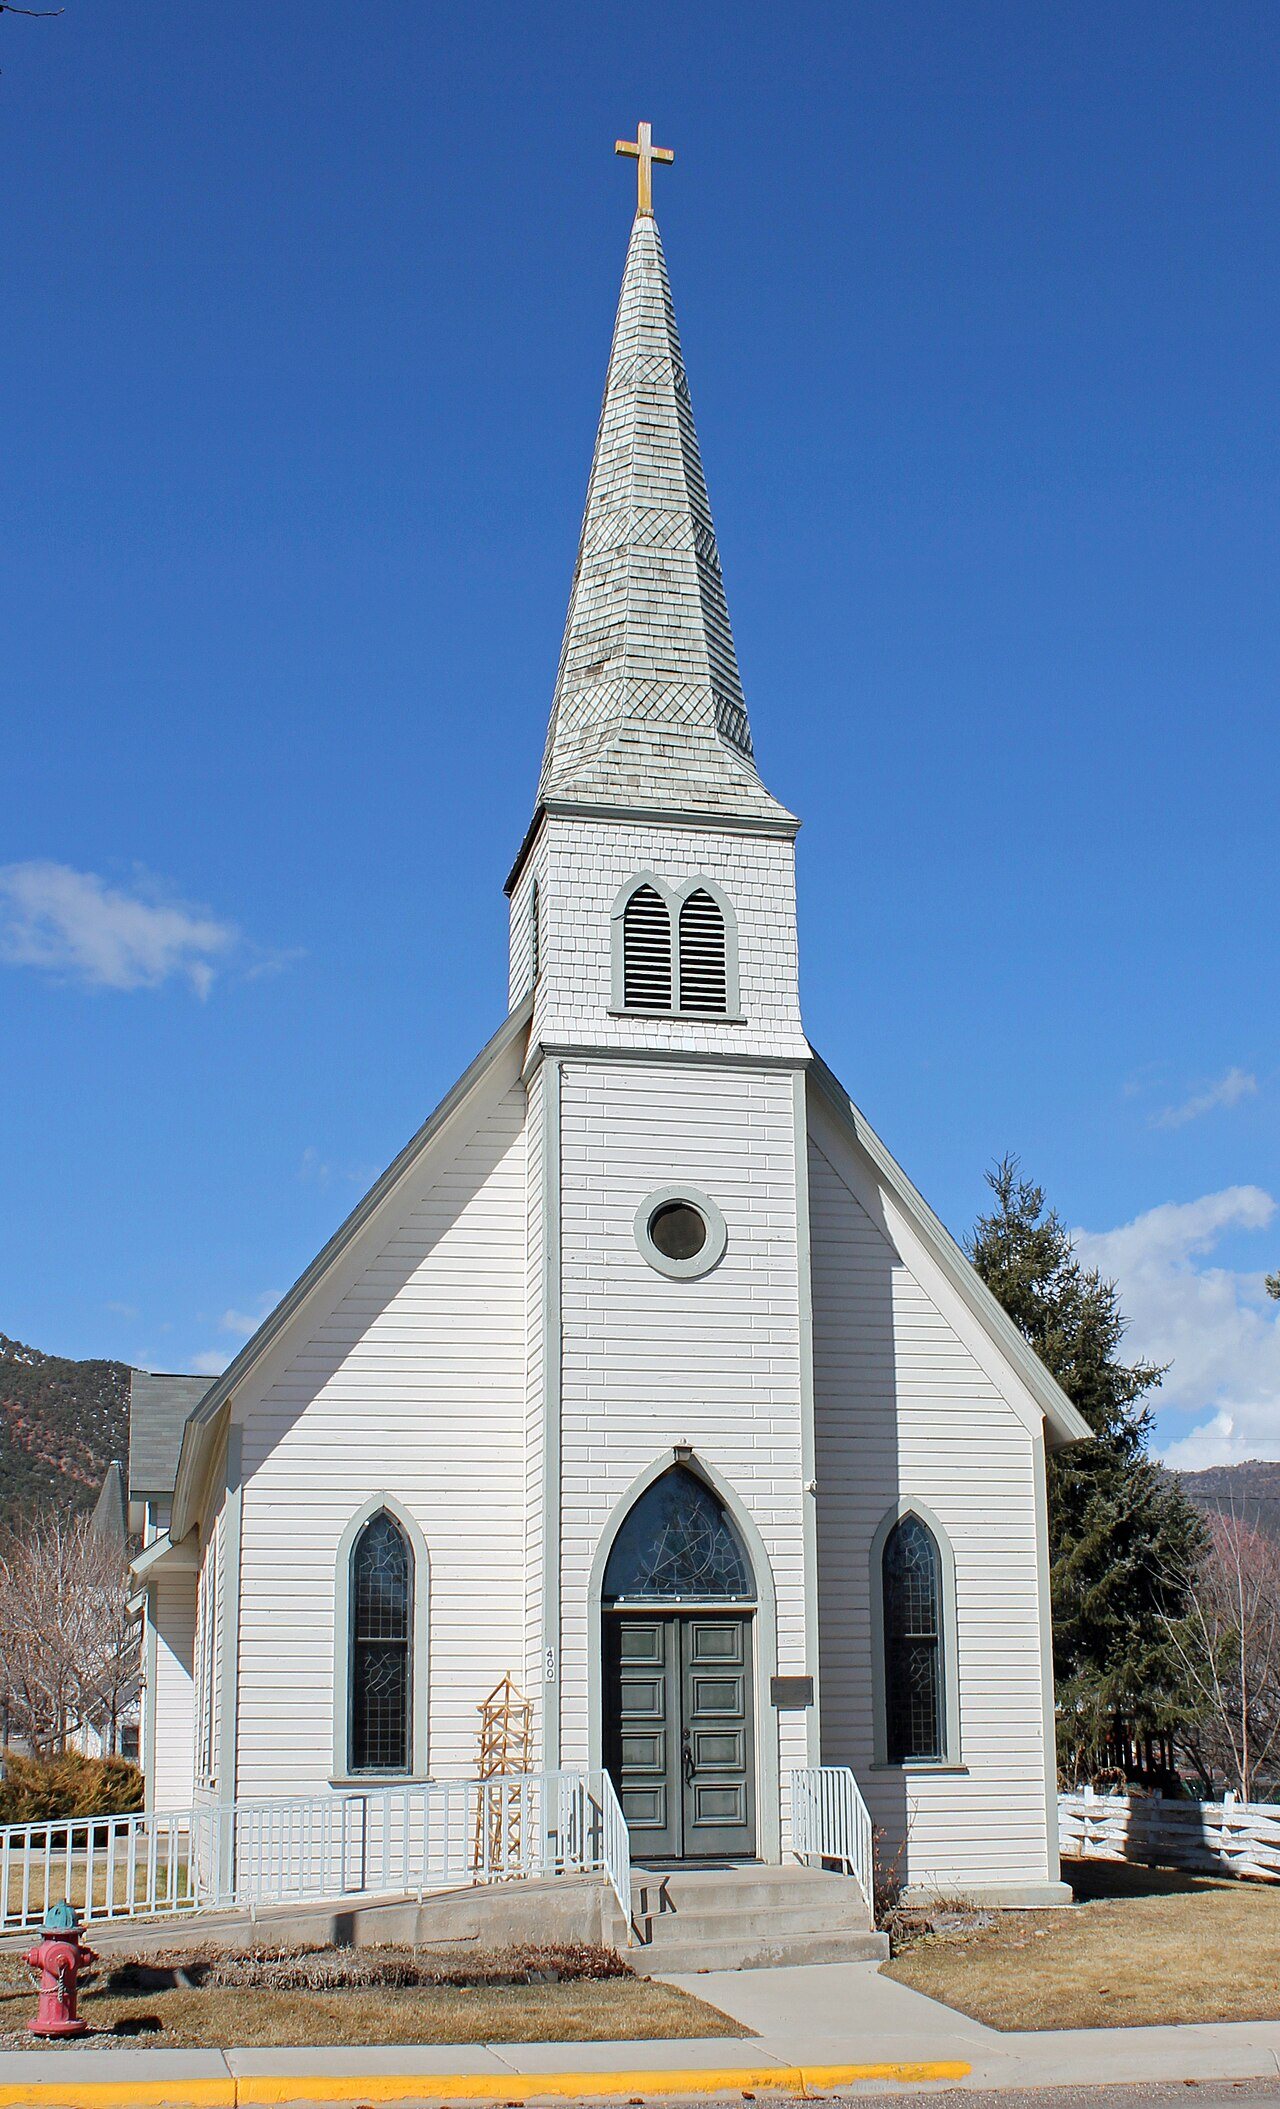
Milliken, ColoradoMilliken, #1 on this list · Photo: Jeffrey Beall · CC BY-SA 3.0
Colorado rankings · Safety

Safest towns in Colorado

Milliken reports the least crime per resident of Colorado’s 87 towns with crime figures for 2023–2025; 10 of the 87 grade A− or better on safety nationally.

Crimes reported by each town’s own police, 2023–2025, per 1,000 residents, violent crimes counted four times. The same measure as the Safety grade. For 4 of them one year isn’t in the FBI’s published tables and comes from the FBI Crime Data Explorer or the state’s own reports (named in the row). How grades work

#1

Milliken

Weld County · 9,183 people
A

4.79 weighted crimes per 1,000 a year·violent 0.1, property 4.5
#2

Gypsum

Eagle County · 9,212 people
A

4.92 weighted crimes per 1,000 a year·violent 0.5, property 2.9

#3

Bayfield

La Plata County · 2,974 people
A

5.72 weighted crimes per 1,000 a year·violent 0.1, property 5.3

All 87 towns

Weighted crimes per 1,000 residents a year, lowest first, to two decimals (the sort uses the exact rate, so there are no rounding ties). Grade = the national Safety grade.

87 towns ranked. Not here? See towns without their own figures.

#TownWeighted rateViolentPropertyGrade
1MillikenWeld County · 9,183 people4.790.14.5A
2GypsumEagle County · 9,212 people4.920.52.9A
3BayfieldLa Plata County · 2,974 people5.720.15.3A
4Buena VistaChaffee County · 3,248 people6.070.44.4A
5WindsorWeld County · 43,840 people6.840.45.2A
6SeveranceWeld County · 11,841 people7.511.03.4A−
7ElizabethElbert County · 2,957 people8.640.27.7A−
8FruitaMesa County · 14,003 people9.800.38.8A−
9FrederickWeld County · 18,241 people10.020.96.5A−
10EagleEagle County · 7,280 people10.061.06.2A−
11ErieWeld County · 40,904 people10.630.58.6B+
12LeadvilleLake County · 2,668 people10.690.68.1B+
13CarbondaleGarfield County · 6,762 people10.961.26.0B+
14EatonWeld County · 5,848 people11.070.49.3B+
15Castle RockDouglas County · 83,815 people11.450.310.3B+
16SalidaChaffee County · 5,985 people11.491.17.0B+
17TimnathLarimer County · 11,600 people11.550.49.8B+
18New CastleGarfield County · 4,896 people11.881.46.1B+
19Cherry Hills VillageArapahoe County · 6,389 people12.340.311.3B+
20AultWeld County · 2,667 people12.951.47.4B+
21PalisadeMesa County · 2,599 people13.430.810.4B
22Woodland ParkTeller County · 8,014 people14.521.010.5B
23DaconoWeld County · 6,844 people14.631.39.3B
24PlattevilleWeld County · 2,908 people15.140.911.4B
25FirestoneWeld County · 20,129 people15.251.49.7B
26MeadWeld County · 7,042 people15.892.07.7B
27Estes ParkLarimer County · 5,780 people16.481.98.9B
28BasaltEagle County · 4,009 people18.402.010.5B−
29MonumentEl Paso County · 13,813 people21.861.515.9C+
30ParkerDouglas County · 65,985 people23.152.015.0C+
31Steamboat SpringsRoutt County · 13,557 people23.503.011.5C+
32RifleGarfield County · 10,844 people23.542.912.0C+
33LouisvilleBoulder County · 20,581 people23.551.318.5C+
34CentennialArapahoe County · 108,658 people23.811.816.5C+
35SilverthorneSummit County · 5,418 people24.161.020.0C+
36CraigMoffat County · 8,874 people · 2023 from the FBI Crime Data Explorer24.763.311.6C+
37BroomfieldBroomfield County · 79,174 people24.791.518.7C+
38Manitou SpringsEl Paso County · 4,577 people25.822.615.6C
39FlorenceFremont County · 3,856 people28.414.012.3C
40GoldenJefferson County · 20,390 people28.911.423.4C
41MontroseMontrose County · 21,583 people29.152.120.8C
42Rocky FordOtero County · 3,752 people29.302.917.6C
43BurlingtonKit Carson County · 3,164 people30.294.313.2C
44LovelandLarimer County · 81,387 people30.702.919.2C
45Fort LuptonWeld County · 10,402 people30.953.517.1C
46Fort MorganMorgan County · 11,841 people31.853.119.4C
47EvansWeld County · 22,500 people32.543.916.8C−
48Fort CollinsLarimer County · 171,500 people32.542.821.1C−
49LittletonArapahoe County · 46,246 people33.302.224.6C−
50AspenPitkin County · 6,489 people33.391.328.3C−
51AvonEagle County · 6,184 people33.783.121.5C−
52LafayetteBoulder County · 30,116 people34.032.524.0C−
53ArvadaJefferson County · 122,901 people35.332.724.5C−
54FountainEl Paso County · 29,450 people36.694.518.8C−
55ThorntonAdams County · 147,766 people37.442.626.9C−
56JohnstownWeld County · 22,433 people37.881.730.9C−
57BreckenridgeSummit County · 5,015 people38.622.727.7C−
58DeltaDelta County · 9,802 people38.691.831.5C−
59BoulderBoulder County · 105,689 people41.003.427.2C−
60SterlingLogan County · 13,054 people43.103.628.9D
61BrightonAdams County · 45,395 people43.314.624.9D
62NorthglennAdams County · 38,893 people45.064.427.2D
63WestminsterAdams County · 116,182 people45.583.033.4D
64GunnisonGunnison County · 6,836 people45.683.531.6D
65Grand JunctionMesa County · 71,827 people50.185.329.0D
66Cañon CityFremont County · 17,030 people · 2024 from the FBI Crime Data Explorer50.265.030.3D
67CortezMontezuma County · 9,126 people51.465.728.8D
68Glenwood SpringsGarfield County · 10,395 people53.373.638.8D
69TrinidadLas Animas County · 8,091 people53.906.926.4D
70GreeleyWeld County · 115,073 people54.826.429.2D
71VailEagle County · 4,407 people55.863.740.9D
72Commerce CityAdams County · 72,345 people57.967.727.3D
73Wheat RidgeJefferson County · 32,081 people58.653.942.9D
74Colorado SpringsEl Paso County · 494,743 people61.597.033.8D
75Monte VistaRio Grande County · 4,005 people62.333.747.4D
76La JuntaOtero County · 6,864 people65.294.248.7D
77AuroraArapahoe County · 410,053 people66.328.830.9D−
78EnglewoodArapahoe County · 35,305 people76.036.550.0D−
79Greenwood VillageArapahoe County · 15,323 people76.073.860.8D−
80LakewoodJefferson County · 156,927 people76.187.247.2D−
81AlamosaAlamosa County · 9,849 people · 2023 from the FBI Crime Data Explorer80.348.446.7D−
82PuebloPueblo County · 110,404 people86.2311.341.0D−
83DenverDenver County · 740,613 people87.159.648.6D−
84EdgewaterJefferson County · 4,870 people93.343.081.5D−
85SheridanArapahoe County · 5,972 people98.937.867.9D−
86Lone TreeDouglas County · 15,278 people120.174.2103.5D−
87GlendaleArapahoe County · 4,475 people · 2023 from the FBI Crime Data Explorer236.3318.5162.2D−

Per 1,000 residents a year, 2023–2025. Last on the list: Glendale, 236.33. The rate counts crimes reported to police, not how safe any one street feels.

Not ranked

72 towns without figures of their own

These towns of 2,500+ are not on the list because there are no police figures for them alone for all of 2023–2025, from the FBI or the state. In 2025 the FBI’s tables list State Police figures for 0 of Colorado’s counties and county sheriff figures for 54; those cover many towns at once and can’t be split by town, so they aren’t ranked here. Their other grades stand; the overall grade uses the rest.

  • Acres Green Douglas County · 2,639 people: no figures of its own in the FBI’s tables for 2023–2025.
  • Air Force Academy El Paso County · 6,727 people: no figures of its own in the FBI’s tables for 2023–2025.
  • Applewood Jefferson County · 8,350 people: no figures of its own in the FBI’s tables for 2023–2025.
  • Battlement Mesa Garfield County · 5,755 people: no figures of its own in the FBI’s tables for 2023–2025.
  • Bennett Adams County · 4,224 people: no figures of its own in the FBI’s tables for 2023–2025.
  • Berkley Adams County · 10,789 people: no figures of its own in the FBI’s tables for 2023–2025.
  • Berthoud Larimer County · 14,080 people: no figures of its own in the FBI’s tables for 2023–2025.
  • Black Forest El Paso County · 15,738 people: no figures of its own in the FBI’s tables for 2023–2025.
  • Brush Morgan County · 5,337 people: no figures of its own in the FBI’s tables for 2023–2025.
  • Castle Pines Douglas County · 15,583 people: no figures of its own in the FBI’s tables for 2023–2025.
  • Castle Pines Village Douglas County · 4,436 people: no figures of its own in the FBI’s tables for 2023–2025.
  • Cherry Creek Arapahoe County · 10,721 people: no figures of its own in the FBI’s tables for 2023–2025.
  • Cimarron Hills El Paso County · 19,817 people: no figures of its own in the FBI’s tables for 2023–2025.
  • Clifton Mesa County · 19,518 people: no figures of its own in the FBI’s tables for 2023–2025.
  • Columbine Arapahoe County · 25,478 people: no figures of its own in the FBI’s tables for 2023–2025.
  • Dakota Ridge Jefferson County · 33,753 people: no figures of its own in the FBI’s tables for 2023–2025.
  • Derby Adams County · 8,453 people: no figures of its own in the FBI’s tables for 2023–2025.
  • Dove Valley Arapahoe County · 4,806 people: no figures of its own in the FBI’s tables for 2023–2025.
  • Durango La Plata County · 19,733 people: no figures of its own in the FBI’s tables for 2023–2025.
  • Edwards Eagle County · 10,785 people: no figures of its own in the FBI’s tables for 2023–2025.
  • El Jebel Eagle County · 2,941 people: no figures of its own in the FBI’s tables for 2023–2025.
  • Evergreen Jefferson County · 8,602 people: no figures of its own in the FBI’s tables for 2023–2025.
  • Fairmount Jefferson County · 9,902 people: no figures of its own in the FBI’s tables for 2023–2025.
  • Federal Heights Adams County · 14,075 people: figures for 2025 only (all three years are needed).
  • Fort Carson El Paso County · 18,019 people: no figures of its own in the FBI’s tables for 2023–2025.
  • Four Square Mile Arapahoe County · 23,024 people: no figures of its own in the FBI’s tables for 2023–2025.
  • Frisco Summit County · 2,792 people: figures for 2024 and 2025 only (all three years are needed).
  • Fruitvale Mesa County · 8,019 people: no figures of its own in the FBI’s tables for 2023–2025.
  • Genesee Jefferson County · 3,778 people: no figures of its own in the FBI’s tables for 2023–2025.
  • Gleneagle El Paso County · 6,440 people: no figures of its own in the FBI’s tables for 2023–2025.
  • Gunbarrel Boulder County · 10,051 people: no figures of its own in the FBI’s tables for 2023–2025.
  • Highlands Ranch Douglas County · 102,257 people: no figures of its own in the FBI’s tables for 2023–2025.
  • Holly Hills Arapahoe County · 2,572 people: no figures of its own in the FBI’s tables for 2023–2025.
  • Inverness Arapahoe County · 2,934 people: no figures of its own in the FBI’s tables for 2023–2025.
  • Ken Caryl Jefferson County · 33,233 people: no figures of its own in the FBI’s tables for 2023–2025.
  • Lamar Prowers County · 7,588 people: figures for 2024 and 2025 only (all three years are needed).
  • Lincoln Park Fremont County · 3,986 people: no figures of its own in the FBI’s tables for 2023–2025.
  • Lochbuie Weld County · 8,776 people: figures for 2024 and 2025 only (all three years are needed).
  • Longmont Boulder County · 100,109 people: figures for 2023 and 2024 only (all three years are needed).
  • Meridian Douglas County · 5,634 people: no figures of its own in the FBI’s tables for 2023–2025.
  • Meridian Village Douglas County · 2,699 people: no figures of its own in the FBI’s tables for 2023–2025.
  • Niwot Boulder County · 3,447 people: no figures of its own in the FBI’s tables for 2023–2025.
  • Orchard City Delta County · 3,299 people: no figures of its own in the FBI’s tables for 2023–2025.
  • Orchard Mesa Mesa County · 6,945 people: no figures of its own in the FBI’s tables for 2023–2025.
  • Palmer Lake El Paso County · 2,591 people: figures for 2024 and 2025 only (all three years are needed).
  • Park Center Fremont County · 2,588 people: no figures of its own in the FBI’s tables for 2023–2025.
  • Penrose Fremont County · 4,087 people: no figures of its own in the FBI’s tables for 2023–2025.
  • Ponderosa Park Elbert County · 3,453 people: no figures of its own in the FBI’s tables for 2023–2025.
  • Pueblo West Pueblo County · 35,681 people: no figures of its own in the FBI’s tables for 2023–2025.
  • Redlands Mesa County · 8,868 people: no figures of its own in the FBI’s tables for 2023–2025.
  • Roxborough Park Douglas County · 9,085 people: no figures of its own in the FBI’s tables for 2023–2025.
  • Security-Widefield El Paso County · 37,345 people: no figures of its own in the FBI’s tables for 2023–2025.
  • Shaw Heights Adams County · 5,565 people: no figures of its own in the FBI’s tables for 2023–2025.
  • Sherrelwood Adams County · 18,692 people: no figures of its own in the FBI’s tables for 2023–2025.
  • Sierra Ridge Douglas County · 3,663 people: no figures of its own in the FBI’s tables for 2023–2025.
  • Silt Garfield County · 3,743 people: figures for 2023 only (all three years are needed).
  • Snowmass Village Pitkin County · 2,965 people: figures for 2024 and 2025 only (all three years are needed).
  • Stepping Stone Douglas County · 3,137 people: no figures of its own in the FBI’s tables for 2023–2025.
  • Sterling Ranch Douglas County · 4,213 people: no figures of its own in the FBI’s tables for 2023–2025.
  • Stonegate Douglas County · 8,906 people: no figures of its own in the FBI’s tables for 2023–2025.
  • Strasburg Adams County · 3,455 people: no figures of its own in the FBI’s tables for 2023–2025.
  • Stratmoor El Paso County · 5,412 people: no figures of its own in the FBI’s tables for 2023–2025.
  • Superior Boulder County · 13,637 people: no figures of its own in the FBI’s tables for 2023–2025.
  • The Pinery Douglas County · 11,871 people: no figures of its own in the FBI’s tables for 2023–2025.
  • Todd Creek Adams County · 5,379 people: no figures of its own in the FBI’s tables for 2023–2025.
  • Twin Lakes Adams County · 8,030 people: no figures of its own in the FBI’s tables for 2023–2025.
  • Walsenburg Huerfano County · 3,039 people: no figures of its own in the FBI’s tables for 2023–2025.
  • Welby Adams County · 16,197 people: no figures of its own in the FBI’s tables for 2023–2025.
  • Wellington Larimer County · 12,169 people: no figures of its own in the FBI’s tables for 2023–2025.
  • West Pleasant View Jefferson County · 5,051 people: no figures of its own in the FBI’s tables for 2023–2025.
  • Woodmoor El Paso County · 8,934 people: no figures of its own in the FBI’s tables for 2023–2025.
  • Yuma Yuma County · 3,424 people: figures for 2023 and 2025 only (all three years are needed).
Quick answers

Questions people ask

Which is the safest town in Colorado?

Milliken (Weld County) reports the least crime per resident: 4.79 weighted crimes per 1,000 a year over 2023–2025 (0.07 violent and 4.50 property crimes per 1,000), from its police department’s reports to the FBI. Gypsum (4.92) and Bayfield (5.72) follow.

How are these towns ranked?

By crimes reported by each town’s police per 1,000 residents over three years (FBI figures, or the state’s own where the FBI table lacks a year), with violent crimes counted four times as heavily as property crimes. It is the same measure as the Safety grade on each town’s page. How grades work.

Why isn’t my town on this list?

The list needs 2,500+ residents and the town’s own police figures for all three years. 72 Colorado towns of 2,500+ lack them; they are listed above with the reason. Smaller towns have a Safety grade on their page but no rank.

Go deeper

More Colorado lists

Every list ranks the same 2,500+ towns, so a town’s rank means the same thing on each.

All Colorado rankings →
Other states

Safest towns in other states