
Streetlamp -10, 2011
Burien’s story
107 years in pictures
Census counts: 23,189 in 1980, 52,066 in 2020. The archive holds 4 old photos and papers going back to 2011 and 4 maps from 1949 on.
- 1919Burien is settled
Each edition grades its towns against each other only.
Burien grades D overall, 243rd of 285 graded towns in Washington, mostly because of safety and schools. It reports more crime per resident than 89% of U.S. towns, including 171 violent crimes reported to the FBI in 2025. Its schools rank behind 79% of the state's. In its favor, residents are healthier than 83% of U.S. towns on CDC estimates. Burien is more walkable than 95% of U.S. towns. Ed Munro Seahurst Park, at 204 acres with 4.1 miles of trail, is the biggest park or preserve. Homes are expensive, about $625K for a typical one and 5.4 times the Seattle metro’s $115K median household income.
Where Burien beats most towns.
33,313 counted in 2010 and 52,066 in 2020; an estimated 51,859 in 2025.
Growth has leveled off: within 1% of 2020, after 56.3% in the decade before.
U.S. Census 2010 & 2020 counts · Census Bureau estimate, July 1, 2025
Each subject compared with towns across the country (schools within Washington), ordered by how far Burien is from typical.
Its grades run from A+ for walkability (better than 95% of comparable towns) to D for safety (better than 11%), so the D overall blends very different results.
How TownRatings grades towns →
Census counts: 23,189 in 1980, 52,066 in 2020. The archive holds 4 old photos and papers going back to 2011 and 4 maps from 1949 on.
Museums, parks, gardens and other places to visit around Burien. Close and well known come first.
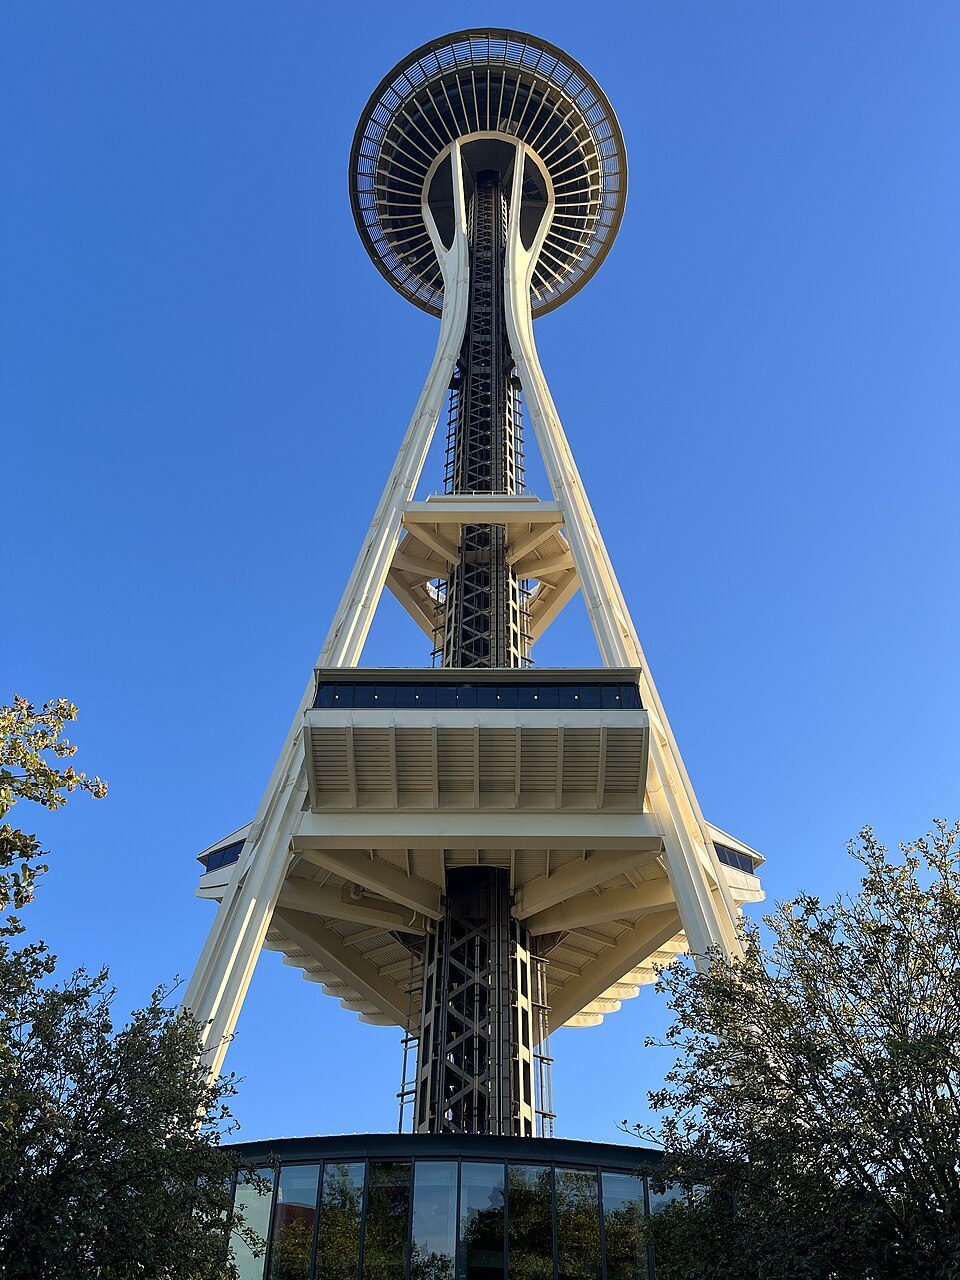 Big draw10 mi LookoutSpace Needle
 Big draw8 mi Stadium & arenaLumen Field
 Big draw10 mi Stadium & arenaClimate Pledge Arena
 8 mi Stadium & arenaT-Mobile Park
 9 mi Ancient siteSeattle Underground
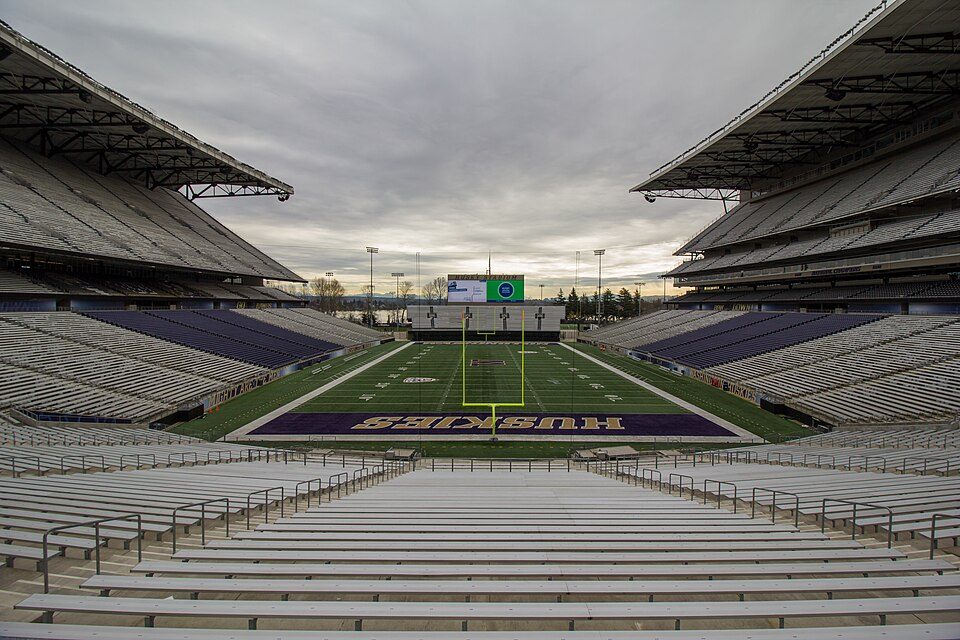 12 mi Stadium & arenaHusky Stadium
Space Needle: Another Believer, CC BY-SA 4.0 · Lumen Field: "Smart Destinations", GoSeattleCard.com, and Go Seattle Card Blog, CC BY-SA 2.0 · Climate Pledge Arena: Sea Cow, CC BY-SA 4.0 · T-Mobile Park: MyName (Cacophony), CC BY-SA 3.0 · Seattle Underground: Mark Hursh, CC BY-SA 3.0 · Husky Stadium: Atomic Taco, CC BY-SA 2.0
Who provides power, water and the rest in Burien, and how to reach them.
EPA SDWIS (Oct 9, 2026) · HIFLD + EIA-861 2025 · Census 2020 ZCTAs · NCES 2024–25 · registration: vote.gov, updated Sep 30, 2026.
Ordered by what stands out in Burien.
Burien has cooler summers than nearly all U.S. towns and has seen reported crime fall by a third or more.
Reported crimes fell from 2,149 to 1,437 over the last three FBI years, a drop beyond ordinary year-to-year swings.
The violent offense rate in Burien is 3.3 per 1,000 residents. The town’s level of property crime stands at 24.3 per 1,000 residents, above both Washington’s towns (15) and U.S. towns (9.9).
| Burien | Washington towns | U.S. towns | |
|---|---|---|---|
| Property crimes per 1,000 (2025) | 24.3 per 1,000 residents | 15 | 9.9 |
| Violent crimes per 1,000 (2025) | 3.3 per 1,000 residents | 1.5 | 1.6 |
FBI crime data, 2025 · crimes reported to police
Below: Two of its 24 schools, each with why it was picked. Its public schools are run by the Highline School District. The 6 public schools in Burien teach 2,680 students between them.
| School | Level | Students | Letter |
|---|---|---|---|
| Sylvester Middle SchoolLargest public middle schoolGrades 6–8 | Grades 6–8 | 582 | – |
| Highline High SchoolLargest public high schoolGrades 9–12 | Grades 9–12 | 1,423 | – |
NCES · EDFacts · graded within WA on state tests and graduation
10% of adults smoke cigarettes in Burien, against 11% in Washington’s towns and 14% across U.S. towns. The share of adults in Burien who had a checkup this year: 70%. Against the Washington average, Burien comes out ahead on 3 CDC measures out of 31, and behind on 9.
| Burien | Washington towns | U.S. towns | |
|---|---|---|---|
| Obesity (CDC PLACES) | 26% | 33% | 35% |
| Yearly checkup (CDC PLACES) | 70% | 71% | 79% |
| No health insurance, 18–64 (CDC PLACES) | 12% | 7.8% | 8.1% |
| Smoke cigarettes (CDC PLACES) | 10% | 11% | 14% |
| What stands out | Burien | WA |
|---|---|---|
| Fewer adults with obesity | 26.4% | 30.6% |
| Fewer adults who have had cancer | 7% | 7.9% |
| More uninsured adults | 11.5% | 8.4% |
CDC PLACES 2025 · modeled estimates for adults · CMS · HRSA
Burien’s density of trails comes in at 1.0 miles per square mile. Trails run 11 miles in 21 parks and preserves. Parks and preserves in the town: 21, covering 392 acres.
| Burien | Washington towns | U.S. towns | |
|---|---|---|---|
| Miles of trail per square mile | 1.0 miles per square mile | 0.8 | 0.4 |
| Conserved land | 4.6% | 4% | 4.3% |
| Biggest places to walk | Trails | Acres |
|---|---|---|
| 1. Ed Munro Seahurst Park | 4.1 mi | 204 |
| 2. Salmon Creek Ravine Park | 2 mi | 91 |
| 3. Lake Burien School Memorial Park | 0.4 mi | 5 |
Trails & parks © OpenStreetMap contributors · Conserved land: USGS PAD-US
For workers in Burien, the share who work from home is 19%. Just 6% of the town’s working residents have a job in town. The top destinations are Seattle (40%), SeaTac (6%) and Bellevue (5%).
| Burien | Washington towns | U.S. towns | |
|---|---|---|---|
| Work from home | 19% | 15% | 11% |
| Below the poverty line | 13% | 7.9% | 9.6% |
| Median household income | $91,000 | $98,000 | $80,000 |
| Average trip to work | 27 minutes | 27 minutes | 25 minutes |
Census LEHD 2023 · ACS
Since 1996, 12 flood insurance claims have been paid out in Burien. Expected damage from storms and floods is higher here than in 78% of U.S. communities. FEMA puts 85% of the town’s expected hazard losses down to earthquakes, and 13% to inland flooding. Federal aid has come to Burien households in 9 declared disasters; the latest was in 2025.
FEMA flood insurance claims · FEMA disaster declarations and aid · FEMA National Risk Index · OpenFEMA
July afternoons average 76.3°, cooler than in 98% of U.S. towns; January nights average 36.2°.
About 6 inches of snow falls in a winter. In Burien, the peak summer temperature is 76°F.
| Burien | Washington towns | U.S. towns | |
|---|---|---|---|
| July high | 76°F | 77°F | 85°F |
| January low | 36°F | 35°F | 22°F |
NOAA U.S. Climate Normals, 1991–2020
Among adults 25 and older, 33% have a four-year degree or more, against 40% across Washington. Adults 35 to 64 are 43% of residents (38% statewide). In Burien, 21% of residents are under 18.
| Burien | Washington towns | U.S. towns | |
|---|---|---|---|
| Under 18 | 21% | 22% | 22% |
| Bachelor’s degree or more, 25+ | 33% | 30% | 29% |
| Aged 65 or older | 16% | 16% | 18% |
49% women, 51% men
That’s an even split within the survey’s margin of ±1.6 points. Across Washington, 49.6% of residents are women. Median age: women 40.7, men 40.0.
| Burien | WA | U.S. | |
|---|---|---|---|
| Under 10 | 10.8% | 11.5% | 11.6% |
| 10 to 17 | 9.9% | 9.9% | 10.3% |
| 18 to 24 | 8.2% | 8.5% | 9.1% |
| 25 to 34 | 12.2% | 15.2% | 13.7% |
| 35 to 44 | 16% | 14.3% | 13.2% |
| 45 to 54 | 14.3% | 12% | 12.2% |
| 55 to 64 | 12.7% | 12% | 12.7% |
| 65 to 74 | 9.8% | 10.1% | 10.2% |
| 75 and older | 6.1% | 6.5% | 7% |
| No diploma | 15% | 7.7% | 10.4% |
| High school | 21.2% | 21.6% | 26% |
| Some college | 19.5% | 21% | 19.1% |
| Associate’s | 11.1% | 10% | 8.8% |
| Bachelor’s | 21.7% | 24% | 21.6% |
| Graduate | 11.5% | 15.6% | 14.1% |
U.S. Census Bureau · ACS 2020-2024 5-year estimates
A typical home in Burien is worth about $625,000, about the same as a year ago, 6% above the Washington typical home. Among households here, 57% live in a home they own. In Burien, the median rent is $1,782 a month.
| Burien | Washington towns | U.S. towns | |
|---|---|---|---|
| Households that own their home | 57% | 71% | 73% |
| Median rent | $1,782 a month | $1,737 a month | $1,185 a month |
| Renters paying 30%+ of income on rent | 52% | 51% | 48% |
Census ACS, 2020–24 · Zillow Home Value Index · Redfin Data Center
17 within 15 miles of the center of Burien
About 4 of every 100 Burien residents are enrolled in college, against 6 across Washington.
Where Burien’s working residents go each day. Line width shows the share.
Census LEHD 2023
8 notable people were born in Burien.


7 towns share a border with Burien.
| Town | WA rank | Overall | Cost | Safety | Schools | Health |
|---|---|---|---|---|---|---|
| Burien | #243 | D | D | D | C− | A− |
| SeaTac | #245 | D | C− | D | C− | A− |
| Tukwila | #236 | C− | C− | D− | C+ | A− |
| Normandy Park | #107 | B | D | B− | C− | A+ |
| Boulevard Park | #142 | B− | C− | — | A− | B− |
| White Center | #191 | C | D | — | C− | A− |
| Seattle | #128 | B− | D | D− | A | A+ |
| Des Moines | #235 | C− | D | C− | C− | A− |
Boulevard Park and White Center report no FBI crime data of their own. Compare Burien with a neighbor →
Short answers, built from the data on this page.
Burien grades D overall, better than 15% of U.S. towns and #243 of 285 in Washington. It grades A− for health, D for safety and C− for schools. Safety is its weak spot, with a D.
Yes. Cost of living, which also weighs rents, property taxes and how many households pay 30% or more of their income for housing, grades D.
8 notable people were born here, including Jill Kintner and Cris Lewis.


