141 years in pictures
Census counts: 183 in 1900, 83,921 in 2020. The archive holds 12 old photos and papers going back to 1917 and 3 maps from 1964 on.
1 place on the National Register of Historic Places.
- 1885Kennewick is settled
Each edition grades its towns against each other only.

A city of 88,366, settled in 1885.
Kennewick is a solid, middle-of-the-road choice. It grades C− overall, ranked 228th of 285 in Washington, with no subject far below average. Its best mark is health: CDC estimates put its residents' health ahead of 55% of the country. Its lowest everyday mark is in safety: its police reported 276 violent crimes reported to the FBI in 2025, a higher rate per resident than 89% of U.S. towns. A typical home there costs about $428K, 4.8 years of the Kennewick metro’s $89K median household income. 29% of working residents work locally in Kennewick, against 4.8% in Washington’s towns and 8% across U.S. towns. Kennewick is home to Pacific Northwest Christian College. Kennewick is more walkable than 83% of U.S. towns.
Where Kennewick beats most towns.
| College | Students |
|---|---|
| Pacific Northwest Christian College | 129 |
73,917 counted in 2010 and 83,921 in 2020; an estimated 88,366 in 2025.
Growth hasn’t slowed: 5.3% since 2020, after 13.5% in the decade before.
U.S. Census 2010 & 2020 counts · Census Bureau estimate, July 1, 2025
Each subject compared with towns across the country (schools within Washington), ordered by how far Kennewick is from typical.
How TownRatings grades towns →
Census counts: 183 in 1900, 83,921 in 2020. The archive holds 12 old photos and papers going back to 1917 and 3 maps from 1964 on.
1 place on the National Register of Historic Places.
Who provides power, water and the rest in Kennewick, and how to reach them.
EPA SDWIS (Oct 9, 2026) · HIFLD + EIA-861 2025 · Census 2020 ZCTAs · NCES 2024–25 · registration: vote.gov, updated Sep 30, 2026.
Ordered by what stands out in Kennewick.
Kennewick trades workers with Richland and other neighbors, has seen reported crime fall by a fifth or more and is healthy by national standards but behind most towns in Washington.
39 miles of trail in 31 parks and preserves. Kennewick’s trail density is 1.3 miles per square mile. The biggest place to walk is Columbia Park, 368 acres with 3.5 miles of trail.
| Kennewick | Washington towns | U.S. towns | |
|---|---|---|---|
| Miles of trail per square mile | 1.3 miles per square mile | 0.8 | 0.4 |
| Conserved land | 4.2% | 4% | 4.3% |
| Biggest places to walk | Trails | Acres |
|---|---|---|
| 1. Columbia Park | 3.5 mi | 368 |
| 2. Zintel Canyon Greenway | 2.6 mi | 66 |
| 3. Highlands Grange Park | 1.4 mi | 27 |
Trails & parks © OpenStreetMap contributors · Conserved land: USGS PAD-US
Its public schools are run by the Kennewick School District. Two of its 34 schools are below, each with why it’s listed.
| School | Level | Students | Letter |
|---|---|---|---|
| Chinook Middle SchoolLargest public middle schoolGrades 6–8 | Grades 6–8 | 950 | – |
| Kamiakin High SchoolLargest public high schoolGrades 9–12 | Grades 9–12 | 1,956 | – |
NCES · EDFacts · graded within WA on state tests and graduation
Reported crimes fell from 3,468 to 2,606 over the last three FBI years, a drop beyond ordinary year-to-year swings.
The property crime rate in Kennewick is 26.7 per 1,000 residents. Kennewick reports more crime per resident than most U.S. towns we grade: about 89% report less. The violent crime rate in Kennewick is 3.2 per 1,000 residents.
| Kennewick | Washington towns | U.S. towns | |
|---|---|---|---|
| Property crimes per 1,000 (2025) | 26.7 per 1,000 residents | 15 | 9.9 |
| Violent crimes per 1,000 (2025) | 3.2 per 1,000 residents | 1.5 | 1.6 |
FBI crime data, 2025 · crimes reported to police
61% of Kennewick households own their home. The typical Kennewick home is worth about $428,000, up 0.5% in a year, 27% below the Washington typical home. 57% of Kennewick renter households spend 30% or more of their income on rent.
| Kennewick | Washington towns | U.S. towns | |
|---|---|---|---|
| Households that own their home | 61% | 71% | 73% |
| Renters paying 30%+ of income on rent | 57% | 51% | 48% |
| Median rent | $1,240 a month | $1,740 a month | $1,185 a month |
Census ACS, 2020–24 · Zillow Home Value Index · Redfin Data Center
Kennewick has mild winters and warm summers, with very little rain. July afternoons reach 90°, January nights drop to 29° and about 2 inches of snow falls in a winter.
NOAA U.S. Climate Normals, 1991–2020
Kennewick has about as many jobs (33,289) as working residents, but only 9,963 people both live and work here.
About one in 3 of Kennewick’s working residents works in town. 14% of residents live below the poverty line in Kennewick. Jobs based in Kennewick grew to 33,289 in 2023, 5,774 more than in 2013.
| Kennewick | Washington towns | U.S. towns | |
|---|---|---|---|
| Average trip to work | 21 minutes | 27 minutes | 25 minutes |
| Below the poverty line | 14% | 7.9% | 9.6% |
| Work from home | 9.7% | 15% | 11% |
| Median household income | $74,000 | $98,000 | $80,000 |
Census LEHD 2023 · ACS
Within Washington it is less healthy than 79% of the 285 graded towns: Washington sets a high bar.
Kennewick beats the Washington average on 0 of 31 CDC measures and trails it on 16.
| Kennewick | Washington towns | U.S. towns | |
|---|---|---|---|
| Yearly checkup (CDC PLACES) | 70% | 71% | 79% |
| No health insurance, 18–64 (CDC PLACES) | 13% | 7.8% | 8.1% |
| Obesity (CDC PLACES) | 37% | 33% | 35% |
| Fair or poor health (CDC PLACES) | 21% | 17% | 19% |
| What stands out | Kennewick | WA |
|---|---|---|
| More uninsured adults | 13.1% | 8.4% |
| More adults facing a utility shut-off | 7.3% | 5.1% |
| More adults facing food insecurity | 14.4% | 10.2% |
CDC PLACES 2025 · modeled estimates for adults · CMS · HRSA
Expected storm and flood damage is higher than in 54% of U.S. communities. Since 1979, 2 flood insurance claims have been paid out in Kennewick.
FEMA flood insurance claims · FEMA National Risk Index · OpenFEMA
2 within 15 miles of the center of Kennewick
About 5 of every 100 Kennewick residents are enrolled in college, about the same as Washington.
14 notable people were born in Kennewick.
City in the United States
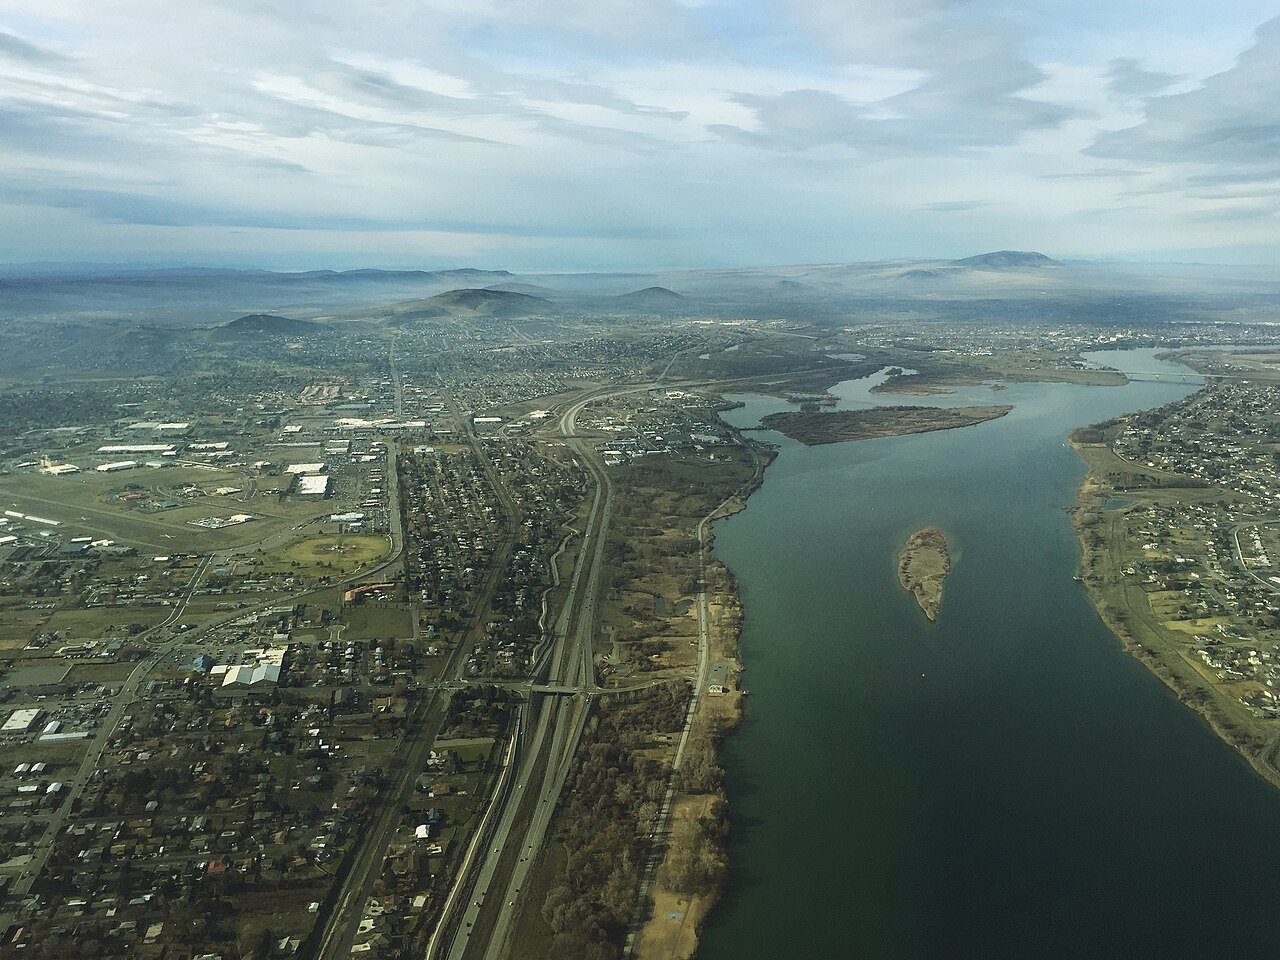
Kennewick () is a city in Benton County, Washington, United States. It is located along the southwest bank of the Columbia River, just southeast of the confluence of the Columbia and Yakima rivers and across from the confluence of the Columbia and Snake rivers. It is the most populous of the three cities collectively referred to as the Tri-Cities (the others being Pasco and Richland). The population was 83,921 at the 2020 census, and was estimated at 86,728 in 2024. The discovery of Kennewick Man along the banks of the Columbia River provides evidence of Native Americans' settlement of the area for at least 9,000 years. American settlers began moving into the region in the late 19th century…
From Wikipedia, licensed CC BY-SA 4.0 · facts via Wikidata (CC0)
3 towns share a border with Kennewick.
| Town | WA rank | Overall | Cost | Safety | Schools | Health |
|---|---|---|---|---|---|---|
| Kennewick | #228 | C− | C+ | D | C+ | B |
| Finley | #176 | C | B | — | C+ | B |
| Richland | #109 | B− | C | C | A− | A |
| Pasco | #255 | D | C+ | C− | C− | B− |
Finley reports no FBI crime data of its own. Compare Kennewick with a neighbor →
Short answers, built from the data on this page.
Kennewick grades C− overall, better than 20% of U.S. towns and #228 of 285 in Washington. It grades B for health, D for safety and C+ for schools. Safety is its weak spot, with a D.
14 notable people were born here, including Jeremy Bonderman and Michael Reilly.