Mill Creek EastWA
This town in Washington has a population of 25,453.
Is Mill Creek East a good place to live?
Mill Creek East’s best grade is for health (A+). The trade-off is cost of living (D) — the typical home is worth about $905K, 7.9 years of the Seattle metro’s $115K median household income. Put together, the subjects come to an A overall, ranking 10th of 285 in Washington. On that grade it does better than 91% of U.S. towns. Just over two thirds of adults 25 and older hold a bachelor’s degree or more in the town, against 30% in Washington’s towns and 29% across U.S. towns. The town is easier to get around on foot or by transit than 87% of U.S. towns. Only 3 of the 275 Washington towns we compare have a higher rent at the middle of the market than Mill Creek East. The median household earns $193K.
Figures: health, CDC PLACES · home values, Zillow · incomes, Census ACS, 2020–24.
What makes Mill Creek East stand out
Where Mill Creek East beats most towns.
| Widest gap | Mill Creek East | WA |
|---|---|---|
| Fewer older adults who have lost all their teeth | 4.7% | 9% |
| School | Grades | Students |
|---|---|---|
| Tambark Creek Elementary School | PK–5 | 740 |
| Fernwood Elementary | PK–5 | 714 |
| Cedar Wood Elementary | PK–5 | 682 |
Mill Creek East has grown 59% from 2010 to 2020
15,709 counted in 2010 and 24,912 in 2020.
U.S. Census 2010 & 2020 counts
How Mill Creek East grades
Each subject compared with towns across the country (schools within Washington), ordered by how far Mill Creek East is from typical.
How TownRatings grades towns →
Space Needle and 126 more within 40 miles
Museums, parks, gardens and other places to visit around Mill Creek East. Close and well known come first.
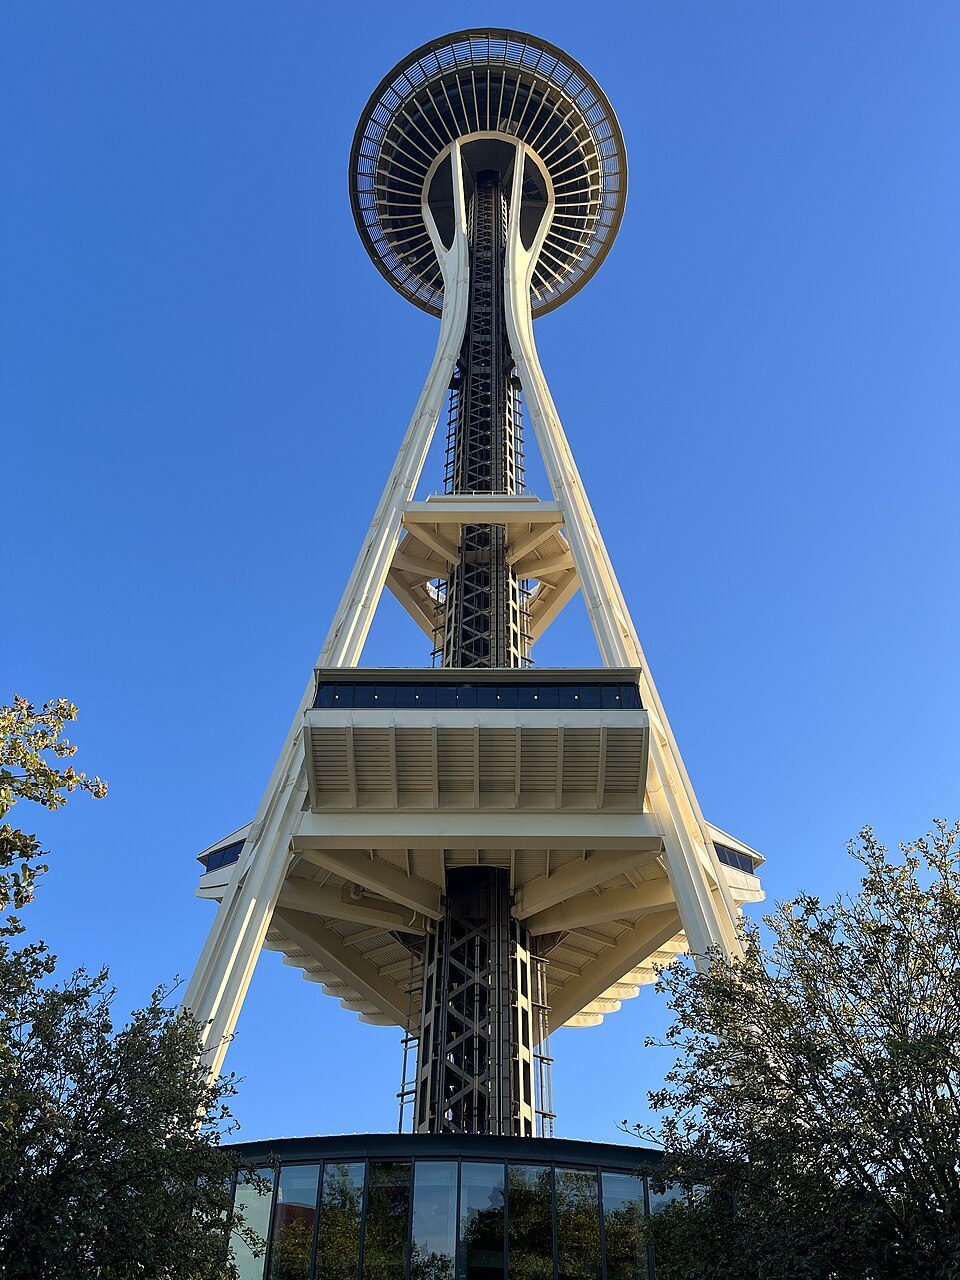 Big draw17 mi LookoutSpace Needle
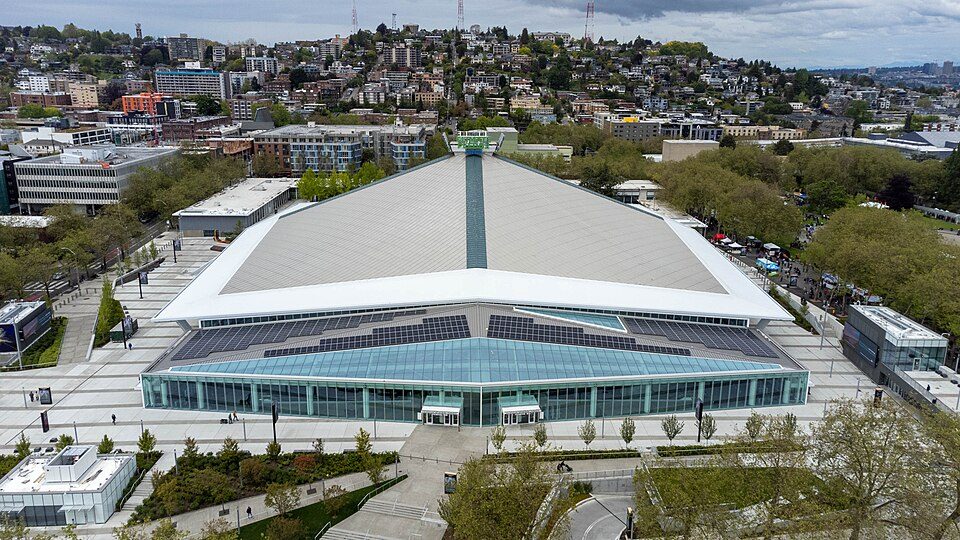 Big draw17 mi Stadium & arenaClimate Pledge Arena
 Big draw18 mi Stadium & arenaLumen Field
 18 mi Stadium & arenaT-Mobile Park
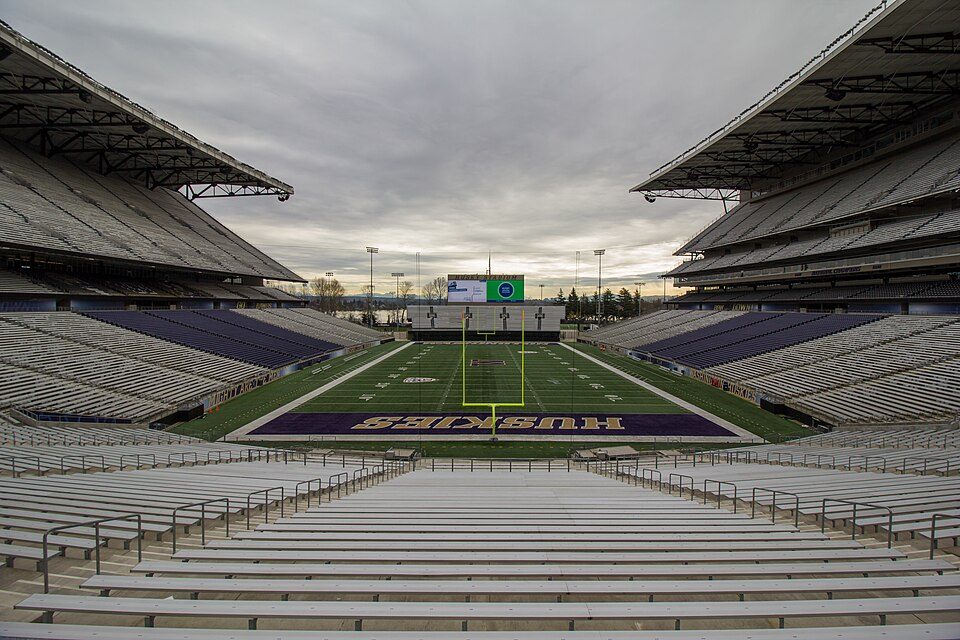 14 mi Stadium & arenaHusky Stadium
 18 mi Ancient siteSeattle Underground
Photo credits
Space Needle: Another Believer, CC BY-SA 4.0 · Climate Pledge Arena: Sea Cow, CC BY-SA 4.0 · Lumen Field: "Smart Destinations", GoSeattleCard.com, and Go Seattle Card Blog, CC BY-SA 2.0 · T-Mobile Park: MyName (Cacophony), CC BY-SA 3.0 · Husky Stadium: Atomic Taco, CC BY-SA 2.0 · Seattle Underground: Mark Hursh, CC BY-SA 3.0


Moving to Mill Creek East: who provides what
Mill Creek East is unincorporated, so Snohomish County and regional agencies provide most services.
EPA SDWIS (Oct 9, 2026) · HIFLD + EIA-861 2025 · Census 2020 ZCTAs · NCES 2024–25 · registration: vote.gov, updated Sep 30, 2026.
The data
Ordered by what stands out in Mill Creek East.
Mill Creek East has fewer 90° days than nearly all U.S. towns and has less tooth loss than most of Washington, but it has homes that cost more against local pay than most of Washington.
Protected land: 4.7% of Mill Creek East
In 4 parks and preserves, walkers have 7.9 miles of trail. Tambark Creek Park, at 39 acres with 1.4 miles of trail, is the biggest park or preserve. Mill Creek East’s concentration of trails is 1.8 miles per square mile.
| Mill Creek East | Washington towns | U.S. towns | |
|---|---|---|---|
| Miles of trail per square mile | 1.8 miles per square mile | 0.8 | 0.4 |
| Conserved land | 4.7% | 4% | 4.3% |
| Biggest places to walk | Trails | Acres |
|---|---|---|
| 1. Tambark Creek Park | 1.4 mi | 39 |
| 2. Silver Creek Park | 0.5 mi | 9 |
| 3. The Reserve Playground | 0.1 mi | 1 |
Trails & parks © OpenStreetMap contributors · Conserved land: USGS PAD-US
Public schools in Mill Creek East beat 91% of Washington districts
Its A for schools comes with a D for cost of living: the typical home is worth about $905K.
Two of its 5 schools are shown below, with the reason for each. The public schools here belong to the Northshore School District. The largest public high school is North Creek High School, with 1,910 students.
| School | Level | Students | Letter |
|---|---|---|---|
| Tambark Creek Elementary SchoolLargest public elementary schoolGrades PK–5 | Grades PK–5 | 740 | – |
| North Creek High SchoolLargest public high schoolGrades 9–12 | Grades 9–12 | 1,910 | – |
NCES · EDFacts · graded within WA on state tests and graduation
Among the healthiest U.S. towns
Its widest gap with Washington is tooth loss: 4.7% of those 65+ have lost all their teeth, against 9% statewide.
In Mill Creek East, 8.9% of adults report frequent physical distress, and 25% have obesity. The town beats the Washington average on 23 of 31 CDC measures and trails it on 2. 14% of adults report frequent mental distress in the town. Among 285 Washington towns, just 10 have a lower share of adults who have high blood pressure than Mill Creek East.
| Mill Creek East | Washington towns | U.S. towns | |
|---|---|---|---|
| High blood pressure (CDC PLACES) | 23% | 31% | 35% |
| Frequent physical distress (CDC PLACES) | 8.9% | 13% | 14% |
| Obesity (CDC PLACES) | 25% | 33% | 35% |
| Frequent mental distress (CDC PLACES) | 14% | 17% | 17% |
| What stands out | Mill Creek East | WA |
|---|---|---|
| Fewer older adults who have lost all their teeth | 4.7% | 9% |
| Fewer adults with COPD | 2.8% | 5.1% |
| Fewer adults treating high blood pressure | 65.1% | 70.7% |
CDC PLACES 2025 · modeled estimates for adults · CMS · HRSA
Mill Creek East stands out in Washington and nationally, with the median household income higher than most
Mill Creek East has 2,144 jobs for its 12,113 working residents: even if every job went to a resident, most would still commute out. Jobs based here grew from 1,253 in 2013 to 2,144.
For working residents in Mill Creek East, the share who work locally is 1%. The town had 2,144 jobs in 2023, up 891 from 2013. In Mill Creek East, the average trip to work is 33 minutes. The top destinations are Seattle (25%), Redmond (14%) and Bellevue (10%).
| Mill Creek East | Washington towns | U.S. towns | |
|---|---|---|---|
| Work from home | 33% | 15% | 11% |
| Median household income | $193,000 | $98,000 | $80,000 |
| Average trip to work | 33 minutes | 27 minutes | 25 minutes |
| Below the poverty line | 4.1% | 7.9% | 9.6% |
Where working residents work
Census LEHD 2023 · ACS
The climate in Mill Creek East brings mild winters and pleasant summers
The Monroe weather station, 9 miles away, records that about 2 days a year reach 90°, fewer than in 98% of U.S. towns. July afternoons average 74.1°, cooler than in 99% of U.S. towns; January nights average 35.6°.
About 3 inches of snow falls in a winter. In Mill Creek East, the typical July afternoon high is 74°F.
| Mill Creek East | Washington towns | U.S. towns | |
|---|---|---|---|
| July high | 74°F | 77°F | 85°F |
| January low | 36°F | 35°F | 22°F |
Typical low → high °F
NOAA U.S. Climate Normals, 1991–2020
Moderate risk in Mill Creek East, with earthquakes at the top
Storm and flood damage is expected to run higher than in 52% of U.S. communities. 52% of Mill Creek East’s expected losses from natural hazards come from earthquakes, followed by inland flooding at 39%. This Washington town has had one paid flood insurance claim since 2010.
FEMA National Risk Index · OpenFEMA
Compared with most of Washington and the rest of the country, the median rent in Mill Creek East is higher
At 7.9 years of the Seattle metro’s $115K median household income, the typical home costs more against local pay than in 86% of Washington towns; that ratio is one input to its D for cost of living. The median property tax bill is $7,497, against $4,556 across Washington, another input to its cost-of-living grade.
Among households in Mill Creek East, 83% own their home. The median sale price was $959,000 in September 2026. A home in Mill Creek East typically sold within 31 days of listing.
| Mill Creek East | Washington towns | U.S. towns | |
|---|---|---|---|
| Median rent | $3,152 a month | $1,737 a month | $1,185 a month |
| Households that own their home | 83% | 70% | 73% |
Census ACS, 2020–24 · Zillow Home Value Index · Redfin Data Center
Everything we know about Mill Creek East
Colleges nearby
12 within 15 miles of the center of Mill Creek East
About 4 of every 100 Mill Creek East residents are enrolled in college, against 6 across Washington.
99% of working residents leave Mill Creek East for work
Where Mill Creek East’s working residents go each day. Line width shows the share.
Census LEHD 2023
About Mill Creek East
CDP in Washington, United States
Mill Creek East is a census-designated place (CDP) located in Snohomish County, Washington. The population was 24,912 at the 2020 census. The CDP comprises an area southeast of the city of Mill Creek that includes many new single-family housing developments as well as the new North Creek High School.
From Wikipedia, licensed CC BY-SA 4.0 · facts via Wikidata (CC0)
- Area
- 4.5 sq mi
- Elevation
- 354 ft
- Area code
- 360
Mill Creek East’s neighbors
5 towns share a border with Mill Creek East.
| Town | WA rank | Overall | Cost | Safety | Schools | Health |
|---|---|---|---|---|---|---|
| Mill Creek East | #10 | A | D | — | A | A+ |
| Mill Creek | #24 | A− | D− | — | A | A+ |
| Bothell East | #5 | A | D− | — | A+ | A+ |
| Martha Lake | #82 | B | D | — | B | A |
| Silver Firs | #22 | A− | D | — | A | A |
| Clearview | #14 | A | D | — | A | A+ |
Mill Creek East, Mill Creek, Bothell East, Martha Lake, Silver Firs and Clearview report no FBI crime data of their own. Compare Mill Creek East with a neighbor →
Questions about Mill Creek East
Short answers, built from the data on this page.
Is Mill Creek East, WA a good place to live?
For most people who can afford it, yes. Mill Creek East grades A overall, better than 91% of U.S. towns and #10 of 285 in Washington. It grades A+ for health and A for schools. Cost of living is its weak spot, with a D.
Is Mill Creek East, WA expensive?
Yes. The typical home is worth about $905,000, 54% above the Washington typical home. Cost of living, which also weighs rents, property taxes and how many households pay 30% or more of their income for housing, grades D.