Guest, Sign inJoin

Post to Richland

We’ll email a one-tap link to publish your post. No password, and nothing is public until you click it.
Already a member? Sign in
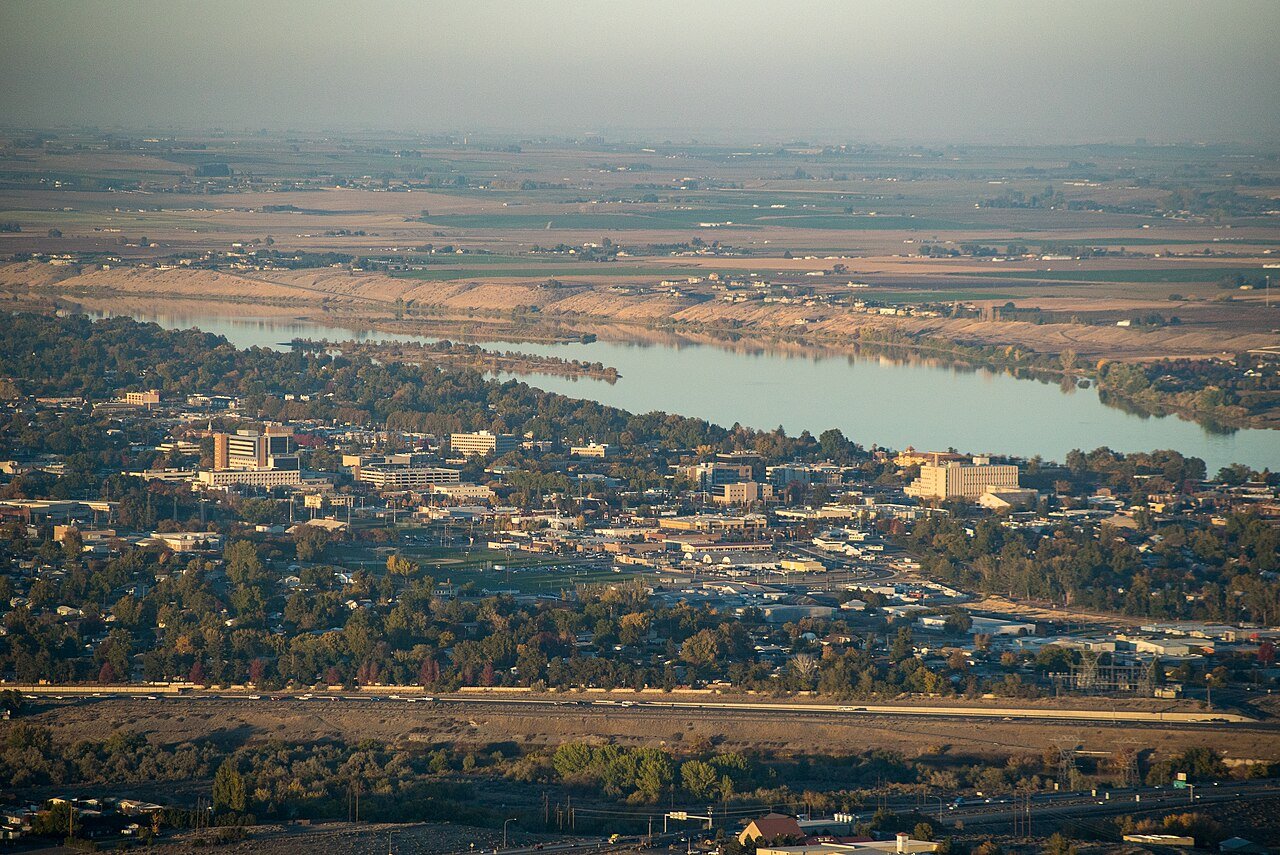
Downtown Richland
Washington›Benton County

RichlandWA

A city of 65,258, settled in 1905.

3 bordering townsMap →
Photo: Corbin Harder · CC BY-SA 4.0
Photo of Richland

Richland, WA · Photo: Corbin Harder · CC BY-SA 4.0 · Source ↗

Is Richland a good place to live?

Richland's standout: it has 86 miles of trail. Overall it grades B−, 109th of 285 graded towns in Washington. It is healthier than 86% of U.S. towns and its schools outperform 75% of the state's. Its weakest subject is safety: its crime rate is higher than 75% of U.S. towns, with 166 violent crimes reported to the FBI in 2025. 41% of working residents work locally in Richland, above both the Washington town median (4.8%) and the median of U.S. towns (8%). Richland has 2 places on the National Register of Historic Places, among them Gold Coast Historic District and Post Office and Federal Office Building. Richland is more walkable than 80% of U.S. towns.

What makes Richland stand out

Where Richland beats most towns.

A growing town

Richland has grown 36% since 2010

48,058 counted in 2010 and 60,560 in 2020; an estimated 65,258 in 2025.

Growth hasn’t slowed: 7.7% since 2020, after 26% in the decade before.

48,0582010
60,5602020
65,2582025 est.

U.S. Census 2010 & 2020 counts · Census Bureau estimate, July 1, 2025

How Richland grades

Each subject compared with towns across the country (schools within Washington), ordered by how far Richland is from typical.

How grading works
Character Graded, but not part of the overall grade.
Described, not graded Taste, not quality: snow or an older crowd is neither good nor bad.

How TownRatings grades towns →

Gold Coast Historic District
Gold Coast Historic District · National Register of Historic Places
Richland’s story

121 years in pictures

Census counts: 350 in 1910, a low of 208 in 1930, 60,560 in 2020. The archive holds 24 old photos and papers going back to 1917 and 3 maps from 1951 on.

2 places on the National Register of Historic Places.

  • 1905Richland is settled
Explore the history →
Getting set up

Moving to Richland: who provides what

Who provides power, water and the rest in Richland, and how to reach them.

The full setup list →
PowerCity of Richland10.0¢/kWh · EIA 2025HIFLD · EIA
WaterCity of Richland water systemNo health-based violations in 5 years · EPAEPA
Internet10 providers100% of addresses get 100/20 MbpsFCC
Trash & dumpNot on file yetWe don’t have Richland’s trash rules yet
SchoolsRichland School DistrictWhich school depends on your addressNCES
Register to voteOnlineIn Washington you can register online until 8 days before Election Day, in person up to and including Election Day, or by mail (received 8 days before).vote.gov
Who runs elections hereBenton County AuditorBenton County; contacts on the Handbook page.FVAP, Jun 2022
ZIP codes99352, 9935499352 58% · 99354 41%Census 2020

EPA SDWIS (Oct 9, 2026) · HIFLD + EIA-861 2025 · Census 2020 ZCTAs · NCES 2024–25 · registration: vote.gov, updated Sep 30, 2026.

The data

Ordered by what stands out in Richland.

Richland draws workers from Kennewick and beyond, fares better on crime within Washington than nationally and is one of Washington’s best towns for the outdoors.

OutdoorsA+

Richland has set aside 21.4% of its land for conservation

Its A+ for the outdoors ranks #8 of 285 in Washington.

The trail density in Richland is 1.9 miles per square mile. Yakima Delta, at 690 acres with 6.9 miles of trail, is the biggest park or preserve.

#40for trails in WA
21.4%
conserved · 6,231 of 29,125 acres
86 mi
of trails · 1.9 per sq mi
Biggest places to walkTrailsAcres
1. Chamna Natural Preserve14.6 mi444
2. Yakima Delta6.9 mi690
3. W. E. Johnson Park4.7 mi268

Trails & parks © OpenStreetMap contributors · Conserved land: USGS PAD-US

SchoolsA−

For schools, Richland earns an A−

Its A− is the best School Grade on its borders; West Richland (B+) is next.

Its public schools are run by the Richland School District. Two of its 23 schools are below, each with why it’s listed.

75%of WA districts it outscoresA−School Grade
SchoolLevelStudentsLetter
Carmichael Middle SchoolLargest public middle schoolGrades 6–8Grades 6–8791–
Richland High SchoolLargest public high schoolGrades 9–12Grades 9–122,218–

NCES · EDFacts · graded within WA on state tests and graduation

Work & commuteJobs & income grade B

About one in two working residents works right in Richland

41,607 jobs are based in Richland, 1.5 for every working resident, so most of the people who work here commute in. The average commute takes 20.4 minutes, against 26.6 across Washington.

Richland’s average trip to work is 20 minutes. Since 2013, Richland has added 7,786 jobs, to 41,607 in 2023. The top destinations are Kennewick (17%), Pasco (9%) and West Richland (4%).

41%work in town
RichlandWashington townsU.S. towns
Average trip to work20 minutes27 minutes25 minutes
Work from home16%15%11%
Median household income$96,000$98,000$80,000

Where working residents work

In Richland41%
Kennewick17%
Pasco9%
West Richland4%
Seattle2%
6 mi
median commute distance
41,607
jobs based in Richland
A job hub
jobs vs. working residents
A−
Walkability grade: more walkable than 80% of U.S. towns

Census LEHD 2023 · ACS

HealthA

For health, Richland earns an A

30% of Richland adults sleep under 7 hours. Richland beats the Washington average on 5 of 31 CDC measures and trails it on 1. 9% of Richland adults smoke cigarettes.

86%healthier than U.S. townsAHealth Grade
RichlandWashington townsU.S. towns
Sleep under 7 hours (CDC PLACES)30%33%36%
Smoke cigarettes (CDC PLACES)9%11%14%
High blood pressure (CDC PLACES)29%31%35%
Yearly checkup (CDC PLACES)72%71%79%
31 measures vs. Washington
5 better25 too close to call1 worse
What stands outRichlandWA
Fewer older adults who have lost all their teeth7.2%9%
Fewer adults facing food insecurity8.4%10.2%
More adults who have had cancer9%7.9%
Kadlec Regional Medical Center
0.7 mi away · emergency room
3 of 3
care shortages: primary care, dental, mental health
71st
percentile among WA towns

CDC PLACES 2025 · modeled estimates for adults · CMS · HRSA

SafetyC

For safety, Richland earns a C

At 31.8 crimes per 1,000 residents a year, it reports more crime than 60% of Washington’s graded towns. Reported crimes fell from 1,799 to 1,488 over the last three FBI years, a drop beyond ordinary year-to-year swings.

Richland reports more crime per resident than most U.S. towns we grade: about 75% report less.

25%of U.S. towns report more crimeCSafety Grade
RichlandWashington townsU.S. towns
Property crimes per 1,000 (2025)20.3 per 1,000 residents159.9
Violent crimes per 1,000 (2025)2.5 per 1,000 residents1.51.6

Violent crime per 1,000 residents

Richland2.5
Washington2.9
U.S.3.3

Property crime per 1,000 residents

Richland20.3
Washington20.2
U.S.15.5
25th
percentile among U.S. towns we grade
40th
percentile among WA towns
166
violent crimes reported in 2025
1,322
property crimes reported in 2025

FBI crime data, 2025 · crimes reported to police

HousingCost of living grade C

The typical home in Richland is valued at about $463K

The typical Richland home is worth about $463,000, about the same as a year ago, 21% below the Washington typical home. 39% of renter households spend 30% or more of their income on rent in Richland.

$463KZillow home value
RichlandWashington townsU.S. towns
Renters paying 30%+ of income on rent39%51%48%
Households that own their home64%71%73%
Median rent$1,468 a month$1,740 a month$1,185 a month

Typical home value

Richland$463K
Washington$588K
Market temperature
BalancedA seller's marketBuyer’sSeller’s
52
days on market
99.4%
sale-to-list price
+0.4%
value change, 1 year
105
homes sold in May

Census ACS, 2020–24 · Zillow Home Value Index · Redfin Data Center

Climate

In Richland, expect mild winters and hot summers

Richland has mild winters and warm summers, with very little rain. Only 10 of the 285 Washington towns we compare have a higher July high than Richland.

2″snow a winter

Typical low → high °F

Winter29–43°
Spring41–66°
Summer57–87°
Fall41–65°
Oct 24
typical first frost
Apr 6
typical last frost
+1.0°
vs. the 20th-century average

NOAA U.S. Climate Normals, 1991–2020

Who lives here

An age mix much like Washington’s

No broad age group is more than 4 points off the Washington average. Richland has grown 7.7% since 2020, to 65,258 residents in the Census Bureau’s 2025 estimate. 47% of adults 25 and older have a bachelor’s degree or more, vs 40% across Washington.

36.4median age · WA 38.3
RichlandWashington townsU.S. towns
Bachelor’s degree or more, 25+47%30%29%
Median age36.4 years38.6 years40.5 years
Under 1824%22%22%
RichlandWashingtonUnited States

Ages · share of residents

Education · adults 25 and older

No diploma5%
High school17%
Some college21%
Associate’s10%
Bachelor’s26%
Graduate21%

Women and men · all residents

49% women, 51% men

About 105 men for every 100 women (the survey’s margin: ±1.1 points). Across Washington, 49.6% of residents are women. Median age: women 38.7, men 34.9.

Ages and education in Richland
RichlandWAU.S.
Under 1012.8%11.5%11.6%
10 to 1711.3%9.9%10.3%
18 to 248.4%8.5%9.1%
25 to 3415.5%15.2%13.7%
35 to 4413.4%14.3%13.2%
45 to 5410.1%12%12.2%
55 to 6411.7%12%12.7%
65 to 749.4%10.1%10.2%
75 and older7.6%6.5%7%
No diploma4.5%7.7%10.4%
High school17.3%21.6%26%
Some college21.3%21%19.1%
Associate’s10.2%10%8.8%
Bachelor’s26.1%24%21.6%
Graduate20.5%15.6%14.1%

Census population estimates, 2025 · U.S. Census Bureau · ACS 2020-2024 5-year estimates

Natural hazardsHazard risk grade B−

Richland faces a moderate natural-hazard risk, led by inland flooding

Expected storm and flood damage is lower than in 54% of U.S. communities. Since 1982, 15 flood insurance claims have been paid out in Richland.

46risk score of 100
FEMA risk score
46Moderate riskLowerHigher
Inland floodingEarthquakesHeat waves
15
paid flood claims since 1982
1
federal disasters paid out here

FEMA flood insurance claims · FEMA National Risk Index · OpenFEMA

Keep exploring

Everything we know about Richland

20pages on Richland
After high school

Colleges nearby

2 within 15 miles of the center of Richland

Get outside

86 miles of trails in Richland

21.4% of the town is conserved land, across 73 parks and preserves.

Map of trails and conserved land in RichlandConservedTrails
1
Chamna Natural Preserve14.6 mi of trails · 444 acres
Directions
2
Yakima Delta6.9 mi of trails · 690 acres
Directions
3
W. E. Johnson Park4.7 mi of trails · 268 acres
Directions
Trails © OpenStreetMap contributors · USGS PAD-US

Famous people from Richland

30 notable people were born in Richland.

See all 30 →

About Richland

City in Washington, United States

Official town website ↗

Richland () is a city in Benton County, Washington, United States. It is located in southeastern Washington at the confluence of the Yakima and the Columbia Rivers. As of the 2020 census, the city's population was 60,560. Along with the nearby cities of Pasco and Kennewick, Richland forms the Tri-Cities metropolitan area. The townsite was established in 1905 and incorporated as Richland in 1910. The U.S. Army acquired the city and surrounding areas in 1943 for the establishment of the Hanford nuclear site, part of the Manhattan Project during World War II. Richland was transformed into a bedroom community for Hanford workers and grew to 25,000 residents by the end of the war. The city remai…

From Wikipedia, licensed CC BY-SA 4.0 · facts via Wikidata (CC0)

Established
1905
Area
42 sq mi
Elevation
384 ft
ZIP code
99352, 99354
Area code
509

Richland’s neighbors

3 towns share a border with Richland.

Explore the map →
How the neighbors grade
TownWA rankOverallCostSafetySchoolsHealth
Richland#109B−CCA−A
Kennewick#228C−C+DC+B
West Richland#40B+CB+B+A
Pasco#255DC+C−C−B−

Compare Richland with a neighbor →

Questions about Richland

Short answers, built from the data on this page.

Is Richland, WA a good place to live?

Richland grades B− overall, better than 54% of U.S. towns and #109 of 285 in Washington. It grades A for health, C for safety and A− for schools. Safety is its weak spot, with a C.

Is Richland, WA expensive?

That is 5.2 years of the area's median household income ($89,010 across the Kennewick-Richland, WA metro area).

What is Richland, WA known for?

30 notable people were born here, including Orson Scott Card and Hope Solo.