Guest, Sign inJoin

Post to Pullman

We’ll email a one-tap link to publish your post. No password, and nothing is public until you click it.
Already a member? Sign in
Pullman
Washington›Whitman County

PullmanWA

A town of 33,756, settled in 1881. Public schools that outperform most of Washington.

Trash & recycling
U.S. Post Office-Pullman · Photo: Joe Mabel · CC BY-SA 3.0
Photo of Pullman

Pullman, WA · U.S. Post Office-Pullman · Photo: Joe Mabel · CC BY-SA 3.0

Is Pullman a good place to live?

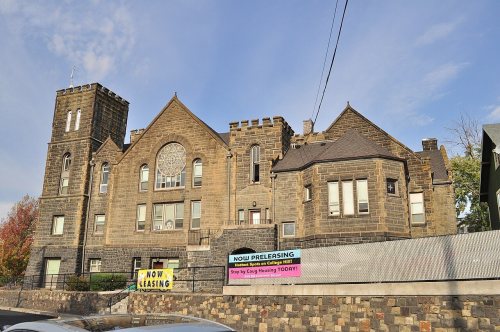
For most people who can afford it, yes. Pullman grades B overall, 74th of 285 graded towns in Washington. Its public schools beat 91% of Washington towns on state tests and graduation and residents are healthier than 78% of U.S. towns on CDC estimates. The catch is cost: homes are expensive, about $428K for a typical one and 7.7 times the Pullman area’s $55K median household income. 30% of residents live below the poverty line in Pullman, against 7.9% in Washington’s towns and 9.6% across U.S. towns. Only 25 of Washington’s 397 towns score higher on hazard risk. Pullman has 12 places on the National Register of Historic Places, among them United Presbyterian Church and William Swain House.

What makes Pullman stand out

Where Pullman beats most towns.

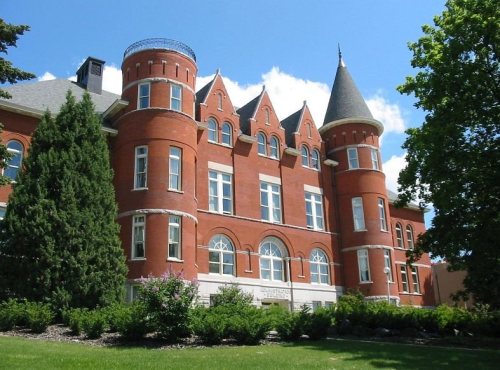
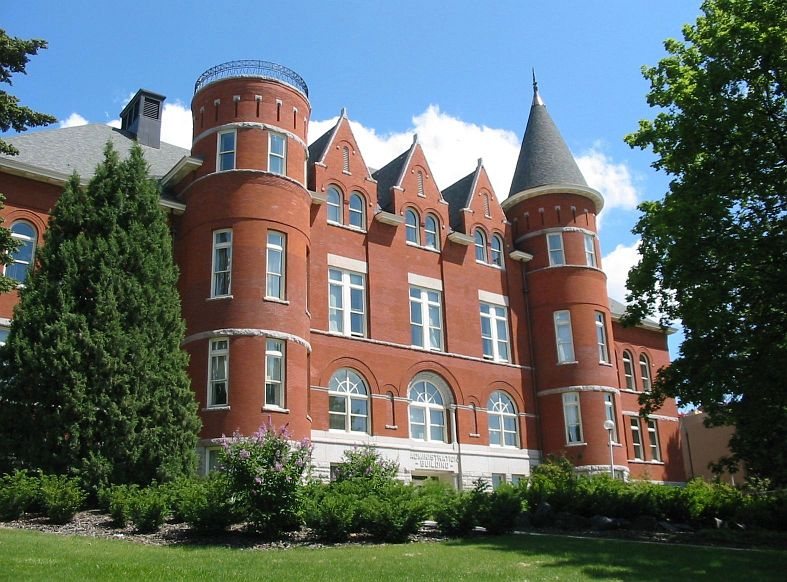
Albert W. Thompson Hall
Albert W. Thompson Hall · National Register of Historic Places
Pullman’s story

145 years in pictures

Census counts: 868 in 1890, 32,901 in 2020. The archive holds 12 old photos and papers going back to 1892 and 2 maps from 1964 on.

12 places on the National Register of Historic Places.

  • 1881Pullman is settled
Explore the history →

How Pullman grades

Each subject compared with towns across the country (schools within Washington), ordered by how far Pullman is from typical.

How grading works

Its grades run from A for schools (better than 91% of comparable towns) to D− for cost of living (better than 4%), so the B overall blends very different results.

Character Graded, but not part of the overall grade.
Described, not graded Taste, not quality: snow or an older crowd is neither good nor bad.

How TownRatings grades towns →

Getting set up

Moving to Pullman: who provides what

Who provides power, water and the rest in Pullman, and how to reach them.

The full setup list →
PowerAvista14.2¢/kWh · EIA 2025HIFLD · EIA
WaterCity of Pullman Water DepartmentNo health-based violations in 5 years · EPAEPA
Internet6 providers97% of addresses get 100/20 MbpsFCC
Trash & dumpFrom the town’s siteTrash and recycling rulesTown site
SchoolsPullman School DistrictWhich school depends on your addressNCES
Register to voteOnlineIn Washington you can register online until 8 days before Election Day, in person up to and including Election Day, or by mail (received 8 days before).vote.gov
Who runs elections hereWhitman County AuditorWhitman County; contacts on the Handbook page.FVAP, Sep 2024
ZIP code9916399163 100%Census 2020

EPA SDWIS (Oct 9, 2026) · HIFLD + EIA-861 2025 · Census 2020 ZCTAs · NCES 2024–25 · registration: vote.gov, updated Sep 30, 2026.

The data

Ordered by what stands out in Pullman.

Pullman carries less natural-hazard risk than nearly all of Washington (mostly inland flooding), is shaped by its college students and fares better on crime within Washington than nationally.

SchoolsA

For schools, Pullman earns an A

Its A for schools comes with a D− for cost of living: the typical home is worth about $428K.

Its public schools are run by the Pullman School District. Two of its 7 schools are below, each with why it’s listed. The largest public high school is Pullman High School, with 838 students.

91%of WA districts it outscoresASchool Grade
SchoolLevelStudentsLetter
Lincoln Middle SchoolLargest public middle schoolGrades 6–8Grades 6–8643–
Pullman High SchoolLargest public high schoolGrades 9–12Grades 9–12838–

NCES · EDFacts · graded within WA on state tests and graduation

OutdoorsA−

Pullman has set aside 3.4% of its land for conservation

15 miles of trail in 17 parks and preserves. The trail density in Pullman is 1.4 miles per square mile. The biggest place to walk is Washington State University Arboretum, 110 acres with 1.8 miles of trail.

#78for trails in WA
PullmanWashington townsU.S. towns
Miles of trail per square mile1.4 miles per square mile0.80.4
Conserved land3.4%4%4.3%
3.4%
conserved · 239 of 7,065 acres
15 mi
of trails · 1.4 per sq mi
Biggest places to walkTrailsAcres
1. Washington State University Arboretum1.8 mi110
2. Conservation Park1.1 mi19
3. Sunnyside Park1 mi21

Trails & parks © OpenStreetMap contributors · Conserved land: USGS PAD-US

HealthA−

Pullman stands out in Washington and nationally, with fewer of its adults who have high blood pressure

Against the 4,587 U.S. towns with household incomes like Pullman’s, it is healthier than 99%, so its A− isn’t only a matter of income.

19% of Pullman adults have high blood pressure. Among 285 Washington towns, just 5 have a lower share of adults who have diabetes than Pullman. 31% of Pullman adults have been diagnosed with depression.

78%healthier than U.S. townsA−Health Grade
PullmanWashington townsU.S. towns
Frequent mental distress (CDC PLACES)24%17%17%
High blood pressure (CDC PLACES)19%31%35%
Yearly checkup (CDC PLACES)64%71%79%
Diabetes (CDC PLACES)5.1%9.8%12%
31 measures vs. Washington
8 better12 too close to call11 worse
What stands outPullmanWA
Fewer adults who have had cancer3.8%7.9%
Fewer adults with arthritis13%24.4%
More adults without reliable transportation14.9%7.2%
Pullman Regional Hospital
1.4 mi away · emergency room
3 of 3
care shortages: primary care, dental, mental health
58th
percentile among WA towns

CDC PLACES 2025 · modeled estimates for adults · CMS · HRSA

Natural hazardsHazard risk grade A−

Pullman faces a low natural-hazard risk, led by inland flooding

FEMA rates its natural-hazard risk lower than 92% of Washington towns, with expected losses of about $72 per resident a year; that rating is what its A− for hazard risk is built on.

Pullman’s FEMA risk score is 25 of 100. Since 1979, 24 flood insurance claims have been paid out in Pullman.

25risk score of 100
FEMA risk score
25Low riskLowerHigher
Inland floodingCold wavesHeat waves
24
paid flood claims since 1979
1
federal disasters paid out here

FEMA flood insurance claims · FEMA National Risk Index · OpenFEMA

HousingCost of living grade D−

A smaller share of households in Pullman own their home than in the typical Washington or U.S. town

At 7.7 years of the Pullman area’s $55K median household income, the typical home (about $428K) costs more against local pay than in 83% of Washington towns; that ratio is one input to its D− for cost of living. 64.5% of renter households pay 30% or more of their income for housing, against 49.9% across Washington.

32% of households own their home in Pullman. The typical Pullman home is worth about $428,000, down 1.2% in a year, 27% below the Washington typical home. 65% of renter households spend 30% or more of their income on rent in Pullman.

$428KZillow home value
PullmanWashington townsU.S. towns
Households that own their home32%71%73%
Renters paying 30%+ of income on rent65%51%48%
Median rent$1,062 a month$1,740 a month$1,185 a month

Typical home value

Pullman$428K
Washington$588K
Market temperature
Seller’s marketA seller's marketBuyer’sSeller’s
15
days on market
99.4%
sale-to-list price
−1.2%
value change, 1 year
29
homes sold in May

Census ACS, 2020–24 · Zillow Home Value Index · Redfin Data Center

Climate

Pullman has four seasons and pleasant summers

Pullman has chilly, snowy winters and pleasant summers, with very little rain. July afternoons reach 84°, January nights drop to 27° and about 33 inches of snow falls in a winter.

33″snow a winter

Typical low → high °F

Winter27–39°
Spring37–58°
Summer49–80°
Fall37–60°
Sep 29
typical first frost
May 6
typical last frost
+1.7°
vs. the 20th-century average

NOAA U.S. Climate Normals, 1991–2020

Work & commuteJobs & income grade C+

A job hub: Pullman has 1.4 jobs for every working resident and draws in 8,434 commuters

The average commute for its 10,462 working residents takes 14.6 minutes, against 26.6 across Washington.

60% of Pullman’s working residents work right in town. Among 285 Washington towns, just 2 have a lower median household income than Pullman. Since 2013, Pullman has added 1,258 jobs, to 14,677 in 2023.

60%work in town
PullmanWashington townsU.S. towns
Working residents who work in town60%4.8%8%
Average trip to work15 minutes27 minutes25 minutes
Median household income$47,000$98,000$80,000
Work from home11%15%11%

Where working residents work

In Pullman60%
Moscow6%
Spokane3%
Richland2%
Lewiston2%
2 mi
median commute distance
14,677
jobs based in Pullman
Balanced
jobs vs. working residents
A
Walkability grade: more walkable than 86% of U.S. towns

Census LEHD 2023 · ACS

SafetyB

Pullman is safer than 59% of U.S. towns, by crime per resident

At 14.9 crimes per 1,000 residents a year, it reports less crime than 82% of Washington’s graded towns. Reported crimes fell from 386 to 315 over the last three FBI years, a drop beyond ordinary year-to-year swings.

59%of U.S. towns report more crimeBSafety Grade

Violent crime per 1,000 residents

Pullman1.5
Washington2.9
U.S.3.3

Property crime per 1,000 residents

Pullman7.8
Washington20.2
U.S.15.5
59th
percentile among U.S. towns we grade
82nd
percentile among WA towns
52
violent crimes reported in 2025
263
property crimes reported in 2025

FBI crime data, 2025 · crimes reported to police

Keep exploring

Everything we know about Pullman

20pages on Pullman
After high school

Colleges nearby

3 within 15 miles of the center of Pullman

College town

45% of Pullman is in college

College Scorecard · IPEDS

Landmarks

12 places in Pullman on the National Register of Historic Places.

All landmarks →

Famous people from Pullman

29 notable people were born in Pullman.

See all 29 →

Questions about Pullman

Short answers, built from the data on this page.

Is Pullman, WA a good place to live?

For most people who can afford it, yes. Pullman grades B overall, better than 64% of U.S. towns and #74 of 285 in Washington. It grades A− for health, B for safety and A for schools. Cost of living is its weak spot, with a D−.

What is Pullman, WA known for?

29 notable people were born here, including Jim Mattis and Robert W. Clower.