167 years in pictures
Census counts: 149 in 1880, 10,126 in 2020. The archive holds 6 old photos and papers going back to 1874 and 4 maps from 1944 on.
1 place on the National Register of Historic Places.
- 1859Snohomish is settled
Each edition grades its towns against each other only.

Snohomish grades B− overall, ranked 125th of 285 in Washington, with clear strengths and some subjects that lag. Its schools rank ahead of 84% of Washington towns and residents are healthier than 77% of U.S. towns on CDC estimates. On the other side, FEMA rates its natural-hazard risk higher than 84% of U.S. communities, with earthquakes at the top. Snohomish’s density of trails is 1.5 miles per square mile, above both the Washington town median (0.8) and the median of U.S. towns (0.4). Snohomish is more walkable than 93% of U.S. towns. Only 25 of Washington’s 397 towns score higher on history.
Where Snohomish beats most towns.
| School | Grades | Students |
|---|---|---|
| Central Emerson Elementary | K–6 | 477 |
| Cascade View Elementary | K–6 | 412 |
| St. Michael Catholic School | PK–8 | 165 |
9,098 counted in 2010 and 10,126 in 2020; an estimated 10,719 in 2025.
Growth hasn’t slowed: 5.9% since 2020, after 11.3% in the decade before.
U.S. Census 2010 & 2020 counts · Census Bureau estimate, July 1, 2025
Each subject compared with towns across the country (schools within Washington), ordered by how far Snohomish is from typical.
How TownRatings grades towns →
Census counts: 149 in 1880, 10,126 in 2020. The archive holds 6 old photos and papers going back to 1874 and 4 maps from 1944 on.
1 place on the National Register of Historic Places.
Museums, parks, gardens and other places to visit around Snohomish. Close and well known come first.
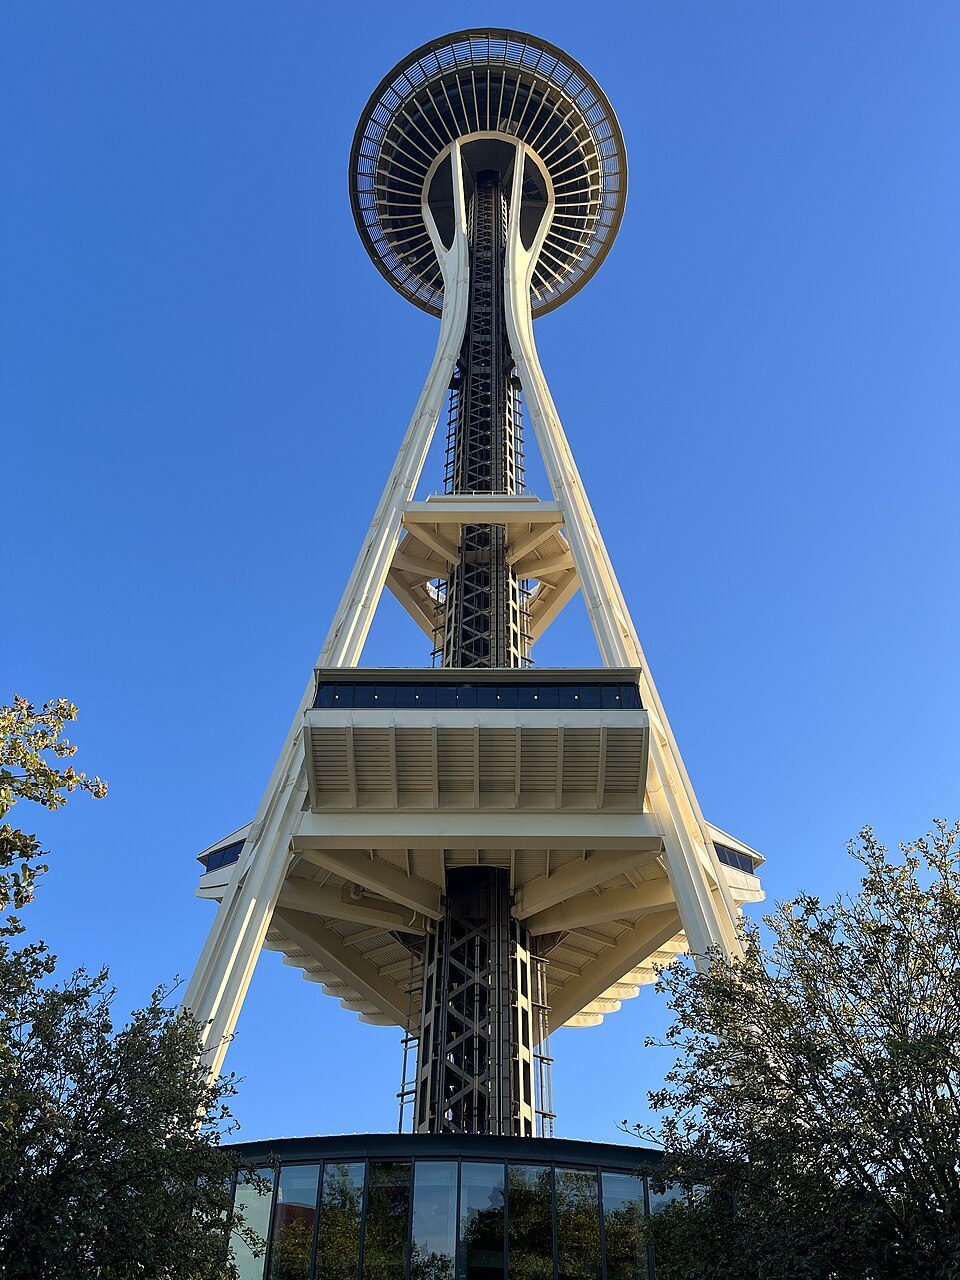
Big draw24 mi LookoutSpace Needle
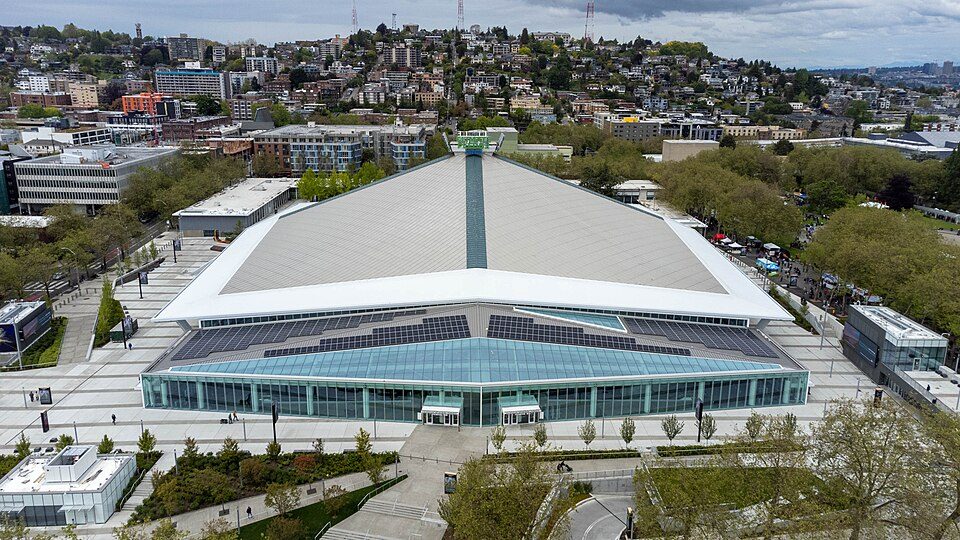
Big draw24 mi Stadium & arenaClimate Pledge Arena
Big draw26 mi Stadium & arenaLumen Field
26 mi Stadium & arenaT-Mobile Park
25 mi Ancient siteSeattle Underground
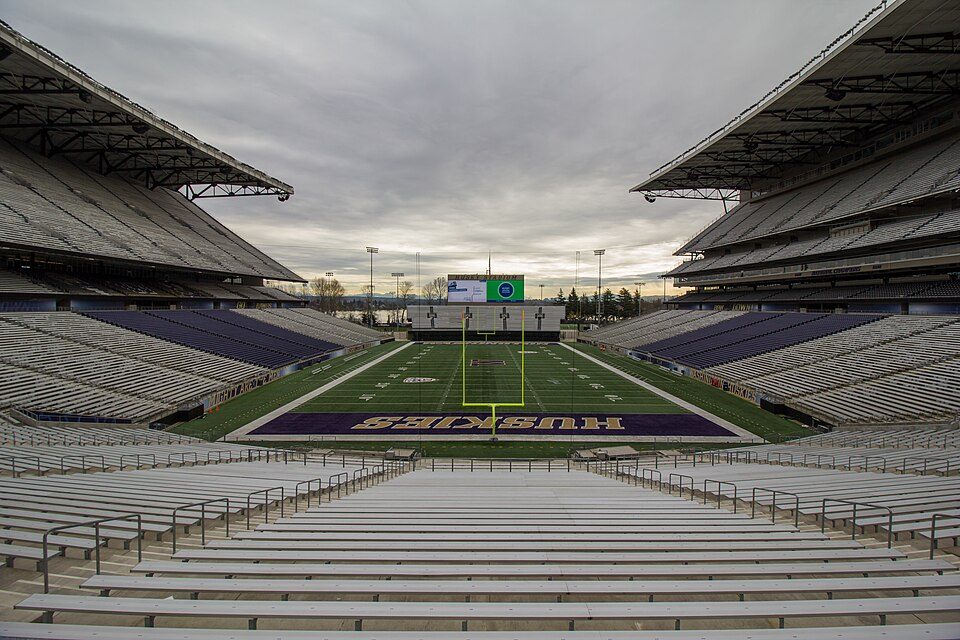
22 mi Stadium & arenaHusky StadiumSpace Needle: Another Believer, CC BY-SA 4.0 · Climate Pledge Arena: Sea Cow, CC BY-SA 4.0 · Lumen Field: "Smart Destinations", GoSeattleCard.com, and Go Seattle Card Blog, CC BY-SA 2.0 · T-Mobile Park: MyName (Cacophony), CC BY-SA 3.0 · Seattle Underground: Mark Hursh, CC BY-SA 3.0 · Husky Stadium: Atomic Taco, CC BY-SA 2.0
Who provides power, water and the rest in Snohomish, and how to reach them.
EPA SDWIS (Oct 9, 2026) · HIFLD + EIA-861 2025 · Census 2020 ZCTAs · NCES 2024–25 · registration: vote.gov, updated Sep 30, 2026.
Ordered by what stands out in Snohomish.
Snohomish has fewer 90° days than nearly all U.S. towns and pairs an A− for schools with high home prices, but it has homes that cost more against local pay than most of Washington.
The biggest park or preserve is Riverview Wildlife Refuge, at 78 acres. In 10 parks and preserves, walkers have 5.6 miles of trail. Parks and preserves in Snohomish: 10, covering 156 acres.
| Biggest places to walk | Trails | Acres |
|---|---|---|
| 1. Riverview Wildlife Refuge | 0.9 mi | 78 |
| 2. Pilchuck Park | 0.7 mi | 17 |
| 3. Maple Avenue Campus Recreational Park | 0.5 mi | 21 |
Trails & parks © OpenStreetMap contributors · Conserved land: USGS PAD-US
That grade comes with a D for cost of living: the typical home is worth about $902K.
Two of its 9 schools are shown below, with the reason for each. The largest public high school is Snohomish High School, with 1,496 students. The public schools here belong to the Snohomish School District.
| School | Level | Students | Letter |
|---|---|---|---|
| Central Emerson ElementaryLargest public elementary schoolGrades K–6 | Grades K–6 | 477 | – |
| Snohomish High SchoolLargest public high schoolGrades 9–12 | Grades 9–12 | 1,496 | – |
NCES · EDFacts · graded within WA on state tests and graduation
At 7.8 years of the Seattle metro’s $115K median household income, the typical home (about $902K) costs more against local pay than in 86% of Washington towns; that ratio is one input to its D for cost of living.
The share of households in Snohomish who live in a home they own is 55%, against 71% in Washington’s towns and 73% across U.S. towns. Homes sold in Snohomish spent a median 26 days on the market. The typical rent for Snohomish comes to $1,654 a month.
| Snohomish | Washington towns | U.S. towns | |
|---|---|---|---|
| Households that own their home | 55% | 71% | 73% |
| Median rent | $1,654 a month | $1,740 a month | $1,185 a month |
Census ACS, 2020–24 · Zillow Home Value Index · Redfin Data Center
46 flood insurance claims have been paid in Snohomish since 1978. Expected losses in Snohomish break down as 76% from earthquakes and 20% from inland flooding. Federal disaster aid has reached households in Snohomish after 12 declared disasters, most recently in 2025.
FEMA flood insurance claims · FEMA disaster declarations and aid · FEMA National Risk Index · OpenFEMA
In Snohomish, 18% of adults get no exercise outside work. Snohomish: 28% of adults have been diagnosed with depression.
| Snohomish | Washington towns | U.S. towns | |
|---|---|---|---|
| Depression (CDC PLACES) | 28% | 26% | 23% |
| Yearly checkup (CDC PLACES) | 72% | 71% | 79% |
| Get no exercise (CDC PLACES) | 18% | 18% | 25% |
| Diabetes (CDC PLACES) | 9.4% | 9.8% | 12% |
| What stands out | Snohomish | WA |
|---|---|---|
| More older adults who have lost all their teeth | 12.4% | 9% |
| More adults with COPD | 5.9% | 5.1% |
| More adults with asthma | 12.2% | 10.7% |
CDC PLACES 2025 · modeled estimates for adults · CMS · HRSA
The Monroe weather station, 7 miles away, records that about 2 days a year reach 90°, fewer than in 97% of U.S. towns. July afternoons average 74.7°, cooler than in 98% of U.S. towns; January nights average 35.2°.
About 3 inches of snow falls in a winter. Snohomish’s midsummer high is 75°F.
| Snohomish | Washington towns | U.S. towns | |
|---|---|---|---|
| July high | 75°F | 77°F | 85°F |
| January low | 35°F | 35°F | 22°F |
NOAA U.S. Climate Normals, 1991–2020
Within Washington, it does better than 57% of towns. The level of property crime in Snohomish is 18.8 per 1,000 residents.
| Snohomish | Washington towns | U.S. towns | |
|---|---|---|---|
| Property crimes per 1,000 (2025) | 18.8 per 1,000 residents | 15 | 9.9 |
| Violent crimes per 1,000 (2025) | 1.8 per 1,000 residents | 1.5 | 1.6 |
FBI crime data, 2025 · crimes reported to police
For Snohomish, the average commute is 29 minutes. Most working residents leave Snohomish for work: only 9% work in town. This Washington town had 6,225 jobs in 2023, up 1,315 from 2013. Half of commuters travel less than 14 miles.
| Snohomish | Washington towns | U.S. towns | |
|---|---|---|---|
| Average trip to work | 29 minutes | 27 minutes | 25 minutes |
| Below the poverty line | 6.7% | 7.9% | 9.6% |
| Working residents who work in town | 9.4% | 4.8% | 8% |
| Median household income | $87,000 | $98,000 | $80,000 |
Census LEHD 2023 · ACS
34% of adults 25 and older hold a bachelor’s degree or more in Snohomish. By age, Snohomish looks like Washington: each broad group is within 4 points. This Washington town has grown 5.9% since 2020, to 10,719 residents in the Census Bureau’s 2025 estimate. In Snohomish, the age of the median resident is 42.5 years.
| Snohomish | Washington towns | U.S. towns | |
|---|---|---|---|
| Under 18 | 18% | 22% | 22% |
| Median age | 42.5 years | 38.5 years | 40.5 years |
| Aged 65 or older | 20% | 16% | 18% |
| Bachelor’s degree or more, 25+ | 34% | 30% | 29% |
52% women, 48% men
That’s an even split within the survey’s margin of ±2.9 points. Across Washington, 49.6% of residents are women.
| Snohomish | WA | U.S. | |
|---|---|---|---|
| Under 10 | 11% | 11.5% | 11.6% |
| 10 to 17 | 7.4% | 9.9% | 10.3% |
| 18 to 24 | 8.8% | 8.5% | 9.1% |
| 25 to 34 | 12.7% | 15.2% | 13.7% |
| 35 to 44 | 14.2% | 14.3% | 13.2% |
| 45 to 54 | 12.8% | 12% | 12.2% |
| 55 to 64 | 13% | 12% | 12.7% |
| 65 to 74 | 11.7% | 10.1% | 10.2% |
| 75 and older | 8.3% | 6.5% | 7% |
| No diploma | 8.1% | 7.7% | 10.4% |
| High school | 18.9% | 21.6% | 26% |
| Some college | 27.9% | 21% | 19.1% |
| Associate’s | 10.7% | 10% | 8.8% |
| Bachelor’s | 25.4% | 24% | 21.6% |
| Graduate | 9% | 15.6% | 14.1% |
Census population estimates, 2025 · U.S. Census Bureau · ACS 2020-2024 5-year estimates
4 within 15 miles of the center of Snohomish
About 2 of every 100 Snohomish residents are enrolled in college, against 6 across Washington.
21 notable people were born in Snohomish.
City in Washington, United States
Snohomish () is a city in Snohomish County, Washington, United States. The population was 10,126 at the 2020 census. It is located on the Snohomish River, southeast of Everett and northwest of Monroe. Snohomish lies at the intersection of U.S. Route 2 and State Route 9. The city's airport, Harvey Airfield, is located south of downtown and used primarily for general aviation. The city was founded in 1859 and named Cadyville after pioneer settler Edson T. Cady and renamed to Snohomish in 1871. It served as county seat of Snohomish County from 1861 to 1897, when the county government was relocated to Everett. Snohomish has a downtown district that is renowned for its collection of antique shop…
From Wikipedia, licensed CC BY-SA 4.0 · facts via Wikidata (CC0)
One town shares a border with Snohomish.
| Town | WA rank | Overall | Cost | Safety | Schools | Health |
|---|---|---|---|---|---|---|
| Snohomish | #125 | B− | D | C+ | A− | A− |
| Fobes Hill | #50 | B+ | C− | — | A− | A |
Fobes Hill reports no FBI crime data of its own. Compare Snohomish with a neighbor →
Short answers, built from the data on this page.
Snohomish grades B− overall, better than 51% of U.S. towns and #125 of 285 in Washington. It grades A− for health, C+ for safety and A− for schools. Hazard risk is its weak spot, with a D.
Within Washington, it does better than 57% of towns.
Yes. That is 7.8 years of the area's median household income ($115,177 across the Seattle-Tacoma-Bellevue, WA metro area). Cost of living, which also weighs rents, property taxes and how many households pay 30% or more of their income for housing, grades D.
21 notable people were born here, including Jon Brockman and Earl Averill.