Barberton in pictures
Census counts: 4,617 in 2000, 8,567 in 2020. The archive holds 7 maps from 1897 on.
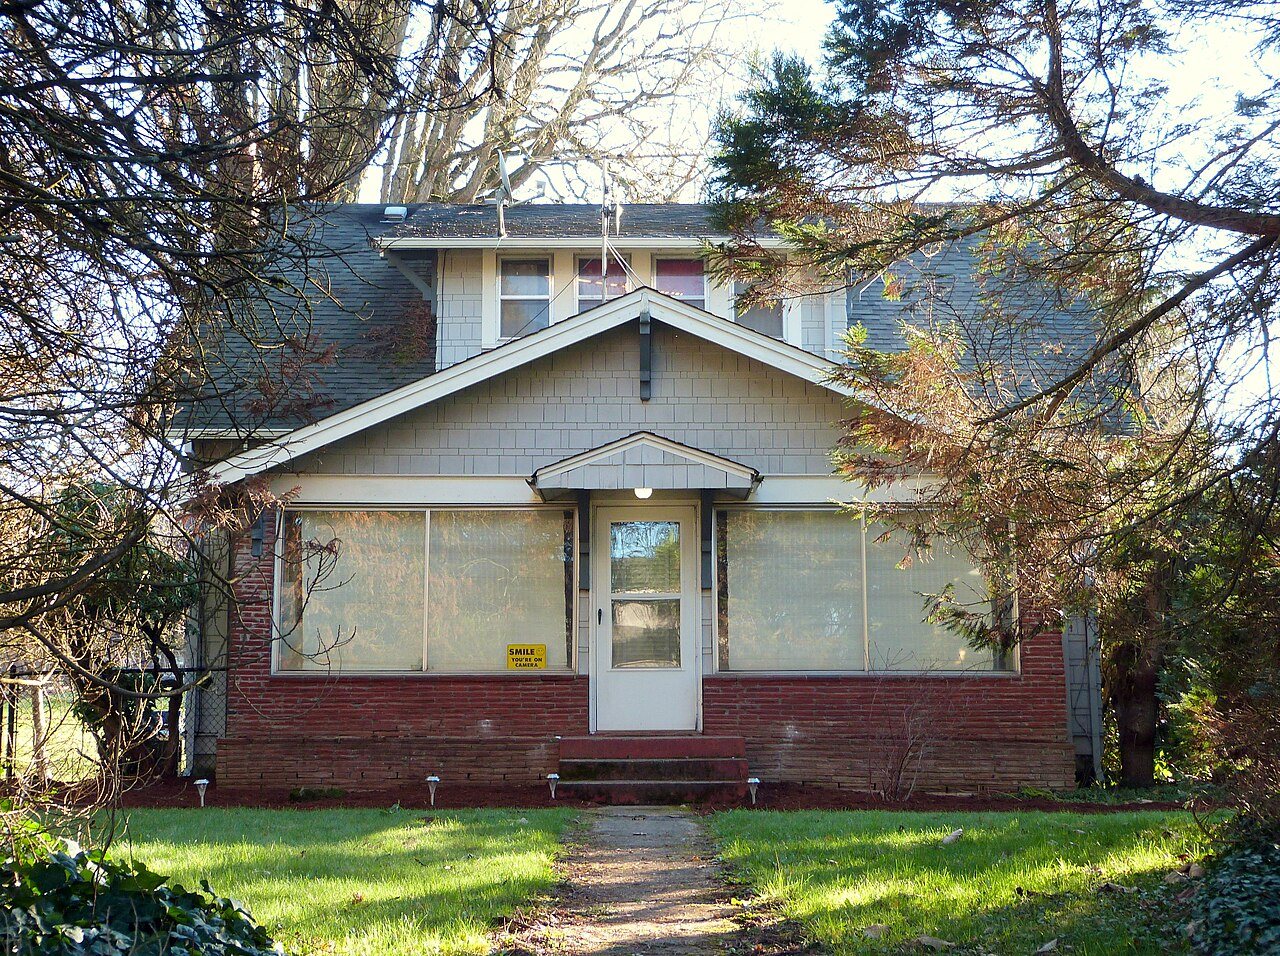
1 place on the National Register of Historic Places.
Explore the history →Each edition grades its towns against each other only.
A town of 8,668.
For most people who can afford it, yes. Barberton grades B overall, 94th among Washington's 285 graded towns. The median household earns $134K. CDC estimates put its residents' health ahead of 84% of the country. The trade-off is money: the typical home is worth about $647K, 6.6 years of the Portland metro’s $97K median household income. Barberton’s median household income is $134,000, against $98,000 in Washington’s towns and $80,000 across U.S. towns. Heye H. and Eva Meyer Farmstead is on the National Register of Historic Places.
5,661 counted in 2010 and 8,567 in 2020.
U.S. Census 2010 & 2020 counts
Each subject compared with towns across the country (schools within Washington), ordered by how far Barberton is from typical.
How TownRatings grades towns →
Census counts: 4,617 in 2000, 8,567 in 2020. The archive holds 7 maps from 1897 on.
1 place on the National Register of Historic Places.
Explore the history →Museums, parks, gardens and other places to visit around Barberton. Close and well known come first.
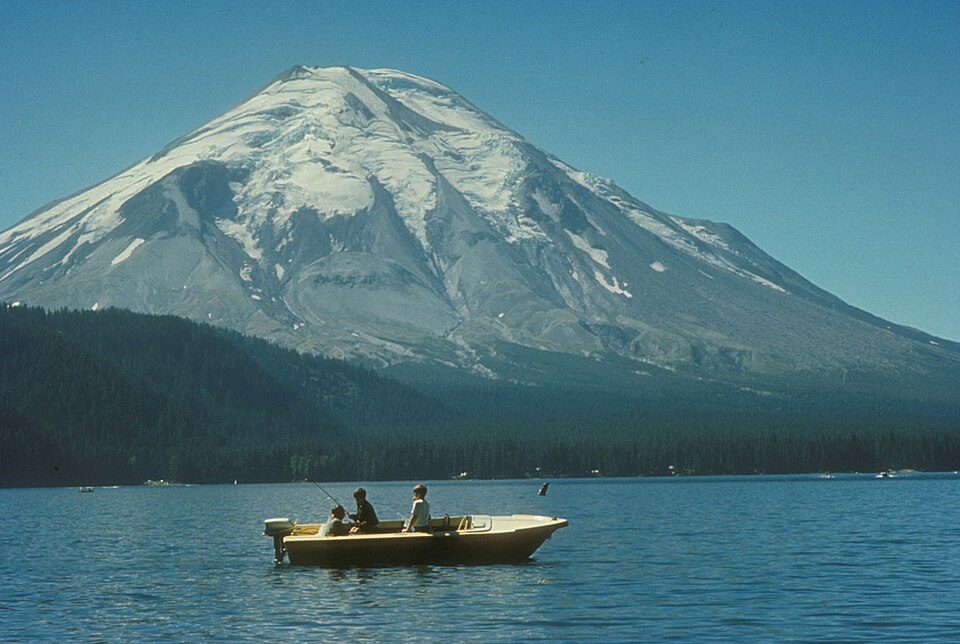
Big draw39 mi MountainMount St. Helens
13 mi Stadium & arenaModa Center
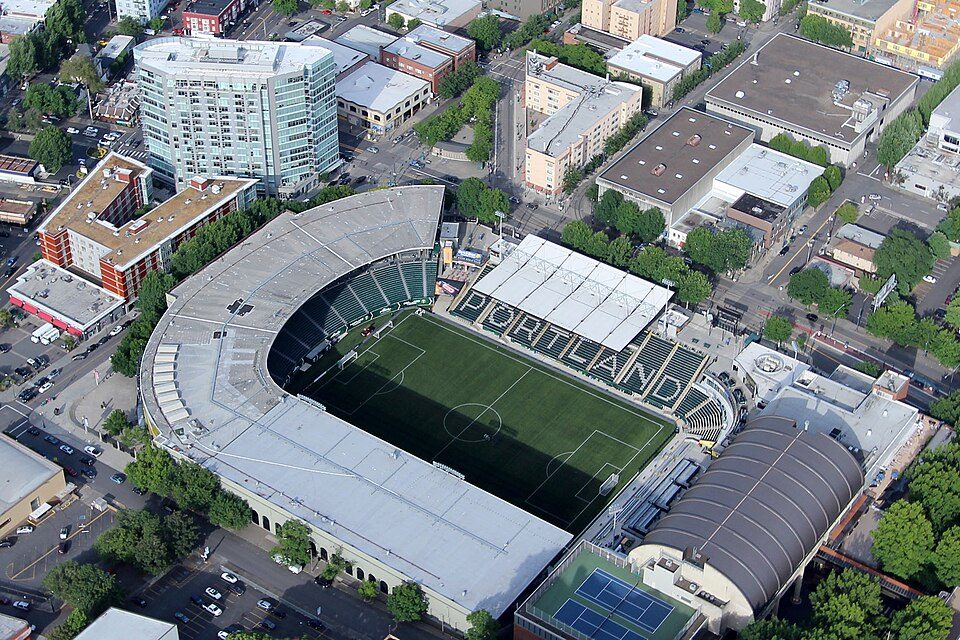
14 mi Stadium & arenaProvidence Park
26 mi WaterfallMultnomah Falls
13 mi GardenForest Park
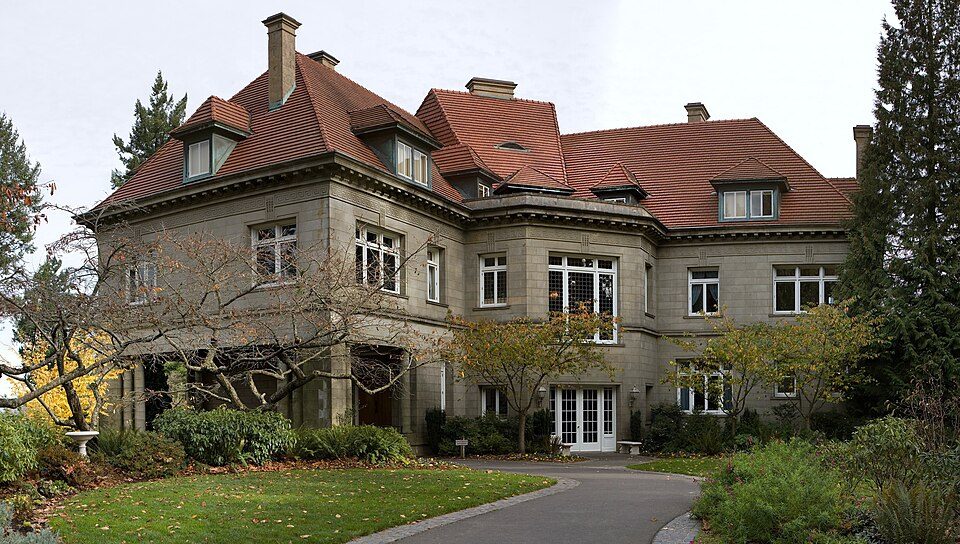
14 mi MuseumPittock MansionMount St. Helens: U.S. Forest Service- Pacific Northwest Region, Public domain · Moda Center: Lugnuts, CC BY-SA 3.0 · Providence Park: Pdx.rollingthunder, CC BY-SA 4.0 · Multnomah Falls: John Fowler from Placitas, NM, USA, CC BY 2.0 · Forest Park: EncMstr, CC BY-SA 3.0 · Pittock Mansion: PittockBack.jpg: Cacophony derivative work: Tiptoety talk, CC BY-SA 3.0
Barberton is unincorporated, so Clark County and regional agencies provide most services.
EPA SDWIS (Oct 9, 2026) · HIFLD + EIA-861 2025 · Census 2020 ZCTAs · NCES 2024–25 · registration: vote.gov, updated Sep 30, 2026.
Ordered by what stands out in Barberton.
Barberton sends many workers across the state line to Portland and owes part of its health edge to its incomes.
4.5 miles of trail in 4 parks and preserves. Barberton’s trail density is 1.1 miles per square mile. The biggest park or preserve is Gaddis Wetland Natural Area, at 47 acres.
| Barberton | Washington towns | U.S. towns | |
|---|---|---|---|
| Miles of trail per square mile | 1.1 miles per square mile | 0.8 | 0.4 |
| Conserved land | 2.6% | 4% | 4.3% |
| Biggest places to walk | Trails | Acres |
|---|---|---|
| 1. Curtin Creek Park | 1 mi | 17 |
| 2. Gaddis Wetland Natural Area | 0.9 mi | 47 |
| 3. Pleasant Valley Park | 0.7 mi | 31 |
Trails & parks © OpenStreetMap contributors · Conserved land: USGS PAD-US
Its public schools are run by the Battle Ground School District. One of its 2 schools is below, with why it’s listed.
| School | Level | Students | Letter |
|---|---|---|---|
| Pleasant Valley PrimaryLargest public elementary schoolGrades PK–4 | Grades PK–4 | 591 | – |
NCES · EDFacts · graded within WA on state tests and graduation
Against the 4,157 U.S. towns with household incomes like Barberton’s, it is healthier than 50%, a smaller edge than it has nationally: part of it comes with its incomes.
30% of Barberton adults sleep under 7 hours. Barberton beats the Washington average on 10 of 31 CDC measures and trails it on 2. 71% of Barberton adults had a checkup this year.
| Barberton | Washington towns | U.S. towns | |
|---|---|---|---|
| Sleep under 7 hours (CDC PLACES) | 30% | 33% | 36% |
| Yearly checkup (CDC PLACES) | 71% | 71% | 79% |
| Smoke cigarettes (CDC PLACES) | 9.5% | 11% | 14% |
| Food insecurity (CDC PLACES) | 6.9% | 10% | 14% |
| What stands out | Barberton | WA |
|---|---|---|
| Fewer adults facing food insecurity | 6.9% | 10.2% |
| Fewer older adults who have lost all their teeth | 6.2% | 9% |
| More adults who have had cancer | 9.5% | 7.9% |
CDC PLACES 2025 · modeled estimates for adults · CMS · HRSA
23% of working residents cross a state line to work, Portland among the top destinations. Barberton has 853 jobs for its 3,748 working residents: even if every job went to a resident, most would still commute out.
Most working residents leave Barberton for work: only 2% work in town. Jobs based in Barberton grew to 853 in 2023, 355 more than in 2013. 3.7% of residents live below the poverty line in Barberton.
| Barberton | Washington towns | U.S. towns | |
|---|---|---|---|
| Below the poverty line | 3.7% | 7.9% | 9.6% |
| Working residents who work in town | 2.1% | 5% | 8% |
| Average trip to work | 25 minutes | 27 minutes | 25 minutes |
Census LEHD 2023 · ACS
Barberton has mild winters and pleasant summers, with plenty of rain. The July high in Barberton is 81°F.
NOAA U.S. Climate Normals, 1991–2020
Children under 18 are 17% of residents (21% statewide); adults 35 to 64 are 42% of residents (38% statewide). 37% of adults 25 and older have a bachelor’s degree or more, vs 40% across Washington.
| Barberton | Washington towns | U.S. towns | |
|---|---|---|---|
| Under 18 | 17% | 22% | 22% |
| Median age | 44.9 years | 38.5 years | 40.5 years |
| Bachelor’s degree or more, 25+ | 37% | 30% | 29% |
| Aged 65 or older | 19% | 16% | 18% |
49% women, 51% men
That’s an even split within the survey’s margin of ±6.5 points. Across Washington, 49.6% of residents are women.
| Barberton | WA | U.S. | |
|---|---|---|---|
| Under 10 | 8.6% | 11.5% | 11.6% |
| 10 to 17 | 8.8% | 9.9% | 10.3% |
| 18 to 24 | 9.5% | 8.5% | 9.1% |
| 25 to 34 | 11.6% | 15.2% | 13.7% |
| 35 to 44 | 11.7% | 14.3% | 13.2% |
| 45 to 54 | 18.1% | 12% | 12.2% |
| 55 to 64 | 12.5% | 12% | 12.7% |
| 65 to 74 | 12.8% | 10.1% | 10.2% |
| 75 and older | 6.4% | 6.5% | 7% |
| No diploma | 5% | 7.7% | 10.4% |
| High school | 22.7% | 21.6% | 26% |
| Some college | 21.8% | 21% | 19.1% |
| Associate’s | 13.1% | 10% | 8.8% |
| Bachelor’s | 24.1% | 24% | 21.6% |
| Graduate | 13.2% | 15.6% | 14.1% |
U.S. Census Bureau · ACS 2020-2024 5-year estimates
Expected storm and flood damage is lower than in 58% of U.S. communities.
FEMA National Risk Index · OpenFEMA
The median sale price was $747,000 in May 2026.
Zillow Home Value Index · Redfin Data Center
11 within 15 miles of the center of Barberton
About 5 of every 100 Barberton residents are enrolled in college, about the same as Washington.
Where Barberton’s working residents go each day. Line width shows the share.
Census LEHD 2023
Census-designated place in Washington, United States
Barberton is a census-designated place (CDP) in Clark County, Washington, United States. The population was 8,567 at the 2020 census. Based on per capita income, one of the more reliable measures of affluence, Barberton ranks 90th of 522 areas in the state of Washington to be ranked.
From Wikipedia, licensed CC BY-SA 4.0 · facts via Wikidata (CC0)
4 towns share a border with Barberton.
It grades higher overall than all 4 graded towns on its borders; Brush Prairie (B) comes closest.
| Town | WA rank | Overall | Cost | Safety | Schools | Health |
|---|---|---|---|---|---|---|
| Barberton | #94 | B | C− | — | B− | A− |
| Mount Vista | #120 | B− | D | — | C+ | A− |
| Brush Prairie | #106 | B | C− | — | B− | B+ |
| Five Corners | #143 | B− | C− | — | C+ | B |
| Salmon Creek | #110 | B− | D | — | C+ | A− |
Barberton, Mount Vista, Brush Prairie, Five Corners and Salmon Creek report no FBI crime data of their own. Compare Barberton with a neighbor →
Short answers, built from the data on this page.
For most people who can afford it, yes. Barberton grades B overall, better than 59% of U.S. towns and #94 of 285 in Washington. It grades A− for health and B− for schools. Cost of living is its weak spot, with a C−.
Yes. The typical home is worth about $647,000, 10% above the Washington typical home. Cost of living, which also weighs rents, property taxes and how many households pay 30% or more of their income for housing, grades C−.