 #1
Clarkston
Asotin County · 7,189 peopleJuly high·January low 30°·44 days of 90°+ a year
Each edition grades its towns against each other only.
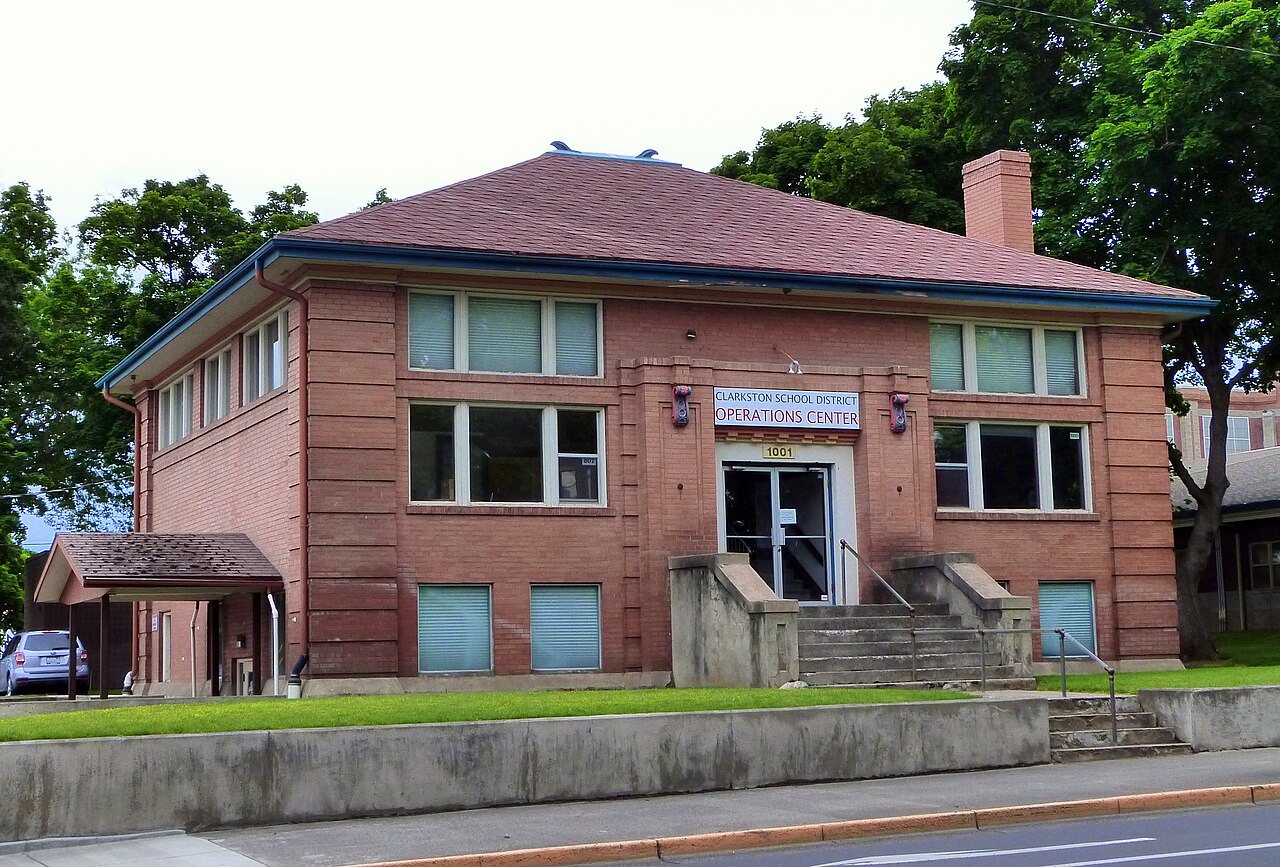
Clarkston, #1 on this list · Clarkston Public Library · Photo: Ian Poellet · CC BY-SA 4.0Clarkston has the hottest summers of Washington’s 265 towns of 2,500+: July afternoons average a high of 93° (NOAA 1991–2020 normals). The typical town here averages 77°; 19 of the 265 average 90° or more.
The average July high. NOAA U.S. Climate Normals, 1991–2020, from NOAA’s 5 km grid at each town’s center; one town for each grid cell. A described list: no letters. How grades work
#1July high·January low 30°·44 days of 90°+ a year
 #2
July high·January low 29°·44 days of 90°+ a year
 #3
July high·January low 27°·50 days of 90°+ a year
July high, highest first. Towns with the same figure share a rank (T = tied; 209 towns here).
265 towns ranked. Not here? See why a town may be missing.
Clarkston (Asotin County): July afternoons average a high of 93°. Clarkston Heights-Vineland (92°) and Desert Aire (91°) follow.
By the average July high (the warmest month’s afternoons), highest first, on NOAA’s 1991–2020 normals, read from its 5 km grid at each town’s center. Towns with the same figure share a rank (T); the figure and the state rank are the ones on each town’s Climate page. How grades work.
The list covers towns of 2,500+ residents, one for each of NOAA’s 5 km grid cells (265 in Washington): where towns share a cell, one of them stands for it, since the grid gives them the same figures. Every town’s own figures are on its Climate page. Every town is on the Washington page.
Every list ranks the same 2,500+ towns, so a town’s rank means the same thing on each.