
Leland, NC, USA, 2016
Leland’s story
128 years in pictures
Census counts: 1,801 in 1990, 22,908 in 2020. The archive holds 4 old photos and papers going back to 2004 and 2 maps from 1980 on.
- 1898Leland is settled
Each edition grades its towns against each other only.

FEMA rates its natural-hazard risk higher than 94% of U.S. communities, with hurricanes at the top. Overall it grades B−, 104th of 286 graded towns in North Carolina. CDC estimates put its residents' health ahead of 79% of the country. Its weakest subject is cost of living: homes are expensive, about $383K for a typical one and 5 times the Wilmington metro’s $76K median household income. Only 17 of North Carolina’s 190 towns score higher on safety. Leland has 1 place on the National Register. Most errands need a car: it is less walkable than 69% of U.S. towns.
Where Leland beats most towns, and one thing worth knowing.
13,527 counted in 2010 and 22,908 in 2020; an estimated 35,731 in 2025.
Growth hasn’t slowed: 52.9% since 2020, after 69.4% in the decade before.
U.S. Census 2010 & 2020 counts · Census Bureau estimate, July 1, 2025
Each subject compared with towns across the country (schools within North Carolina), ordered by how far Leland is from typical.
How TownRatings grades towns →
Census counts: 1,801 in 1990, 22,908 in 2020. The archive holds 4 old photos and papers going back to 2004 and 2 maps from 1980 on.
Museums, parks, gardens and other places to visit around Leland. Close and well known come first.
 16 mi LandmarkFort Fisher
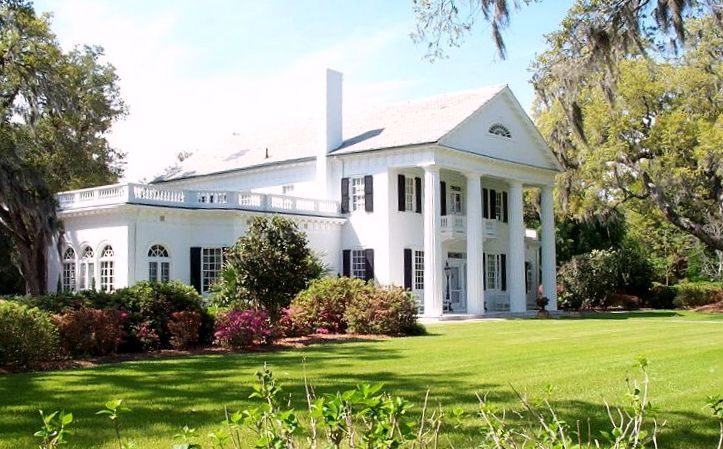 9 mi GardenOrton Plantation
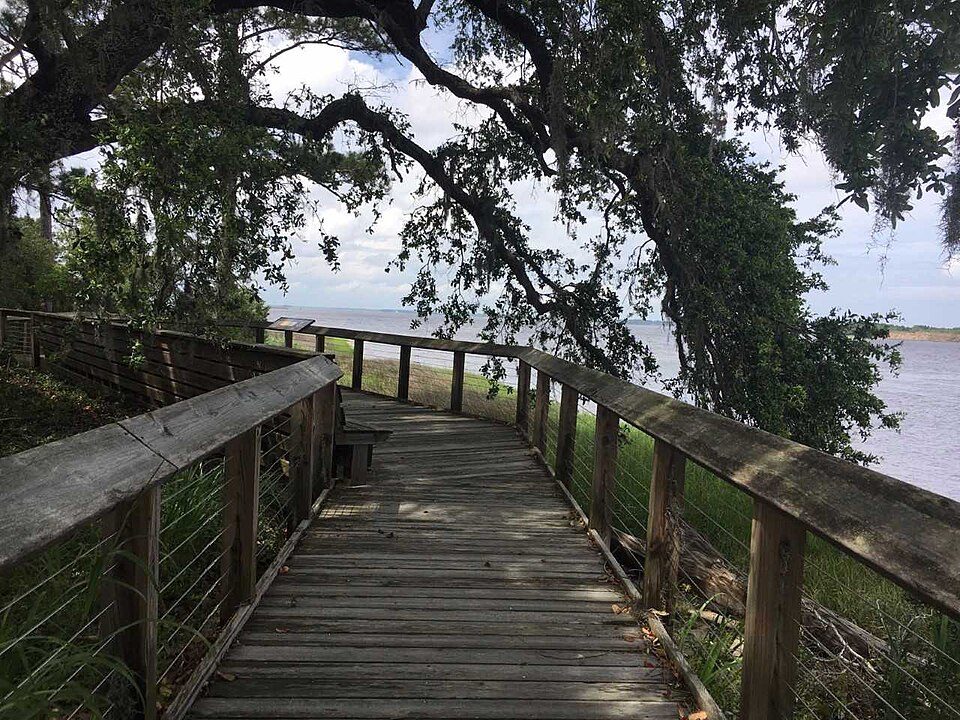 11 mi MuseumBrunswick Town
 20 mi National BattlefieldMoores Creek National Battlefield56K visitors a year12 mi GardenAirlie Gardens
 6 mi TheatreThalian Hall
Fort Fisher: Eric T. Gunther, CC BY 3.0 · Orton Plantation: AgnosticPreachersKid., CC BY-SA 3.0 · Brunswick Town: Brunswick1726, CC BY-SA 4.0 · Moores Creek National Battlefield: Unknown authorUnknown author, Public domain · Thalian Hall: Sanfranman59, CC BY-SA 3.0
Who provides power, water and the rest in Leland, and how to reach them.
EPA SDWIS (Oct 9, 2026) · HIFLD + EIA-861 2025 · Census 2020 ZCTAs · NCES 2024–25 · registration: vote.gov, updated Nov 18, 2024.
Ordered by what stands out in Leland.
Leland fares better on crime within North Carolina than nationally and has added half again as many jobs in ten years, but it carries more natural-hazard risk than most of North Carolina (mostly hurricanes).
FEMA rates its natural-hazard risk higher than 85% of North Carolina towns, with expected losses of about $637 per resident a year; that rating is what its D− for hazard risk is built on. 58 flood insurance claims have been filed here, and 11 properties have flooded more than once.
Since 1999, 58 flood insurance claims have been paid out in Leland.
FEMA flood insurance claims · FEMA National Risk Index · OpenFEMA
Its public schools are run by the Brunswick County Schools. Its two schools are below. The largest public high school is North Brunswick High, with 1,620 students.
| School | Level | Students | Letter |
|---|---|---|---|
| Leland MiddleLargest public middle schoolGrades 6–8 | Grades 6–8 | 806 | C |
| North Brunswick HighLargest public high schoolGrades 9–12 | Grades 9–12 | 1,620 | B+ |
NCES · EDFacts · graded within NC on state tests and graduation
29% of adults feel lonely in Leland, below both North Carolina’s towns (33%) and U.S. towns (33%). 14% of Leland adults report frequent mental distress. Leland beats the North Carolina average on 14 of 32 CDC measures and trails it on 4.
| Leland | North Carolina towns | U.S. towns | |
|---|---|---|---|
| Feel lonely (CDC PLACES) | 29% | 33% | 33% |
| Frequent mental distress (CDC PLACES) | 14% | 17% | 17% |
| Yearly checkup (CDC PLACES) | 83% | 80% | 79% |
| Binge drink (CDC PLACES) | 14% | 15% | 16% |
| What stands out | Leland | NC |
|---|---|---|
| Fewer adults facing food insecurity | 10% | 15.2% |
| Fewer older adults who have lost all their teeth | 9.2% | 13.9% |
| More adults who have had cancer | 11.5% | 7.9% |
CDC PLACES 2025 · modeled estimates for adults · CMS · HRSA
| Leland | North Carolina towns | U.S. towns | |
|---|---|---|---|
| Conserved land | 6.1% | 3.4% | 4.3% |
| Miles of trail per square mile | 0.4 miles per square mile | 0.2 | 0.4 |
| Biggest places to walk | Trails | Acres |
|---|---|---|
| 1. Annsdale Park | 0.9 mi | 13 |
| 2. Leland Community Park | — | 10 |
| 3. Founders Park | — | 8 |
Trails & parks © OpenStreetMap contributors · Conserved land: USGS PAD-US
Jobs based here grew from 2,648 in 2013 to 4,864.
Most working residents leave Leland for work: only 7% work in town. 6.1% of residents live below the poverty line in Leland, below both the North Carolina town median (13%) and the median of U.S. towns (9.6%). Since 2013, Leland has added 2,216 jobs, to 4,864 in 2023.
| Leland | North Carolina towns | U.S. towns | |
|---|---|---|---|
| Work from home | 18% | 12% | 11% |
| Below the poverty line | 6.1% | 13% | 9.6% |
| Median household income | $92,000 | $69,000 | $80,000 |
Census LEHD 2023 · ACS
People 65 and older are 28% of residents (17% statewide); children under 18 are 16% of residents (22% statewide). 44% of adults 25 and older hold a bachelor’s degree or more in Leland. Leland has grown 53% since 2020, to 35,731 residents in the Census Bureau’s 2025 estimate.
| Leland | North Carolina towns | U.S. towns | |
|---|---|---|---|
| Aged 65 or older | 28% | 18% | 18% |
| Under 18 | 16% | 22% | 22% |
| Median age | 47.3 years | 40.1 years | 40.5 years |
| Bachelor’s degree or more, 25+ | 44% | 29% | 29% |
52% women, 48% men
That’s an even split within the survey’s margin of ±1.8 points. Across North Carolina, 51.1% of residents are women.
| Leland | NC | U.S. | |
|---|---|---|---|
| Under 10 | 8.9% | 11.6% | 11.6% |
| 10 to 17 | 7.4% | 10.2% | 10.3% |
| 18 to 24 | 5.7% | 9.5% | 9.1% |
| 25 to 34 | 13.9% | 13.4% | 13.7% |
| 35 to 44 | 12.6% | 12.8% | 13.2% |
| 45 to 54 | 7.3% | 12.6% | 12.2% |
| 55 to 64 | 15.8% | 12.8% | 12.7% |
| 65 to 74 | 19.6% | 10.3% | 10.2% |
| 75 and older | 8.8% | 6.9% | 7% |
| No diploma | 2.7% | 9.9% | 10.4% |
| High school | 21.5% | 24.8% | 26% |
| Some college | 20.6% | 19.6% | 19.1% |
| Associate’s | 11.5% | 10.1% | 8.8% |
| Bachelor’s | 29.5% | 22.2% | 21.6% |
| Graduate | 14.3% | 13.5% | 14.1% |
Census population estimates, 2025 · U.S. Census Bureau · ACS 2020-2024 5-year estimates
At 11.7 crimes per 1,000 residents a year, it reports less crime than 94% of North Carolina’s graded towns. Reported crimes rose from 190 to 312 over the last three FBI years, a rise beyond ordinary year-to-year swings.
Leland’s property crime rate is 7.1 per 1,000 residents.
| Leland | North Carolina towns | U.S. towns | |
|---|---|---|---|
| Property crimes per 1,000 (2025) | 7.1 per 1,000 residents | 21.8 | 9.9 |
| Violent crimes per 1,000 (2025) | 1.3 per 1,000 residents | 3.2 | 1.6 |
FBI crime data, 2025 · crimes reported to police
Leland has mild winters and warm summers, with plenty of rain. The July high in Leland is 90°F.
NOAA U.S. Climate Normals, 1991–2020
The typical Leland home is worth about $383,000, about the same as a year ago, 15% above the North Carolina typical home.
| Leland | North Carolina towns | U.S. towns | |
|---|---|---|---|
| Median rent | $1,735 a month | $1,084 a month | $1,185 a month |
| Households that own their home | 81% | 67% | 73% |
Zillow Home Value Index · Redfin Data Center
3 within 15 miles of the center of Leland
About 5 of every 100 Leland residents are enrolled in college, about the same as North Carolina.
Where Leland’s working residents go each day. Line width shows the share.
Census LEHD 2023
Town in North Carolina, United States
Leland is the most populous town in Brunswick County, North Carolina, United States. The population was 23,504 at the 2020 census, up from 13,527 in 2010. As of 2020, it is considered to be one of the fastest growing towns in North Carolina. It is part of the Wilmington, NC Metropolitan Statistical Area. and the Cape Fear Council of Governments. The town of Leland is in the northeastern part of Brunswick County, with the town of Navassa to the north, Belville to east, and Boiling Spring Lakes to the south. It is part of the Town Creek township, and Cape Fear region of North Carolina, a short distance north of the South Carolina state line. Leland is located five miles (8.0 km) west of Wilmi…
From Wikipedia, licensed CC BY-SA 4.0 · facts via Wikidata (CC0)
2 towns share a border with Leland.
Navassa has fewer than 2,500 residents, so it gets subject grades but no overall grade. Navassa and Belville report no FBI crime data of their own. Compare Leland with a neighbor →
Short answers, built from the data on this page.
Leland grades B− overall, better than 47% of U.S. towns and #104 of 286 in North Carolina. It grades A− for health, B+ for safety and B− for schools. Hazard risk is its weak spot, with a D−.
Yes. Cost of living, which also weighs rents, property taxes and how many households pay 30% or more of their income for housing, grades C−.


