Home › Minnesota › Rankings › Best small towns Chatfield, #1 on this list · George H. Haven House · Photo: Jonathunder · CC BY-SA 3.0 Minnesota rankings · 2026 Best small towns in Minnesota Chatfield ranks first of Minnesota’s 167 graded small towns (2,500–9,999 residents), with an A+: safety (A+) and schools (A) are its strongest grades; hazard risk (B−) is its lowest. 96 of the 167 (57%) grade A− or better nationally, against 25% of U.S. towns.
The overall grade, sorted: cost of living, safety, schools, health, jobs & income, walkability and hazard risk, from Census, FBI, state, CDC, EPA and FEMA data. How grades work
All towns Small towns (2,500–9,999) #1 Fillmore County · 3,018 people A+ Strongest: safety A+ , schools A · lowest: hazard risk B−
A CostA+ SafetyA SchoolsB+ HealthA− JobsA− WalkB− Hazards
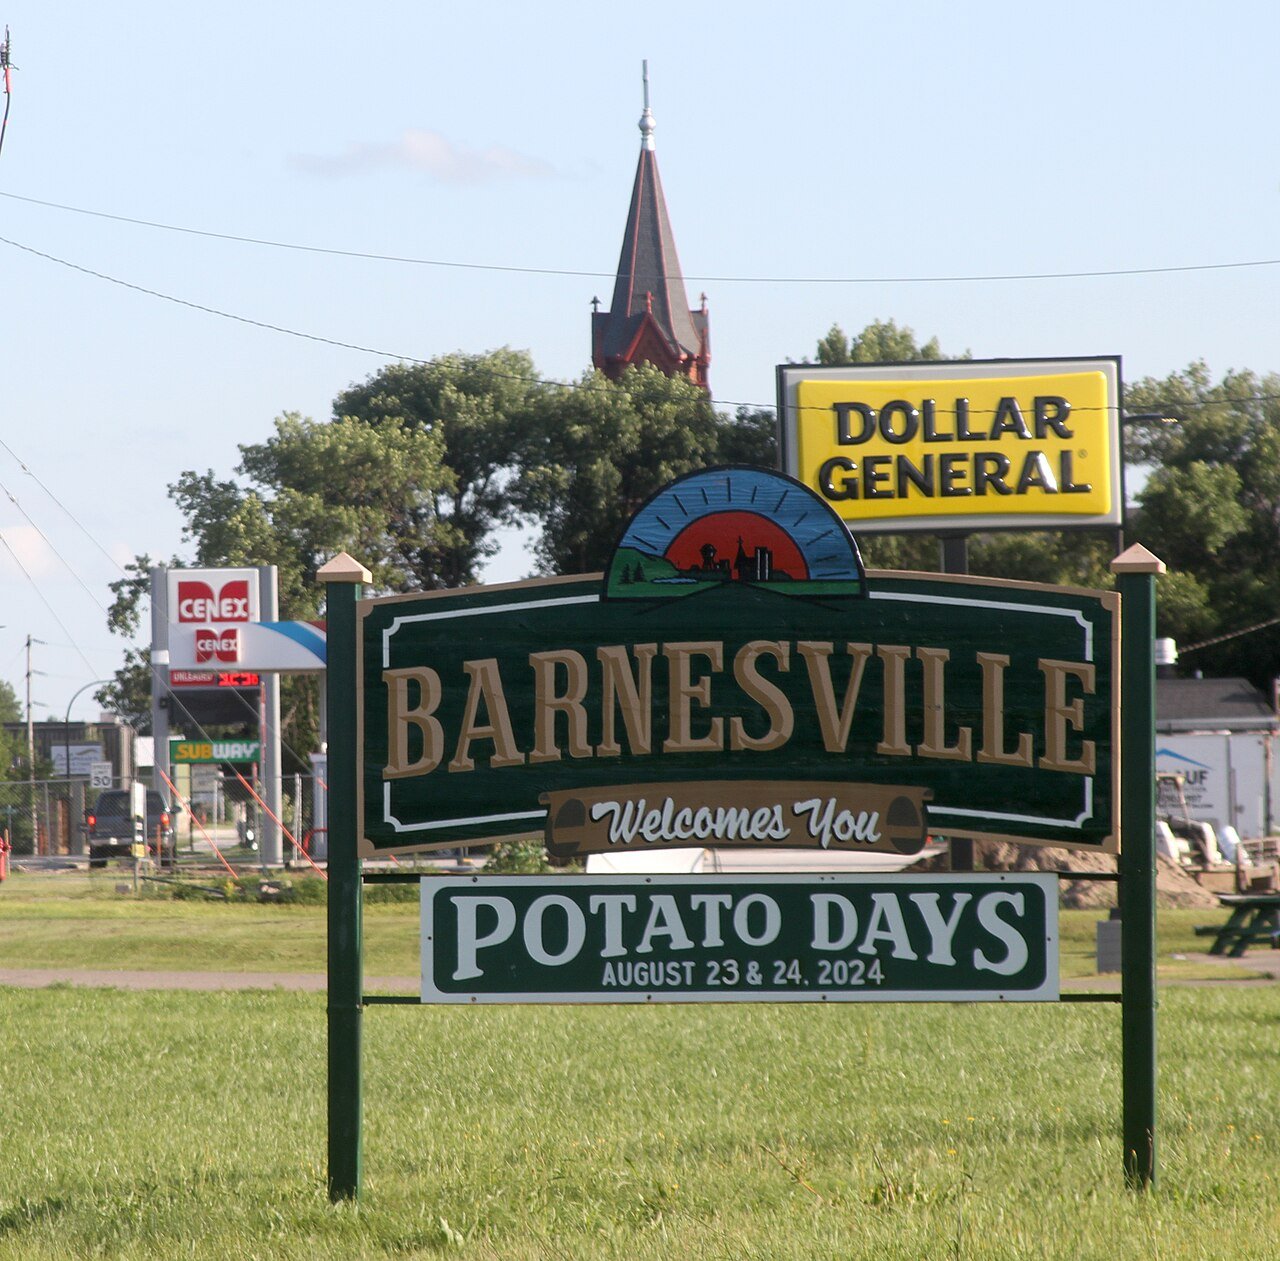
#2 Clay County · 2,767 people A+ Strongest: schools A , safety A · lowest: hazard risk D
A− CostA SafetyA SchoolsA HealthA JobsB+ WalkD Hazards
44.93° N · 93.53° W #3 Hennepin County · 3,794 people A+ Strongest: health A+ , jobs & income A+ · lowest: cost of living C
C CostA+ SafetyA+ SchoolsA+ HealthA+ JobsA− WalkB+ Hazards
Where they are: One of the top 10 is in Fillmore County.
All 167 small towns Overall score, highest first. The score (0–100) blends the seven livability grades and sets the order; the letter places that score among every U.S. town of 2,500+, and A+ is the top 5%, so neighbors on the list often share a letter. Each town links to its page, where the grade sheet shows every subject. The rank is the town’s place among all 271 Minnesota towns.
# Town Score Grade What drives it
1 Chatfield Fillmore County · 3,018 people 85.6 top 0.1% A+ Strongest: safety A+ , schools A · lowest: hazard risk B− 2 Barnesville Clay County · 2,767 people 83.0 top 0.1% A+ Strongest: schools A , safety A · lowest: hazard risk D 3 Deephaven Hennepin County · 3,794 people 81.3 top 0.1% A+ Strongest: health A+ , jobs & income A+ · lowest: cost of living C 4 Caledonia Houston County · 2,768 people 80.0 top 0.2% A+ Strongest: safety A+ , schools A · lowest: jobs & income B 5 Plainview Wabasha County · 3,482 people 78.2 top 0.4% A+ Strongest: walkability A+ , safety A · lowest: jobs & income B− 6 Albertville Wright County · 8,544 people 77.6 top 0.5% A+ Strongest: jobs & income A+ , health A · lowest: walkability C 7 New Prague Scott County · 8,238 people 77.3 top 0.5% A+ Strongest: schools A , health A · lowest: hazard risk C+ 8 Dodge Center Dodge County · 2,951 people 76.8 top 0.7% A+ Strongest: cost of living A , jobs & income A− · lowest: hazard risk B 9 Byron Olmsted County · 6,740 people 76.7 top 0.8% A+ Strongest: schools A+ , health A · lowest: cost of living B− 10 Centerville Anoka County · 3,978 people 76.6 top 0.8% A+ Strongest: jobs & income A+ , health A · lowest: hazard risk C− 11 Medina Hennepin County · 7,460 people 76.4 top 0.8% A+ Strongest: health A+ , schools A+ · lowest: cost of living C 12 Zumbrota Goodhue County · 4,072 people 76.0 top 1.0% A+ Strongest: safety A , schools A · lowest: hazard risk C 14 Albany Stearns County · 2,873 people 74.6 top 1.7% A+ Strongest: safety A , schools A · lowest: jobs & income B− 15 Montgomery Le Sueur County · 3,539 people 74.5 top 1.7% A+ Strongest: safety A+ , walkability A− · lowest: schools B− 16 Delano Wright County · 7,788 people 74.2 top 1.9% A+ Strongest: schools A+ , jobs & income A+ · lowest: hazard risk C 17 Annandale Wright County · 3,801 people 74.2 top 2.0% A+ Strongest: cost of living A , schools A · lowest: hazard risk C 18 Mound Hennepin County · 9,064 people 74.1 top 2.0% A+ Strongest: schools A+ , health A · lowest: cost of living B− 19 Lonsdale Rice County · 5,117 people 74.0 top 2.1% A+ Strongest: jobs & income A , safety A · lowest: cost of living B− 21 Watertown Carver County · 4,789 people 73.9 top 2.2% A+ Strongest: jobs & income A , cost of living A− · lowest: hazard risk D 22 Kasson Dodge County · 7,350 people 73.9 top 2.2% A+ Strongest: schools A , health A · lowest: hazard risk C+ 24 Circle Pines Anoka County · 4,967 people 73.7 top 2.4% A+ Strongest: jobs & income A , schools A · lowest: hazard risk C− 25 Bayport Washington County · 3,721 people 73.4 top 2.7% A+ Strongest: jobs & income A+ , safety A · lowest: cost of living C+ 27 Paynesville Stearns County · 2,591 people 72.8 top 3.2% A+ Strongest: cost of living A , safety A · lowest: hazard risk C 28 Arden Hills Ramsey County · 9,583 people 72.7 top 3.3% A+ Strongest: health A+ , jobs & income A · lowest: cost of living C 29 St. Charles Winona County · 4,090 people 72.3 top 3.7% A+ Strongest: jobs & income A , schools A− · lowest: hazard risk C 32 Luverne Rock County · 4,984 people 72.1 top 4.0% A+ Strongest: cost of living A , schools A · lowest: hazard risk B− 34 New London Township Kandiyohi County · 2,965 people 71.7 top 4.3% A+ Strongest: schools A , health A− · lowest: walkability C− 35 Minnetrista Hennepin County · 9,458 people 71.4 top 4.7% A+ Strongest: health A+ , schools A · lowest: cost of living D 36 Le Center Le Sueur County · 2,524 people 71.3 top 4.9% A+ Strongest: safety A+ , cost of living A · lowest: schools B− 38 Morris Stevens County · 5,150 people 71.2 top 5.0% A+ Strongest: schools A , walkability A · lowest: jobs & income C+ 39 Becker Sherburne County · 5,425 people 71.0 top 5.2% A Strongest: schools A− , safety A− · lowest: walkability C− 40 Carver Carver County · 7,198 people 71.0 top 5.2% A Strongest: jobs & income A , health A · lowest: walkability C 41 Wyoming Chisago County · 8,121 people 71.0 top 5.3% A Strongest: jobs & income A , health A · lowest: walkability C+ 44 Corcoran Hennepin County · 9,269 people 70.5 top 6.1% A Strongest: jobs & income A+ , health A+ · lowest: walkability C− 45 Lake City Wabasha County · 5,306 people 70.4 top 6.1% A Strongest: walkability A− , cost of living A− · lowest: hazard risk C+ 46 Rockford Wright County · 4,827 people 70.4 top 6.2% A Strongest: jobs & income A , health A · lowest: hazard risk C− 47 Shorewood Hennepin County · 7,620 people 70.4 top 6.2% A Strongest: health A+ , schools A+ · lowest: cost of living D 49 Cokato Wright County · 2,793 people 70.3 top 6.3% A Strongest: schools A , cost of living A− · lowest: jobs & income C+ 51 Mahtomedi Washington County · 8,189 people 70.0 top 6.8% A Strongest: schools A+ , jobs & income A · lowest: cost of living C− 52 Monticello Township Wright County · 3,374 people 69.9 top 6.9% A Strongest: jobs & income A+ , schools A · lowest: walkability D 53 Lindstrom Chisago County · 5,039 people 69.8 top 7.0% A Strongest: jobs & income A− , schools A− · lowest: walkability C+ 55 Nowthen Anoka County · 4,630 people 69.6 top 7.3% A Strongest: jobs & income A , schools A− · lowest: cost of living C+ 56 Orono Hennepin County · 8,301 people 69.5 top 7.6% A Strongest: health A+ , schools A+ · lowest: cost of living D 57 Stewartville Olmsted County · 6,850 people 69.5 top 7.6% A Strongest: walkability A− , cost of living B+ · lowest: hazard risk B 58 Goodview Winona County · 4,122 people 69.5 top 7.6% A Strongest: safety A+ , health A− · lowest: hazard risk C 59 Wayzata Hennepin County · 4,344 people 69.4 top 7.7% A Strongest: health A+ , schools A+ · lowest: cost of living D− 60 West Lakeland Township Washington County · 3,931 people 69.3 top 7.9% A Strongest: jobs & income A+ , health A · lowest: cost of living C 61 Independence Hennepin County · 3,763 people 69.1 top 8.2% A Strongest: jobs & income A+ , schools A+ · lowest: cost of living C− 62 Falcon Heights Ramsey County · 5,071 people 69.0 top 8.3% A Strongest: walkability A+ , health A+ · lowest: cost of living C+ 65 Livonia Township Sherburne County · 6,436 people 68.9 top 8.7% A Strongest: jobs & income A+ , schools A · lowest: cost of living C+ 66 Jordan Scott County · 6,988 people 68.8 top 8.7% A Strongest: jobs & income A , schools A− · lowest: hazard risk D 70 Isanti Isanti County · 7,714 people 68.6 top 9.1% A Strongest: jobs & income A , safety A− · lowest: schools B− 71 La Crescent Houston County · 5,261 people 68.6 top 9.1% A Strongest: safety A , jobs & income A · lowest: hazard risk D 76 Jackson Jackson County · 3,305 people 67.5 top 11.1% A Strongest: cost of living A+ , walkability B+ · lowest: jobs & income C+ 77 St. Paul Park Washington County · 5,396 people 67.5 top 11.3% A Strongest: jobs & income A+ , schools A− · lowest: walkability C+ 81 Thomson Township Carlton County · 5,624 people 67.2 top 12.1% A Strongest: schools A+ , jobs & income A · lowest: hazard risk C− 85 Silver Creek Township Wright County · 2,620 people 66.6 top 13.2% A Strongest: jobs & income A , schools A · lowest: walkability C 86 Grant Washington County · 3,954 people 66.6 top 13.2% A Strongest: jobs & income A+ , schools A · lowest: cost of living D 87 Alexandria Township Douglas County · 3,114 people 66.5 top 13.3% A Strongest: schools A− , hazard risk A− · lowest: walkability C 90 Le Sueur Le Sueur County · 4,210 people 66.4 top 13.5% A Strongest: safety A , schools B+ · lowest: hazard risk C+ 93 Elko New Market Scott County · 5,300 people 66.1 top 14.2% A Strongest: jobs & income A+ , schools A · lowest: walkability C− 97 Mayer Carver County · 2,563 people 65.7 top 15.1% A− Strongest: jobs & income A , health A− · lowest: walkability C− 99 Mountain Iron St. Louis County · 2,835 people 65.7 top 15.3% A− Strongest: hazard risk A , cost of living A · lowest: jobs & income B− 100 Montrose Wright County · 3,986 people 65.4 top 15.7% A− Strongest: schools A− , jobs & income B+ · lowest: walkability C− 101 Hanover Wright County · 4,392 people 65.4 top 15.8% A− Strongest: jobs & income A+ , health A · lowest: walkability C− 103 Chisago Lake Township Chisago County · 4,958 people 65.0 top 16.9% A− Strongest: jobs & income A , schools A− · lowest: walkability C 104 Stacy Chisago County · 4,367 people 64.8 top 17.2% A− Strongest: jobs & income A , cost of living B+ · lowest: hazard risk C 105 Sleepy Eye Brown County · 3,461 people 64.7 top 17.4% A− Strongest: cost of living A , safety A− · lowest: schools C+ 106 Big Lake Township Sherburne County · 8,283 people 64.6 top 17.7% A− Strongest: jobs & income A , schools A · lowest: walkability C− 107 Rockford Township Wright County · 3,474 people 64.5 top 17.9% A− Strongest: jobs & income A , schools A− · lowest: hazard risk D 110 St. Francis Anoka County · 8,635 people 64.2 top 18.5% A− Strongest: jobs & income A , cost of living B+ · lowest: walkability C 111 Montevideo Chippewa County · 5,335 people 64.1 top 19.0% A− Strongest: safety A+ , cost of living A− · lowest: hazard risk C 113 Proctor St. Louis County · 3,054 people 64.0 top 19.2% A− Strongest: jobs & income A− , hazard risk B+ · lowest: cost of living C+ 114 Pine Island Goodhue County · 3,911 people 63.9 top 19.4% A− Strongest: jobs & income A , health A · lowest: walkability C 115 Cedar Lake Township Scott County · 3,080 people 63.8 top 19.6% A− Strongest: schools A , jobs & income A · lowest: walkability D 116 Ely St. Louis County · 3,231 people 63.8 top 19.6% A− Strongest: hazard risk A+ , walkability A+ · lowest: jobs & income C− 118 Melrose Stearns County · 3,888 people 63.7 top 19.7% A− Strongest: safety A− , walkability B+ · lowest: hazard risk C+ 119 Zimmerman Sherburne County · 6,904 people 63.7 top 19.9% A− Strongest: schools A , jobs & income B+ · lowest: walkability C+ 120 Norwood Young America Carver County · 3,777 people 63.7 top 19.9% A− Strongest: schools A− , hazard risk A− · lowest: walkability C+ 123 Brockway Township Stearns County · 3,016 people 63.3 top 20.7% A− Strongest: schools A , jobs & income A · lowest: walkability C 125 St. Anthony Hennepin County · 9,989 people 63.2 top 21.0% A− Strongest: walkability A+ , health A+ · lowest: safety C− 126 Pelican Rapids Otter Tail County · 2,608 people 63.1 top 21.2% A− Strongest: safety A , walkability A− · lowest: jobs & income C− 128 Cannon Falls Goodhue County · 4,209 people 63.0 top 21.5% A− Strongest: walkability A , jobs & income A− · lowest: hazard risk C− 129 Belle Plaine Scott County · 7,632 people 62.8 top 22.0% A− Strongest: safety A− , health A− · lowest: cost of living C+ 130 Franklin Township Wright County · 2,939 people 62.7 top 22.1% A− Strongest: schools A+ , jobs & income A+ · lowest: cost of living D 131 La Grand Township Douglas County · 4,309 people 62.7 top 22.3% A− Strongest: hazard risk A , schools A− · lowest: walkability C 132 Breezy Point Crow Wing County · 2,771 people 62.6 top 22.3% A− Strongest: safety A+ , schools A− · lowest: walkability C− 134 Corinna Township Wright County · 2,596 people 62.5 top 22.6% A− Strongest: schools A , jobs & income A− · lowest: walkability C 135 Glenwood Pope County · 2,631 people 62.3 top 23.2% A− Strongest: walkability A , schools A− · lowest: hazard risk C− 136 Sylvan Township Cass County · 3,030 people 62.1 top 23.6% A− Strongest: schools A− , jobs & income B+ · lowest: walkability C+ 137 Two Harbors Lake County · 3,443 people 62.0 top 23.9% A− Strongest: hazard risk A+ , safety A · lowest: health C+ 138 North Oaks Ramsey County · 5,283 people 62.0 top 23.9% A− Strongest: health A , jobs & income A · lowest: cost of living D− 139 Lexington Anoka County · 3,081 people 61.8 top 24.5% A− Strongest: schools A , walkability A− · lowest: cost of living C+ 140 Chisago City Chisago County · 5,955 people 61.8 top 24.7% A− Strongest: schools A− , health B+ · lowest: cost of living C+ 141 Orrock Township Sherburne County · 3,698 people 61.7 top 24.8% A− Strongest: jobs & income A− , schools A− · lowest: hazard risk D 142 Greenfield Hennepin County · 2,962 people 61.7 top 24.9% A− Strongest: jobs & income A+ , health A · lowest: walkability C− 148 East Grand Forks Polk County · 8,906 people 61.3 top 26.2% B+ Strongest: walkability A , safety A · lowest: cost of living C 149 May Township Washington County · 2,638 people 61.1 top 26.6% B+ Strongest: jobs & income A+ , health A · lowest: walkability D 151 Princeton Mille Lacs County · 5,480 people 61.0 top 26.9% B+ Strongest: cost of living A− , schools B · lowest: safety B− 152 Scandia Washington County · 3,979 people 60.9 top 27.0% B+ Strongest: jobs & income A+ , health A− · lowest: walkability C− 154 Spring Lake Township Scott County · 3,498 people 60.8 top 27.5% B+ Strongest: jobs & income A+ , schools A · lowest: cost of living C− 157 Marion Township Olmsted County · 4,111 people 60.3 top 28.6% B+ Strongest: jobs & income A+ , health B+ · lowest: hazard risk C 158 Columbus Anoka County · 4,356 people 60.2 top 28.9% B+ Strongest: jobs & income A+ , health A− · lowest: walkability C 159 Blue Hill Township Sherburne County · 2,625 people 60.0 top 29.4% B+ Strongest: cost of living A− , health B+ · lowest: walkability D 162 Afton Washington County · 2,960 people 59.9 top 29.6% B+ Strongest: health A , jobs & income A · lowest: cost of living D 164 New Market Township Scott County · 3,574 people 59.6 top 30.3% B+ Strongest: schools A , health A · lowest: cost of living D 165 Oak Park Heights Washington County · 4,625 people 59.6 top 30.4% B+ Strongest: schools A , health A− · lowest: safety C− 166 Pipestone Pipestone County · 4,100 people 59.6 top 30.4% B+ Strongest: cost of living A , hazard risk A− · lowest: health C 167 Eagle Lake Blue Earth County · 3,357 people 59.6 top 30.4% B+ Strongest: health A , jobs & income A− · lowest: walkability C 169 Blue Earth Faribault County · 3,165 people 58.9 top 32.2% B+ Strongest: walkability A , cost of living A− · lowest: hazard risk C− 170 Linwood Township Anoka County · 5,403 people 58.8 top 32.4% B+ Strongest: jobs & income A− , health B+ · lowest: walkability D 171 Foley Benton County · 2,650 people 58.7 top 32.6% B+ Strongest: walkability A , schools A− · lowest: safety C+ 172 Watab Township Benton County · 3,478 people 58.6 top 33.0% B+ Strongest: jobs & income A− , health B+ · lowest: walkability D 173 Windom Cottonwood County · 4,817 people 58.5 top 33.1% B+ Strongest: cost of living A , walkability B+ · lowest: hazard risk C 176 Litchfield Meeker County · 6,528 people 58.4 top 33.5% B+ Strongest: schools A− , hazard risk B+ · lowest: jobs & income C 178 Wabasha Wabasha County · 2,599 people 58.2 top 34.1% B+ Strongest: walkability A , cost of living A− · lowest: schools C+ 179 Glencoe McLeod County · 5,632 people 58.1 top 34.3% B+ Strongest: walkability B+ , safety B+ · lowest: hazard risk C+ 181 Oak Grove Anoka County · 9,476 people 57.6 top 35.8% B Strongest: jobs & income A , health A− · lowest: walkability D 182 Thief River Falls Pennington County · 8,799 people 57.2 top 36.7% B Strongest: cost of living A− , walkability B+ · lowest: hazard risk D 183 Cascade Township Olmsted County · 2,810 people 57.2 top 36.9% B Strongest: health A , jobs & income A · lowest: cost of living C 185 Newport Washington County · 5,525 people 57.0 top 37.3% B Strongest: schools A− , hazard risk B+ · lowest: cost of living C+ 187 St. Augusta Stearns County · 3,799 people 56.7 top 38.1% B Strongest: jobs & income A , hazard risk A− · lowest: schools C− 189 Milaca Mille Lacs County · 3,041 people 56.4 top 39.0% B Strongest: cost of living A− , walkability A− · lowest: jobs & income C 191 Osseo Hennepin County · 2,534 people 56.2 top 39.6% B Strongest: health A , walkability A · lowest: safety C+ 192 Mora Kanabec County · 3,763 people 56.0 top 40.0% B Strongest: walkability A , schools A− · lowest: jobs & income C 193 Granite Falls Yellow Medicine County · 2,691 people 55.9 top 40.4% B Strongest: cost of living A , walkability A− · lowest: jobs & income C 194 Wakefield Township Stearns County · 2,829 people 55.8 top 40.6% B Strongest: jobs & income A− , health A− · lowest: walkability C 195 Roseau Roseau County · 2,685 people 55.5 top 41.4% B Strongest: walkability A− , cost of living A− · lowest: hazard risk D 196 St. James Watonwan County · 4,863 people 55.4 top 41.5% B Strongest: cost of living A− , walkability A− · lowest: jobs & income D 200 Cambridge Township Isanti County · 2,592 people 54.9 top 43.1% B Strongest: jobs & income B+ , health B · lowest: walkability C+ 202 Perham Otter Tail County · 3,746 people 54.8 top 43.2% B Strongest: walkability A , hazard risk A · lowest: jobs & income D 204 Spring Lake Park Anoka County · 7,127 people 54.5 top 44.0% B Strongest: walkability A , hazard risk A− · lowest: safety C+ 205 Breckenridge Wilkin County · 3,323 people 54.4 top 44.1% B Strongest: cost of living A , hazard risk B+ · lowest: jobs & income D 207 International Falls Koochiching County · 5,481 people 54.3 top 44.5% B Strongest: cost of living A+ , walkability A · lowest: jobs & income D 209 Dilworth Clay County · 4,823 people 54.1 top 45.0% B Strongest: walkability A+ , hazard risk A− · lowest: safety D 210 St. Joseph Stearns County · 6,846 people 54.0 top 45.3% B− Strongest: walkability B+ , hazard risk B+ · lowest: schools C− 212 Staples Todd County · 3,074 people 53.5 top 46.7% B− Strongest: cost of living A− , hazard risk A− · lowest: jobs & income D 213 Waseca Waseca County · 9,035 people 53.5 top 46.8% B− Strongest: hazard risk A− , walkability B+ · lowest: schools C+ 214 Rice Lake St. Louis County · 4,169 people 53.4 top 47.1% B− Strongest: jobs & income A− , hazard risk B+ · lowest: cost of living C− 215 Bradford Township Isanti County · 3,549 people 53.4 top 47.1% B− Strongest: health B+ , cost of living B · lowest: walkability C 216 Redwood Falls Redwood County · 5,040 people 52.6 top 49.5% B− Strongest: walkability A , cost of living B+ · lowest: jobs & income C 219 White Township St. Louis County · 3,088 people 52.3 bottom 49.7% B− Strongest: cost of living A+ , hazard risk A− · lowest: jobs & income C 220 Rush City Chisago County · 3,300 people 52.1 bottom 49.2% B− Strongest: cost of living B+ , walkability B · lowest: jobs & income C− 221 Sauk Centre Stearns County · 4,663 people 52.1 bottom 49.2% B− Strongest: walkability A , safety B+ · lowest: jobs & income D 222 Palmer Township Sherburne County · 2,633 people 52.1 bottom 49.2% B− Strongest: jobs & income A , health B · lowest: walkability C− 223 Cold Spring Stearns County · 4,329 people 52.0 bottom 49.0% B− Strongest: health A− , schools B+ · lowest: cost of living C− 224 Long Prairie Todd County · 3,830 people 51.9 bottom 48.7% B− Strongest: hazard risk A+ , walkability A− · lowest: schools C− 226 Harris Township Itasca County · 3,364 people 51.8 bottom 48.3% B− Strongest: schools B+ , health B · lowest: walkability D 229 Bemidji Township Beltrami County · 4,031 people 50.8 bottom 45.8% B− Strongest: health B , cost of living B− · lowest: hazard risk C+ 232 Benson Swift County · 3,444 people 50.2 bottom 44.0% C+ Strongest: walkability A , safety A− · lowest: hazard risk C− 235 Cohasset Itasca County · 2,728 people 49.4 bottom 41.8% C+ Strongest: schools B+ , health B · lowest: walkability D 237 Chisholm St. Louis County · 4,625 people 48.8 bottom 40.2% C+ Strongest: cost of living A , walkability A− · lowest: health C− 240 Crookston Polk County · 7,375 people 48.4 bottom 39.1% C+ Strongest: walkability A , cost of living B+ · lowest: hazard risk C− 242 Eveleth St. Louis County · 3,381 people 48.3 bottom 38.9% C+ Strongest: hazard risk A , cost of living A · lowest: jobs & income D 244 Virginia St. Louis County · 8,187 people 48.0 bottom 37.9% C+ Strongest: cost of living A , walkability A− · lowest: jobs & income D 245 Baxter Crow Wing County · 9,217 people 47.9 bottom 37.7% C+ Strongest: hazard risk A− , health B+ · lowest: cost of living C− 247 Grand Lake Township St. Louis County · 2,705 people 47.5 bottom 36.7% C+ Strongest: schools B+ , hazard risk B+ · lowest: walkability D 248 Northern Township Beltrami County · 3,701 people 47.2 bottom 35.7% C+ Strongest: jobs & income B+ , health B · lowest: cost of living C 252 Pine City Pine County · 3,820 people 46.3 bottom 33.7% C Strongest: cost of living B+ , walkability B · lowest: jobs & income D 255 Wadena Wadena County · 4,341 people 45.8 bottom 32.4% C Strongest: hazard risk A , walkability A− · lowest: jobs & income D 257 Collegeville Township Stearns County · 3,262 people 44.6 bottom 29.1% C Strongest: health B+ , hazard risk B+ · lowest: cost of living D 258 Moose Lake Carlton County · 2,948 people 44.6 bottom 29.1% C Strongest: cost of living A− , hazard risk B+ · lowest: jobs & income D 263 Pokegama Township Pine County · 2,884 people 41.7 bottom 22.5% C− Strongest: schools B , jobs & income B− · lowest: hazard risk C− 264 Little Falls Morrison County · 9,277 people 40.7 bottom 20.5% C− Strongest: walkability B+ , cost of living B · lowest: hazard risk D 265 Park Rapids Hubbard County · 4,447 people 40.1 bottom 19.2% C− Strongest: walkability A− , hazard risk B+ · lowest: jobs & income D− 267 Sandstone Pine County · 2,543 people 39.6 bottom 18.2% C− Strongest: walkability A− , hazard risk B+ · lowest: jobs & income D− 271 Waite Park Stearns County · 8,450 people 31.6 bottom 6.4% D Strongest: walkability A , hazard risk A− · lowest: safety D Method
How this list is made Each town’s overall grade blends seven livability grades: cost of living (weight 18), safety (18), schools (16), health (14), jobs & income (12), walkability (8) and hazard risk (4). A town needs 2,500+ residents and three of the first four. Letters are national, so an A here means the same as an A in any state; the list is the same towns in the same order, ranked within Minnesota. Towns without their own FBI figures are graded on the rest and their page says why.
Data years: crime 2023–2025 (FBI), Census ACS 2020–2024, CDC PLACES 2025, state school tests. How grades work
Quick answers
Questions people ask What is the best small town in Minnesota? Among 167 graded towns of 2,500 to 9,999 residents, Chatfield (Fillmore County) ranks first, with an A+; safety (A+) and schools (A) are its strongest grades; hazard risk (B−) is its lowest. Barnesville and Deephaven follow.
How are these towns ranked? By the overall grade, which blends seven livability grades from public data. The letter is national; the rank is within Minnesota. The full method is on How grades work .
Why isn’t my town on this list? The list covers towns of 2,500 to 9,999 residents with an overall grade (167 in Minnesota). 301 smaller places have subject grades only; 3 towns of 2,500+ lack enough data for a grade; Larger towns are on the best places to live list. Every town is on the Minnesota page .
Go deeper More Minnesota lists Every list ranks the same 2,500+ towns, so a town’s rank means the same thing on each.
All Minnesota rankings → Other states
Best small towns in other states 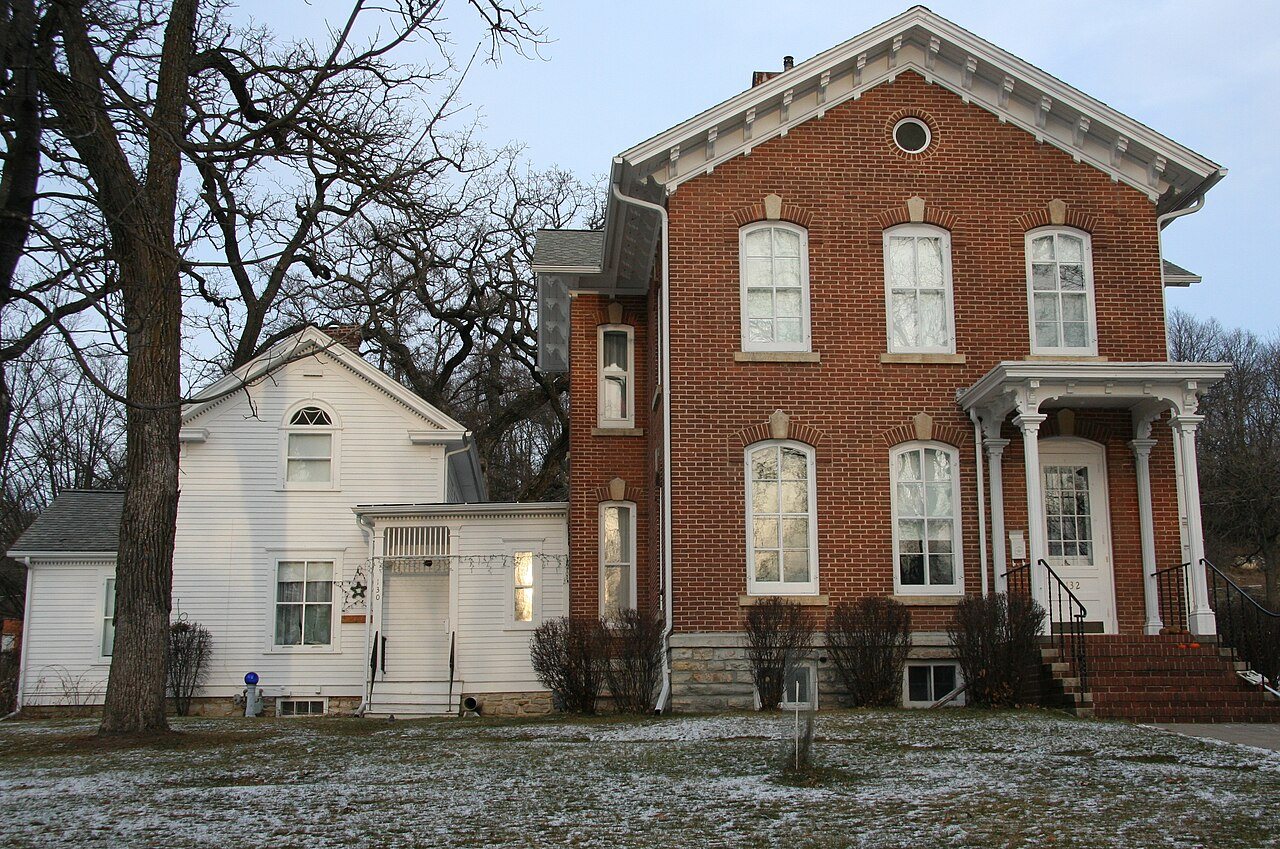 #1
 #2