172 years in pictures
Census counts: 849 in 1880, 9,087 in 2020. The archive holds 4 old photos and papers going back to 2004 and 4 maps from 1955 on.
1 place on the National Register of Historic Places.
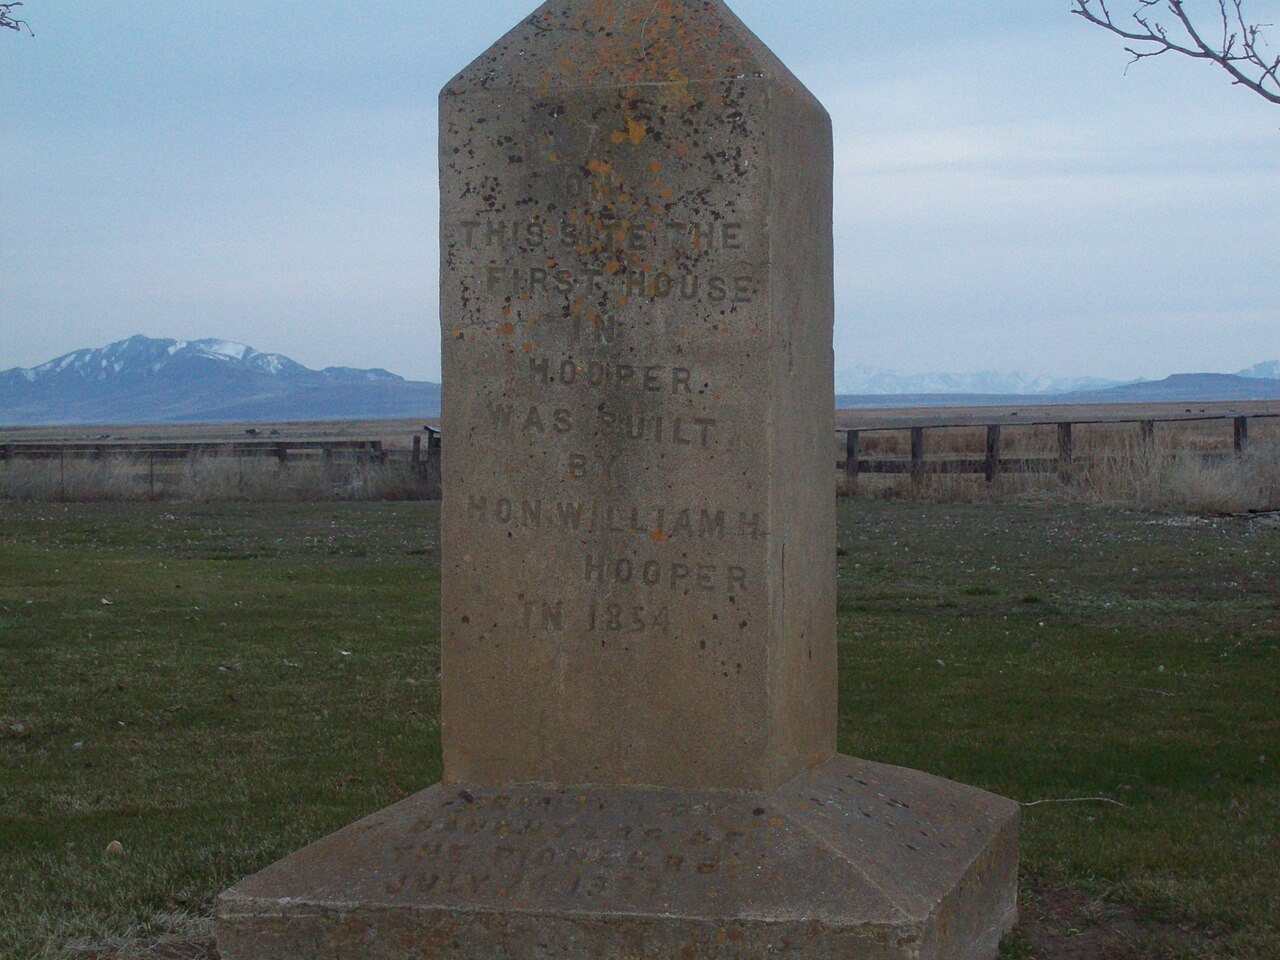
- 1854Hooper is settled
Each edition grades its towns against each other only.

Hooper grades B overall, 84th of 118 graded towns in Utah, with clear strengths and some subjects that lag. The median household earns $113K and CDC estimates put its residents' health ahead of 80% of the country. Its lowest everyday mark is in cost of living: the typical home is worth about $645K, 6.4 years of the Ogden metro’s $101K median household income. 86% of the land in Hooper is conserved, against 3.4% in Utah’s towns and 4.3% across U.S. towns. Ogden Bay Wildlife Management Area, at 8,263 acres with 21.1 miles of trail, is the biggest park or preserve. On civic life, just 2 of Utah’s 137 towns do worse.
Where Hooper beats most towns.
7,218 counted in 2010 and 9,087 in 2020; an estimated 9,741 in 2025.
Growth hasn’t slowed: 7.2% since 2020, after 25.9% in the decade before.
U.S. Census 2010 & 2020 counts · Census Bureau estimate, July 1, 2025
Each subject compared with towns across the country (schools within Utah), ordered by how far Hooper is from typical.
How TownRatings grades towns →
Census counts: 849 in 1880, 9,087 in 2020. The archive holds 4 old photos and papers going back to 2004 and 4 maps from 1955 on.
1 place on the National Register of Historic Places.
Who provides power, water and the rest in Hooper, and how to reach them.
EPA SDWIS (Oct 9, 2026) · HIFLD + EIA-861 2025 · Census 2020 ZCTAs · NCES 2024–25 · registration: vote.gov, updated Mar 13, 2026.
Ordered by what stands out in Hooper.
Hooper keeps more of its land conserved than most of Utah, sends most of its workers to Ogden and beyond and is healthy by national standards but mid-pack in Utah.
Its 48,295 conserved acres are a larger share of the town than in any other Utah town.
35 miles of trail in 4 parks and preserves. Hooper’s trail density is 0.4 miles per square mile, where Utah’s towns sit at 1.1 and U.S. towns at 0.4.
| Biggest places to walk | Trails | Acres |
|---|---|---|
| 1. Ogden Bay Wildlife Management Area | 21.1 mi | 8,263 |
| 2. Hooper Park | — | 25 |
| 3. Hooper Landings Parkway | — | 10 |
Trails & parks © OpenStreetMap contributors · Conserved land: USGS PAD-US
Its public schools are run by the Weber District. One of its 2 schools is below, with why it’s listed.
| School | Level | Students | Letter |
|---|---|---|---|
| Freedom SchoolLargest public elementary schoolGrades K–6 | Grades K–6 | 784 | C+ |
NCES · EDFacts · graded within UT on state tests and graduation
Within Utah it is less healthy than 64% of the 118 graded towns: Utah sets a high bar. Against the 6,702 U.S. towns with household incomes like Hooper’s, it is healthier than 62%, a smaller edge than it has nationally: part of it comes with its incomes.
29% of Hooper adults have been diagnosed with depression. Hooper beats the Utah average on 2 of 32 CDC measures and trails it on 1. 12% of Hooper adults binge drink.
| Hooper | Utah towns | U.S. towns | |
|---|---|---|---|
| Depression (CDC PLACES) | 29% | 28% | 23% |
| Binge drink (CDC PLACES) | 12% | 11% | 16% |
| Yearly checkup (CDC PLACES) | 74% | 72% | 79% |
| Diabetes (CDC PLACES) | 8.2% | 8.4% | 12% |
| What stands out | Hooper | UT |
|---|---|---|
| Fewer uninsured adults | 8.1% | 10.5% |
| More adults getting a yearly checkup | 73.6% | 70.4% |
| More adults with arthritis | 24.9% | 21.7% |
CDC PLACES 2025 · modeled estimates for adults · CMS · HRSA
Hooper has 666 jobs for its 4,272 working residents: even if every job went to a resident, most would still commute out. Jobs based here grew from 385 in 2013 to 666.
Most working residents leave Hooper for work: only 4% work in town. Since 2013, Hooper has added 281 jobs, to 666 in 2023. 4.4% of residents live below the poverty line in Hooper.
| Hooper | Utah towns | U.S. towns | |
|---|---|---|---|
| Median household income | $113,000 | $101,000 | $80,000 |
| Below the poverty line | 4.4% | 6.4% | 9.6% |
| Work from home | 17% | 16% | 11% |
| Working residents who work in town | 3.8% | 8.5% | 8% |
Census LEHD 2023 · ACS
Adults 18 to 34 are 16% of residents (26% statewide); adults 35 to 64 are 41% of residents (34% statewide). Hooper has grown 7.2% since 2020, to 9,741 residents in the Census Bureau’s 2025 estimate. Hooper’s median age is 36 years.
| Hooper | Utah towns | U.S. towns | |
|---|---|---|---|
| Under 18 | 33% | 30% | 22% |
| Aged 65 or older | 9.6% | 11% | 18% |
| Median age | 36 years | 32.6 years | 40.5 years |
| Bachelor’s degree or more, 25+ | 31% | 36% | 29% |
51% women, 49% men
That’s an even split within the survey’s margin of ±3 points. Across Utah, 49.3% of residents are women.
| Hooper | UT | U.S. | |
|---|---|---|---|
| Under 10 | 13.8% | 14.6% | 11.6% |
| 10 to 17 | 19.4% | 13.2% | 10.3% |
| 18 to 24 | 8.6% | 11.6% | 9.1% |
| 25 to 34 | 7.8% | 14.8% | 13.7% |
| 35 to 44 | 18% | 13.8% | 13.2% |
| 45 to 54 | 14% | 11% | 12.2% |
| 55 to 64 | 8.8% | 9.1% | 12.7% |
| 65 to 74 | 6.4% | 7.3% | 10.2% |
| 75 and older | 3.2% | 4.6% | 7% |
| No diploma | 5% | 6.6% | 10.4% |
| High school | 26.4% | 22.3% | 26% |
| Some college | 23.2% | 23.5% | 19.1% |
| Associate’s | 14.2% | 9.9% | 8.8% |
| Bachelor’s | 21% | 24.7% | 21.6% |
| Graduate | 10.2% | 13% | 14.1% |
Census population estimates, 2025 · U.S. Census Bureau · ACS 2020-2024 5-year estimates
Among 119 Utah towns, just 1 have a higher share of households owning their home than Hooper. The median rent in Hooper is $2,269 a month. The typical Hooper home is worth about $645,000, up 3% in a year, 21% above the Utah typical home.
| Hooper | Utah towns | U.S. towns | |
|---|---|---|---|
| Median rent | $2,269 a month | $1,538 a month | $1,185 a month |
| Households that own their home | 96% | 79% | 73% |
Census ACS, 2020–24 · Zillow Home Value Index · Redfin Data Center
Hooper has chilly winters and hot summers, with very little rain. July afternoons reach 92°, January nights drop to 21° and about 23 inches of snow falls in a winter.
NOAA U.S. Climate Normals, 1991–2020
Expected storm and flood damage is lower than in 65% of U.S. communities.
FEMA National Risk Index · OpenFEMA
Museums, parks, gardens and other places to visit around Hooper. Close and well known come first.
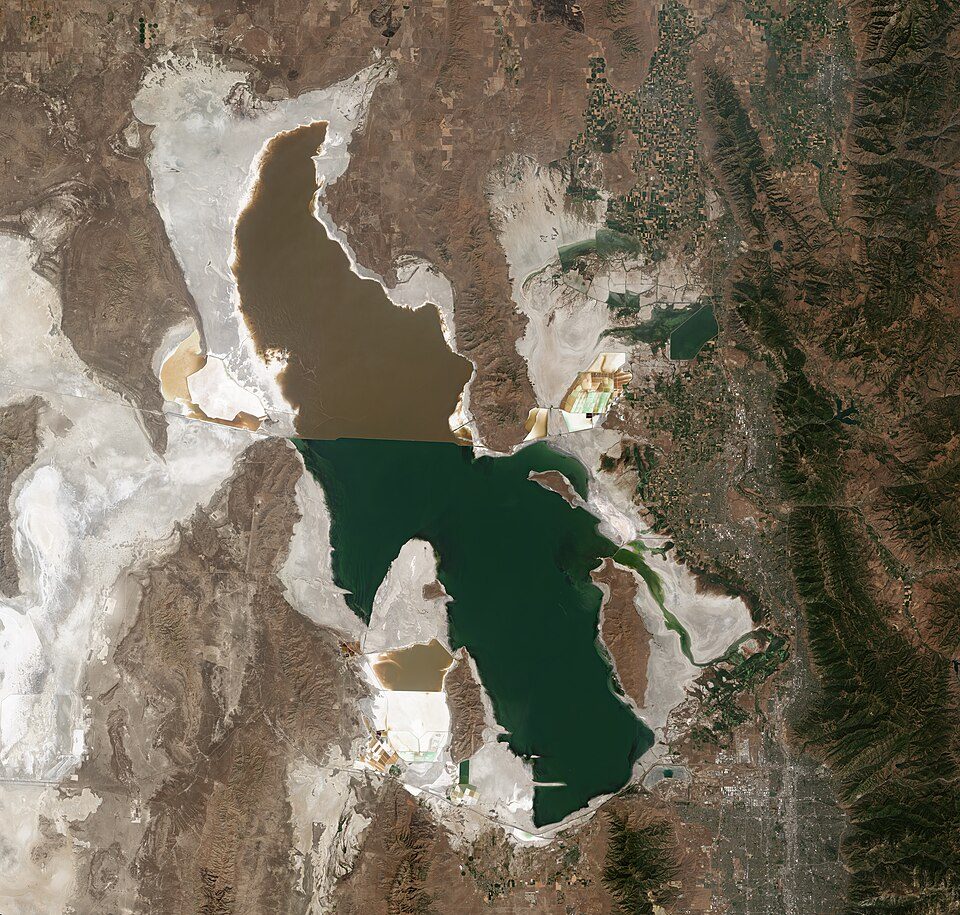
Big draw16 mi LakeGreat Salt Lake
Big draw34 mi Stadium & arenaDelta Center
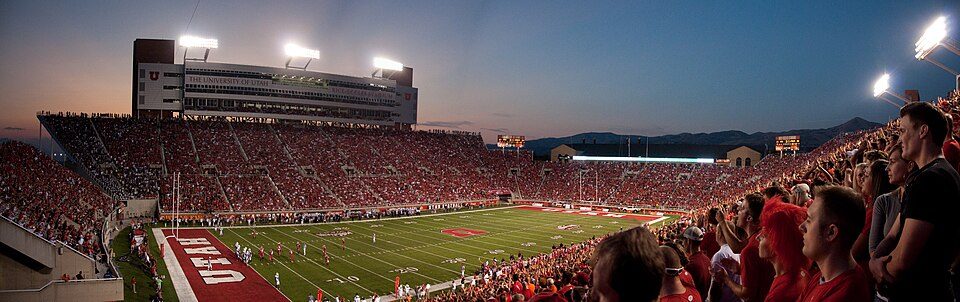
36 mi Stadium & arenaRice–Eccles Stadium
28 mi LandmarkSpiral Jetty
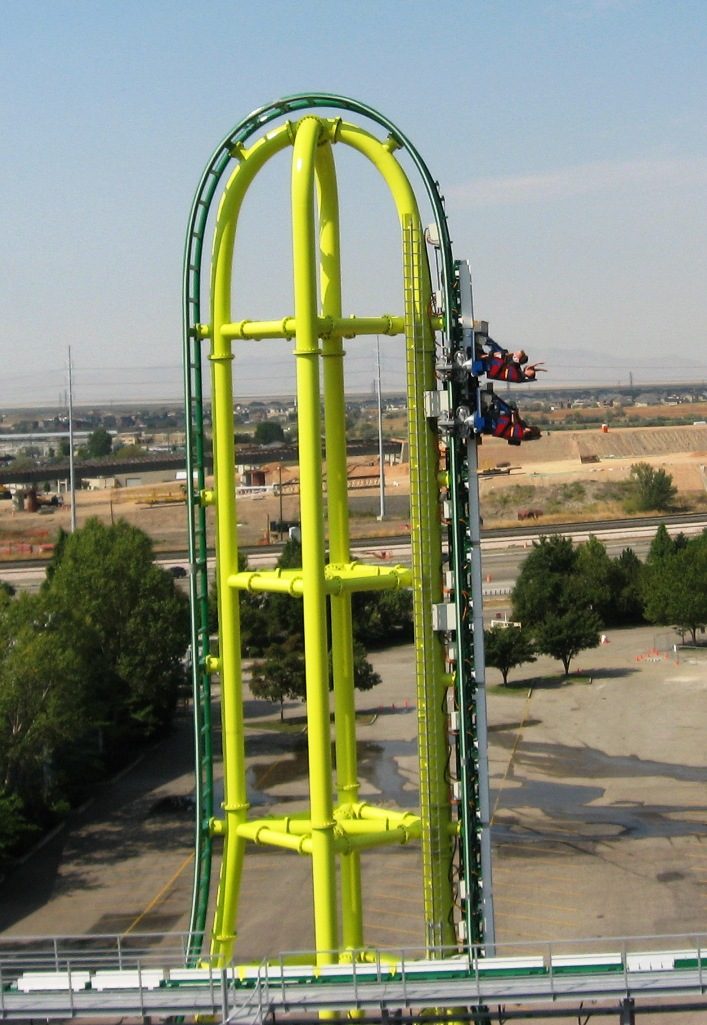
24 mi Theme parkLagoon Amusement Park
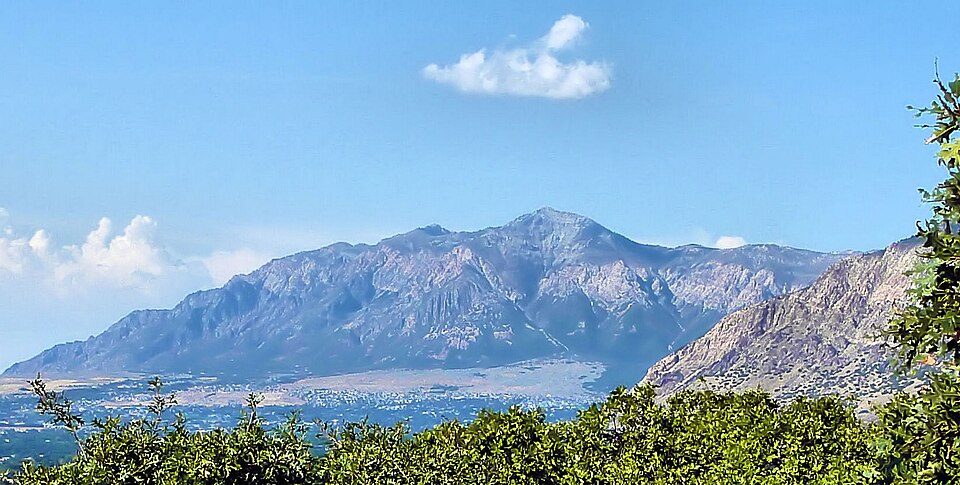
22 mi MountainBen Lomond MountainGreat Salt Lake: Copernicus Sentinel-2, ESA, CC BY-SA 3.0 igo · Delta Center: Lomrjyo, CC BY-SA 4.0 · Rice–Eccles Stadium: Brenton Walker, CC BY 2.0 · Spiral Jetty: Sculpture: Robert Smithson 1938-1973Image:Soren.harward at en.wikipedia, Public domain · Lagoon Amusement Park: Davehi1, Public domain · Ben Lomond Mountain: Joe Tordiff, CC BY-SA 2.0
None within 15 miles of Hooper; the nearest are
About 6 of every 100 Hooper residents are enrolled in college, against 8 across Utah.
86.2% of the town is conserved land, across 4 parks and preserves.
City in Weber County, Utah, United States
Hooper ( HUU-pər) is a city in Weber County, Utah, United States, first called Muskrat Springs and later Hooperville for Captain William Henry Hooper, an early Utah delegate to Congress. The population was 9,087 at the 2020 census, up from the 2010 figure of 6,932. Prior to the city's incorporation on November 30, 2000, Hooper was an unincorporated census-designated place (CDP). Hooper is part of the Ogden-Clearfield metropolitan area.
From Wikipedia, licensed CC BY-SA 4.0 · facts via Wikidata (CC0)
2 towns share a border with Hooper.
| Town | UT rank | Overall | Cost | Safety | Schools | Health |
|---|---|---|---|---|---|---|
| Hooper | #84 | B | C | — | B | A− |
| Roy | #52 | A− | B− | B | B | A− |
| West Haven | #70 | B+ | C | — | B | A− |
Hooper and West Haven report no FBI crime data of their own. Compare Hooper with a neighbor →
Short answers, built from the data on this page.
By most measures, yes. Hooper grades B overall, better than 62% of U.S. towns and #84 of 118 in Utah. It grades A− for health and B for schools. Walkability is its weak spot, with a C−.
Cost of living, which also weighs rents, property taxes and how many households pay 30% or more of their income for housing, grades C.