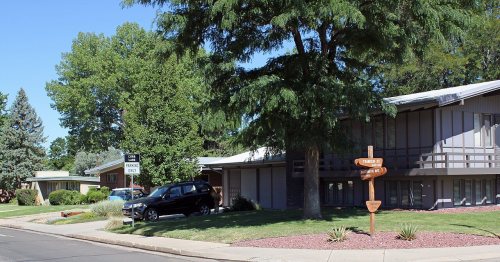
166 years in pictures
Census counts: 2,983 in 1910, 33,659 in 2020. The archive holds 12 old photos and papers going back to 1913 and 6 maps from 1940 on.
5 places on the National Register of Historic Places.
- 1860Englewood is settled
Each edition grades its towns against each other only.

A town of 35,305, settled in 1860.
Englewood's crime rate is higher than 97% of U.S. towns, with 233 violent crimes reported to the FBI in 2025. Overall it grades C, ranked 131st of 158 in Colorado. It is healthier than 89% of U.S. towns and the median household earns $87K. Its weakest subject is schools: its schools rank behind 85% of the state's. Englewood’s property crime rate is 41.8 per 1,000 residents, where Colorado’s towns sit at 15.2 and U.S. towns at 9.9. Englewood is more walkable than 96% of U.S. towns. On safety, just 9 of Colorado’s 102 towns do worse.
Where Englewood beats most towns, and one thing worth knowing.
30,255 counted in 2010 and 33,659 in 2020; an estimated 35,305 in 2025.
U.S. Census 2010 & 2020 counts · Census Bureau estimate, July 1, 2025
Each subject compared with towns across the country (schools within Colorado), ordered by how far Englewood is from typical.
Its grades run from A+ for walkability (better than 96% of comparable towns) to D− for safety (better than 3%), so the C overall blends very different results.
How TownRatings grades towns →
Census counts: 2,983 in 1910, 33,659 in 2020. The archive holds 12 old photos and papers going back to 1913 and 6 maps from 1940 on.
5 places on the National Register of Historic Places.
Museums, parks, gardens and other places to visit around Englewood. Close and well known come first.
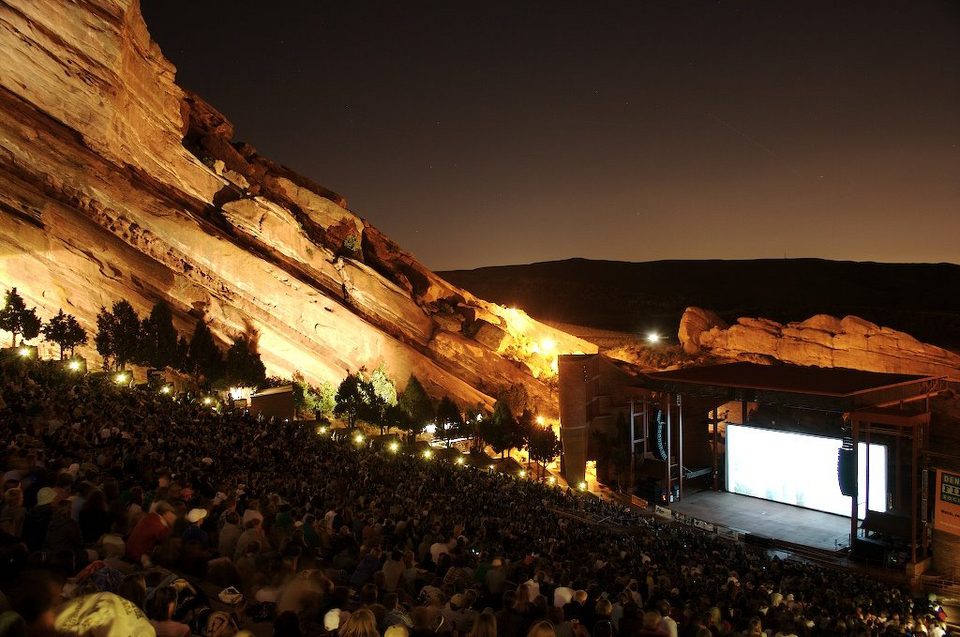
Big draw11 mi TheatreRed Rocks Amphitheatre
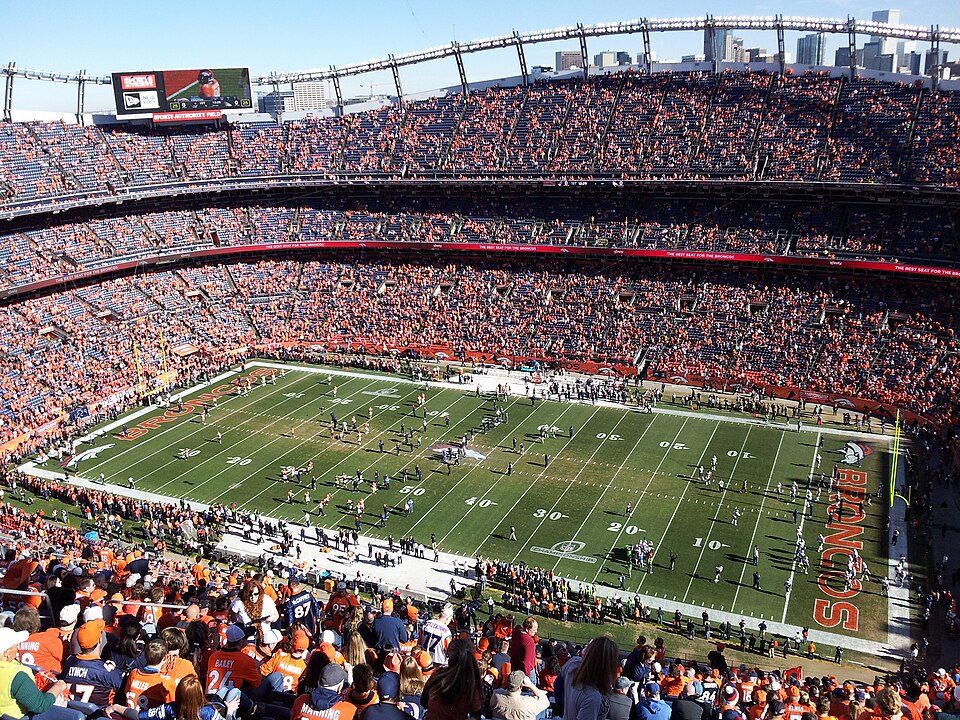
Big draw7 mi Stadium & arenaEmpower Field at Mile High
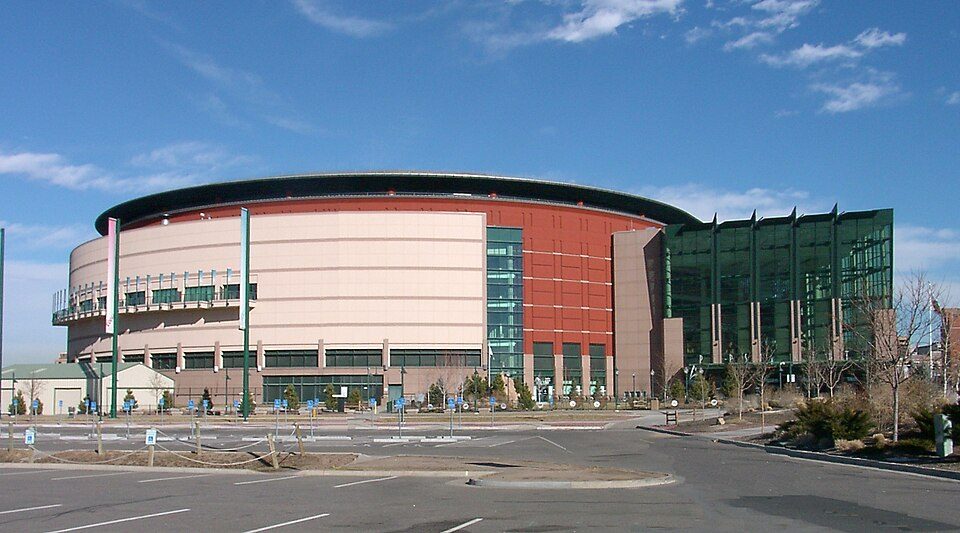
7 mi Stadium & arenaBall Arena
8 mi Stadium & arenaCoors Field
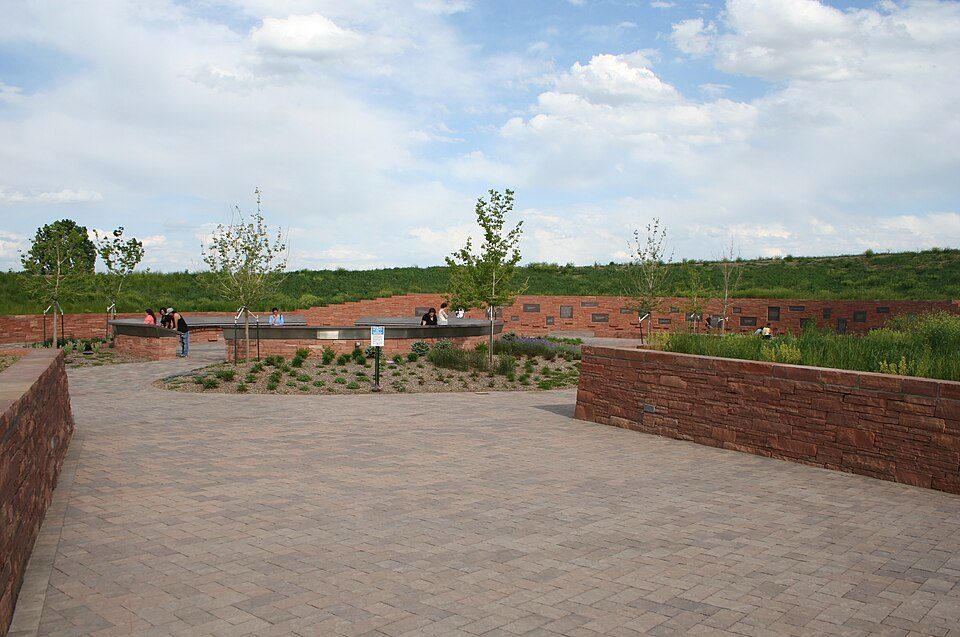
5 mi LandmarkColumbine Memorial
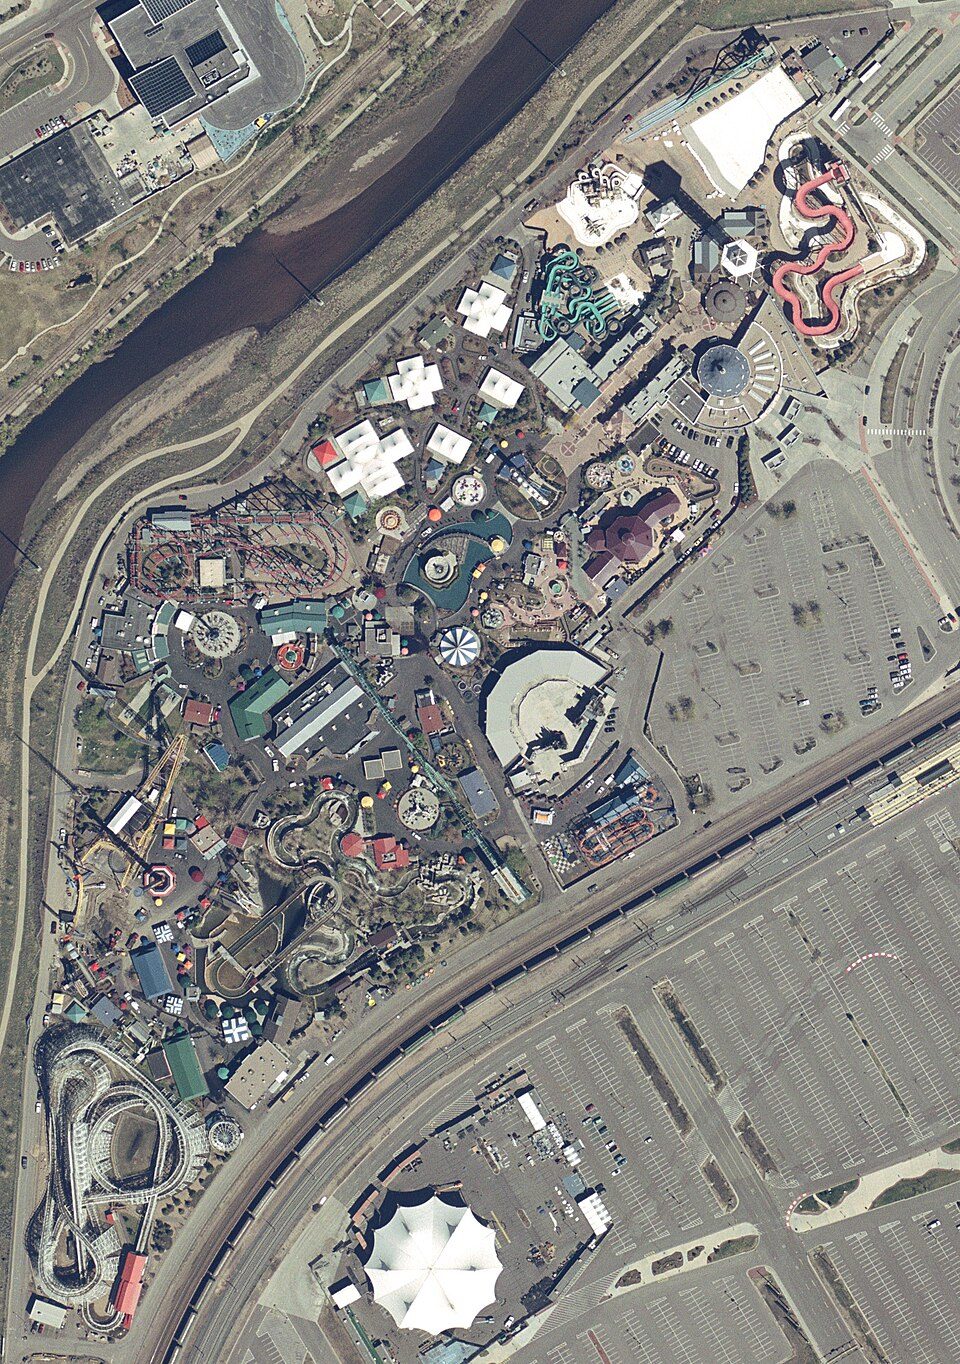
7 mi Theme parkElitch Gardens Theme ParkRed Rocks Amphitheatre: Unknown, CC BY-SA 3.0 · Empower Field at Mile High: Thelastcanadian, CC BY-SA 3.0 · Ball Arena: KM Newnham, CC BY-SA 2.5 · Coors Field: Matt Kozlowski, CC BY-SA 3.0 · Columbine Memorial: Denverjeffrey, CC BY 3.0 · Elitch Gardens Theme Park: USGS, Public domain
Who provides power, water and the rest in Englewood, and how to reach them.
EPA SDWIS (Oct 9, 2026) · HIFLD + EIA-861 2025 · Census 2020 ZCTAs · NCES 2024–25 · registration: vote.gov, updated Nov 18, 2024.
Ordered by what stands out in Englewood.
Englewood has home values still below their peak, has seen reported crime fall by a fifth or more and is healthy by national standards but mid-pack in Colorado.
Reported crimes fell from 2,105 to 1,724 over the last three FBI years, a drop beyond ordinary year-to-year swings.
Englewood’s violent crime rate is 6.5 per 1,000 residents. Englewood reports more crime per resident than most U.S. towns we grade: about 97% report less.
FBI crime data, 2025 · crimes reported to police
Its public schools are run by the Englewood School District No. 1. Three of its 11 schools are below, each with why it’s listed.
| School | Level | Students | Letter |
|---|---|---|---|
| Clayton Elementary SchoolLargest public elementary schoolGrades K–6 | Grades K–6 | 402 | B |
| Englewood High SchoolLargest public high schoolGrades 9–12 | Grades 9–12 | 515 | C+ |
| Englewood Leadership AcademyTop results in townGrades 6–9 | Grades 6–9 | 110 | A+ |
NCES · EDFacts · graded within CO on state tests and graduation
Within Colorado it is healthier than 51% of the 159 graded towns: Colorado sets a high bar.
68% of Englewood adults had a checkup this year. Englewood beats the Colorado average on 2 of 26 CDC measures and trails it on 1. 20% of Englewood adults binge drink.
| Englewood | Colorado towns | U.S. towns | |
|---|---|---|---|
| Yearly checkup (CDC PLACES) | 68% | 71% | 79% |
| Binge drink (CDC PLACES) | 20% | 18% | 16% |
| High blood pressure (CDC PLACES) | 25% | 27% | 35% |
| Diabetes (CDC PLACES) | 7.4% | 8.5% | 12% |
| What stands out | Englewood | CO |
|---|---|---|
| Fewer adults with diabetes | 7.4% | 8.6% |
| Fewer adults with high cholesterol | 28.7% | 31.5% |
| Fewer adults getting a yearly checkup | 67.9% | 71.4% |
CDC PLACES 2025 · modeled estimates for adults · CMS · HRSA
Englewood has chilly, snowy winters and warm summers, with very little rain. The July high in Englewood is 89°F.
NOAA U.S. Climate Normals, 1991–2020
Most working residents leave Englewood for work: only 7% work in town. 23% of workers work from home in Englewood. The top destinations are Denver (34%), Aurora (5%) and Lakewood (5%).
| Englewood | Colorado towns | U.S. towns | |
|---|---|---|---|
| Work from home | 23% | 18% | 11% |
| Average trip to work | 23 minutes | 25 minutes | 25 minutes |
| Median household income | $87,000 | $95,000 | $80,000 |
| Below the poverty line | 7.7% | 8.5% | 9.6% |
Census LEHD 2023 · ACS
Expected storm and flood damage is higher than in 64% of U.S. communities. Since 1997, 5 flood insurance claims have been paid out in Englewood.
FEMA flood insurance claims · FEMA National Risk Index · OpenFEMA
Children under 18 are 15% of residents (21% statewide); adults 18 to 34 are 30% of residents (25% statewide). Englewood has grown 4.9% since 2020, to 35,305 residents in the Census Bureau’s 2025 estimate. 49% of adults 25 and older have a bachelor’s degree or more, vs 46% across Colorado.
| Englewood | Colorado towns | U.S. towns | |
|---|---|---|---|
| Under 18 | 15% | 22% | 22% |
| Bachelor’s degree or more, 25+ | 49% | 44% | 29% |
| Median age | 37.4 years | 38.4 years | 40.5 years |
| Aged 65 or older | 15% | 15% | 18% |
50% women, 50% men
That’s an even split within the survey’s margin of ±1.6 points. Across Colorado, 49.3% of residents are women. Median age: women 36.6, men 38.5.
| Englewood | CO | U.S. | |
|---|---|---|---|
| Under 10 | 9% | 10.9% | 11.6% |
| 10 to 17 | 5.5% | 10.1% | 10.3% |
| 18 to 24 | 7.7% | 9.1% | 9.1% |
| 25 to 34 | 22.1% | 15.7% | 13.7% |
| 35 to 44 | 17.6% | 14.6% | 13.2% |
| 45 to 54 | 11.6% | 12.2% | 12.2% |
| 55 to 64 | 11.5% | 11.8% | 12.7% |
| 65 to 74 | 9.2% | 9.6% | 10.2% |
| 75 and older | 5.8% | 5.9% | 7% |
| No diploma | 6.5% | 7.1% | 10.4% |
| High school | 20.7% | 19.7% | 26% |
| Some college | 17.2% | 19.2% | 19.1% |
| Associate’s | 6.3% | 8.3% | 8.8% |
| Bachelor’s | 31.6% | 28.1% | 21.6% |
| Graduate | 17.7% | 17.6% | 14.1% |
Census population estimates, 2025 · U.S. Census Bureau · ACS 2020-2024 5-year estimates
4.3 miles of trail in 13 parks and preserves. Belleview Park, at 57 acres with 1.6 miles of trail, is the biggest park or preserve.
| Englewood | Colorado towns | U.S. towns | |
|---|---|---|---|
| Miles of trail per square mile | 0.7 miles per square mile | 1.3 | 0.4 |
| Conserved land | 6.8% | 7% | 4.3% |
| Biggest places to walk | Trails | Acres |
|---|---|---|
| 1. Belleview Park | 1.6 mi | 57 |
| 2. Packy Romans Park | 0.5 mi | 4 |
| 3. Cornerstone Park | 0.4 mi | 47 |
Trails & parks © OpenStreetMap contributors · Conserved land: USGS PAD-US
The typical value, about $495K, is 10% below its June 2022 peak.
The typical Englewood home is worth about $495,000, down 2.5% in a year, 7% below the Colorado typical home.
| Englewood | Colorado towns | U.S. towns | |
|---|---|---|---|
| Households that own their home | 49% | 71% | 73% |
| Median rent | $1,668 a month | $1,812 a month | $1,185 a month |
Zillow Home Value Index · Redfin Data Center
19 within 15 miles of the center of Englewood
About 5 of every 100 Englewood residents are enrolled in college, about the same as Colorado.
5 places in Englewood on the National Register of Historic Places.
21 notable people were born in Englewood.
Home rule city in Arapahoe County, Colorado, United States
The City of Englewood is a home rule city located in western Arapahoe County, Colorado, United States. The town population was 33,659 at the 2020 United States census. Englewood is a part of the Denver-Aurora-Centennial, CO Metropolitan Statistical Area and the Front Range Urban Corridor. Englewood is located immediately south of Denver in the South Platte River Valley.
From Wikipedia, licensed CC BY-SA 4.0 · facts via Wikidata (CC0)
5 towns share a border with Englewood.
Cherry Hills Village next door grades higher for schools (A− to Englewood’s C−) and lower for cost of living (D to C).
| Town | CO rank | Overall | Cost | Safety | Schools | Health |
|---|---|---|---|---|---|---|
| Englewood | #131 | C | C | D− | C− | A |
| Sheridan | #156 | D | C+ | D− | D | B− |
| Denver | #119 | C+ | C− | D− | B− | A |
| Littleton | #54 | B+ | C− | C− | A+ | A+ |
| Cherry Hills Village | #19 | A | D | B+ | A− | A+ |
| Greenwood Village | #77 | B | D | D− | A | A+ |
Short answers, built from the data on this page.
Englewood grades C overall, better than 25% of U.S. towns and #131 of 158 in Colorado. It grades A for health, D− for safety and C− for schools. Safety is its weak spot, with a D−.
That is 4.7 years of the area's median household income ($105,762 across the Denver-Aurora-Centennial, CO metro area). Cost of living, which also weighs rents, property taxes and how many households pay 30% or more of their income for housing, grades C.
21 notable people were born here, including Amy Van Dyken and Logan Miller.