Sterling RanchCO
A town of 4,213.
Is Sterling Ranch a good place to live?
For most people who can afford it, yes. Sterling Ranch grades B+ overall, ranked 62nd of 158 in Colorado. On CDC health estimates it is near the top nationally. Its schools rank ahead of 92% of Colorado towns and the median household earns $207K. The trade-off is money: homes are expensive, about $802K for a typical one and 7.6 times the Denver metro’s $106K median household income. 75% of adults 25 and older hold a bachelor’s degree or more in Sterling Ranch, above both Colorado’s towns (44%) and U.S. towns (29%). Only 8 of Colorado’s 217 towns score lower on walkability. FEMA rates its natural-hazard risk higher than 87% of U.S. communities, with wildfire at the top.
What makes Sterling Ranch stand out
Where Sterling Ranch beats most towns, and one thing worth knowing.
| Widest gap | Sterling Ranch | CO |
|---|---|---|
| Fewer older adults who have lost all their teeth | 3.8% | 9.2% |
98% of working residents leave Sterling Ranch for work
Where Sterling Ranch’s working residents go each day. Line width shows the share.
Census LEHD 2023
How Sterling Ranch grades
Each subject compared with towns across the country (schools within Colorado), ordered by how far Sterling Ranch is from typical.
How TownRatings grades towns →
Red Rocks Amphitheatre and 62 more within 40 miles
Museums, parks, gardens and other places to visit around Sterling Ranch. Close and well known come first.
 Big draw15 mi TheatreRed Rocks Amphitheatre
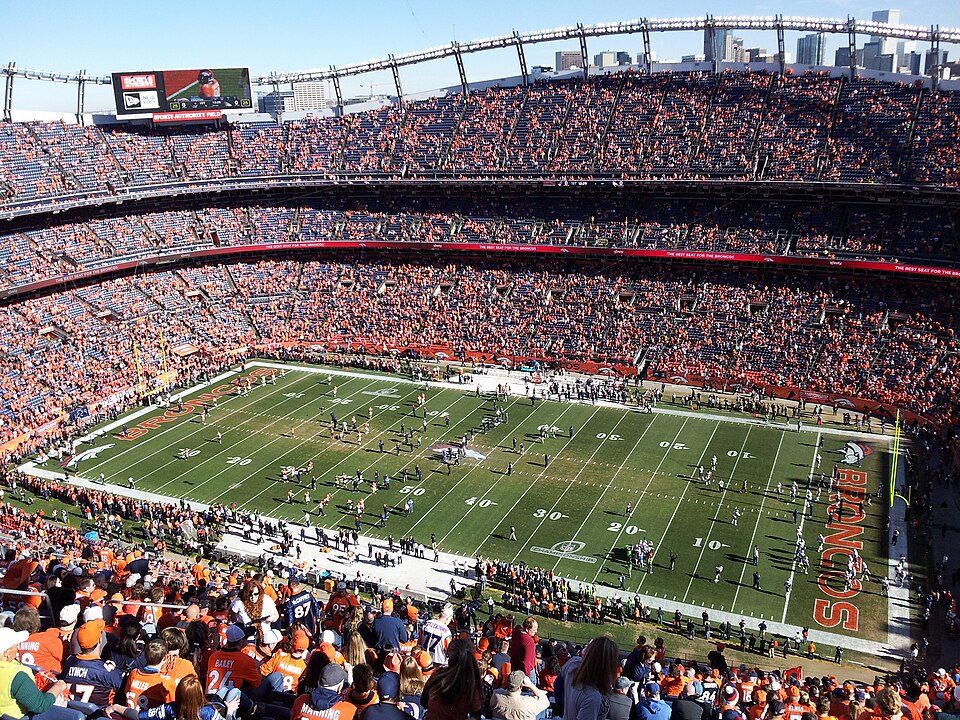 Big draw17 mi Stadium & arenaEmpower Field at Mile High
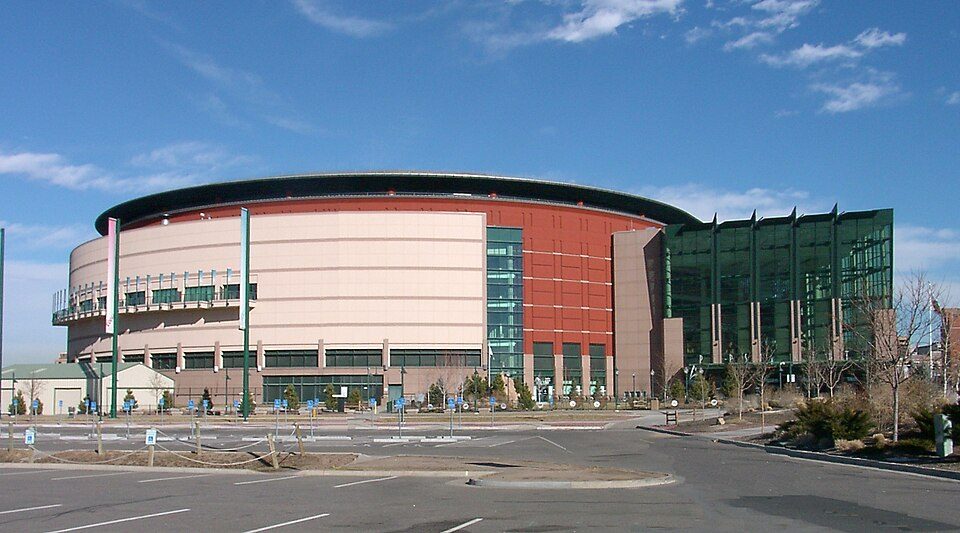 18 mi Stadium & arenaBall Arena
 18 mi Stadium & arenaCoors Field
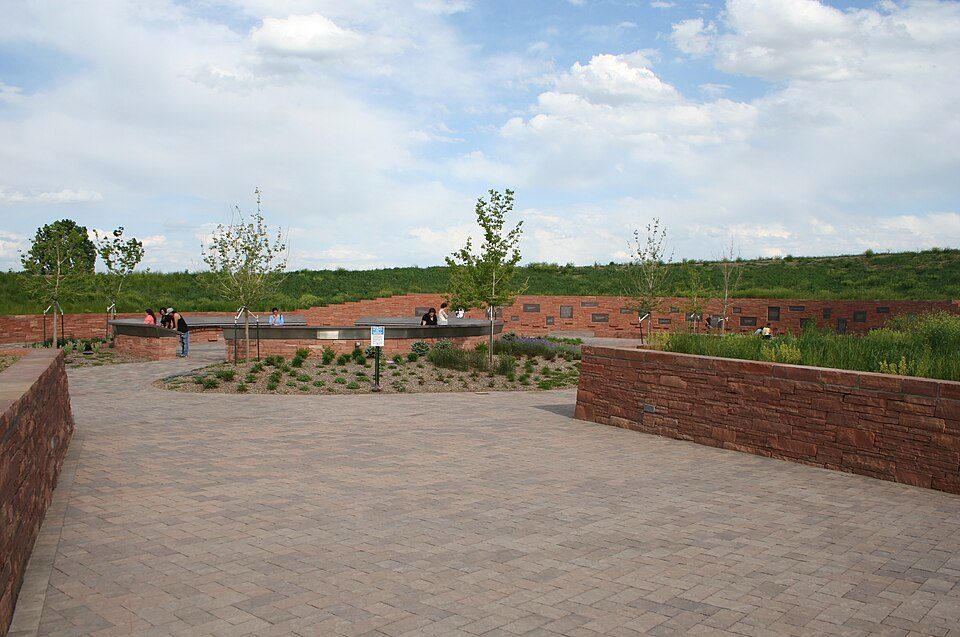 8 mi LandmarkColumbine Memorial
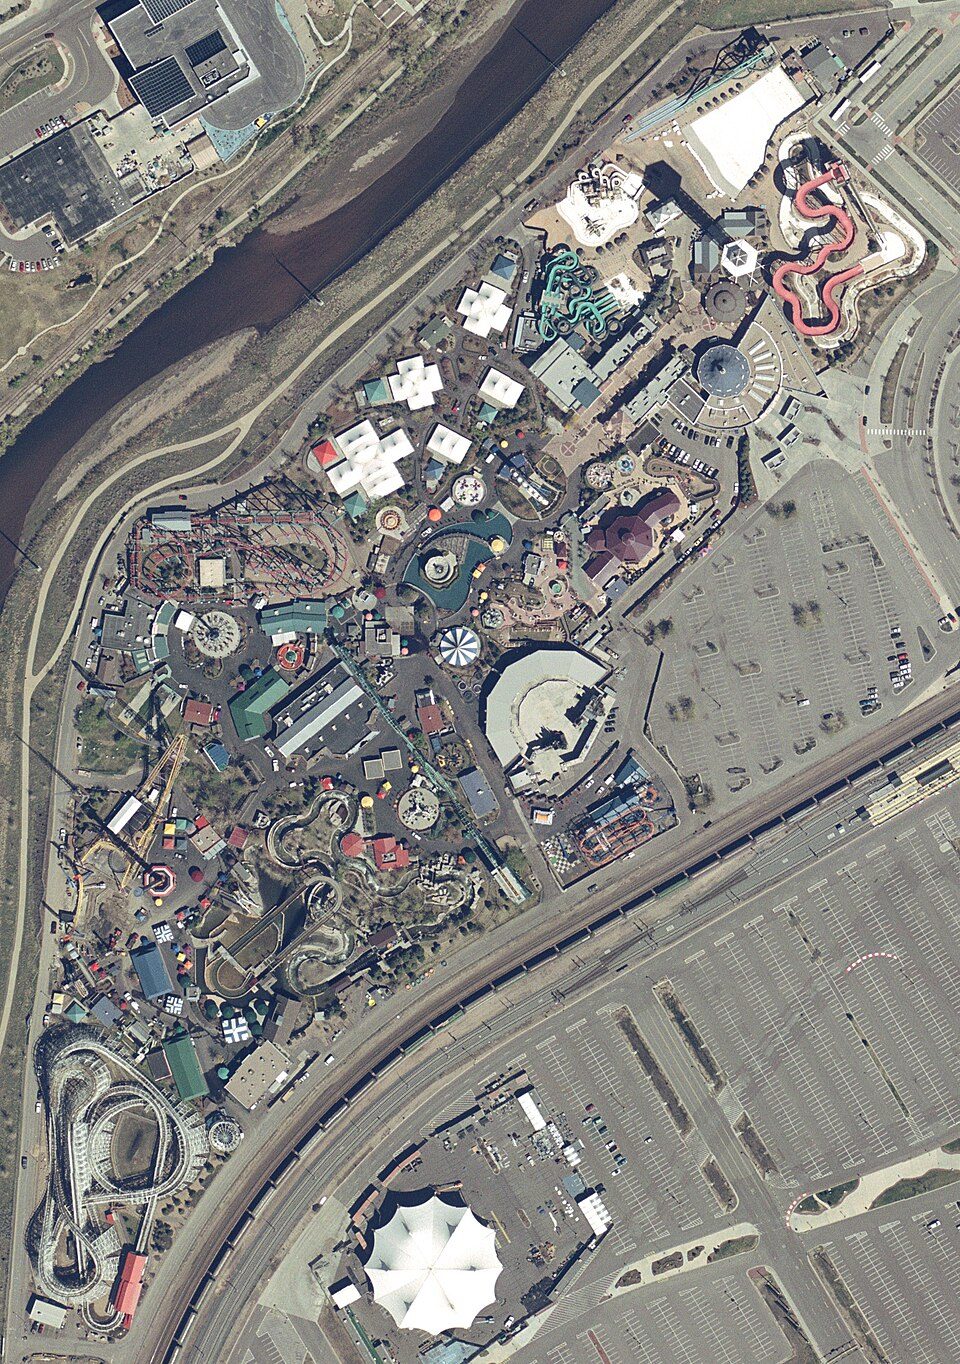 18 mi Theme parkElitch Gardens Theme Park
Photo credits
Red Rocks Amphitheatre: Unknown, CC BY-SA 3.0 · Empower Field at Mile High: Thelastcanadian, CC BY-SA 3.0 · Ball Arena: KM Newnham, CC BY-SA 2.5 · Coors Field: Matt Kozlowski, CC BY-SA 3.0 · Columbine Memorial: Denverjeffrey, CC BY 3.0 · Elitch Gardens Theme Park: USGS, Public domain


Moving to Sterling Ranch: who provides what
Sterling Ranch is unincorporated, so Douglas County and regional agencies provide most services.
EPA SDWIS (Oct 9, 2026) · HIFLD + EIA-861 2025 · Census 2020 ZCTAs · NCES 2024–25 · registration: vote.gov, updated Nov 18, 2024.
The data
Ordered by what stands out in Sterling Ranch.
Sterling Ranch has less tooth loss than most of Colorado, but it carries more natural-hazard risk than most of Colorado (mostly wildfires) and has homes that cost more against local pay than most of Colorado.
A smaller share of adults in Sterling Ranch report frequent physical distress than in the typical Colorado or U.S. town
Its widest gap with Colorado is tooth loss: 3.8% of those 65+ have lost all their teeth, against 9.2% statewide. Against the 939 U.S. towns with household incomes like Sterling Ranch’s, it is healthier than 78%, a smaller edge than it has nationally: part of it comes with its incomes.
8.5% of adults report frequent physical distress in Sterling Ranch. Only 4 of the 159 Colorado towns we compare have a lower share of adults who say their health is fair or poor than Sterling Ranch. 15% of adults report frequent mental distress in Sterling Ranch.
| Sterling Ranch | Colorado towns | U.S. towns | |
|---|---|---|---|
| High blood pressure (CDC PLACES) | 22% | 27% | 35% |
| Frequent physical distress (CDC PLACES) | 8.5% | 12% | 14% |
| Diabetes (CDC PLACES) | 5.5% | 8.5% | 12% |
| Binge drink (CDC PLACES) | 21% | 18% | 16% |
| What stands out | Sterling Ranch | CO |
|---|---|---|
| Fewer older adults who have lost all their teeth | 3.8% | 9.2% |
| Fewer uninsured adults | 5.7% | 11.1% |
| Fewer adults treating high blood pressure | 63.8% | 69.5% |
CDC PLACES 2025 · modeled estimates for adults · CMS · HRSA
Sterling Ranch faces a very high natural-hazard risk, led by wildfire
FEMA rates its natural-hazard risk higher than 92% of Colorado towns; that rating is what its D for hazard risk is built on.
FEMA National Risk Index · OpenFEMA
Sterling Ranch stands out in Colorado and nationally, with the median household income higher than most
Sterling Ranch has 169 jobs for its 1,678 working residents: even if every job went to a resident, most would still commute out. 40.4% of workers work from home, against 21% across Colorado.
2% of Sterling Ranch residents live below the poverty line. Among 159 Colorado towns, just 3 have a higher median household income than Sterling Ranch. 40% of Sterling Ranch workers work from home.
| Sterling Ranch | Colorado towns | U.S. towns | |
|---|---|---|---|
| Work from home | 40% | 18% | 11% |
| Median household income | $207,000 | $95,000 | $80,000 |
| Below the poverty line | 2% | 8.5% | 9.6% |
| Average trip to work | 29 minutes | 25 minutes | 25 minutes |
Where working residents work
Census LEHD 2023 · ACS
0.8% of Sterling Ranch is conserved land
6.4 miles of trail in 3 parks and preserves. The trail density in Sterling Ranch is 1.2 miles per square mile.
| Sterling Ranch | Colorado towns | U.S. towns | |
|---|---|---|---|
| Conserved land | 0.8% | 7% | 4.3% |
| Miles of trail per square mile | 1.2 miles per square mile | 1.3 | 0.4 |
| Biggest places to walk | Trails | Acres |
|---|---|---|
| 1. Cultural Trail Park | 0.3 mi | 4 |
| 2. Culutral Trail Park | 0.3 mi | 3 |
| 3. Pat Gallagher Park | — | 1 |
Trails & parks © OpenStreetMap contributors · Conserved land: USGS PAD-US
Snowy winters and pleasant summers in Sterling Ranch
Sterling Ranch has chilly, snowy winters and warm summers, with very little rain. July afternoons reach 88°, January nights drop to 19° and about 62 inches of snow falls in a winter.
Typical low → high °F
NOAA U.S. Climate Normals, 1991–2020
The median home in Sterling Ranch sells for about $658K
At 7.6 years of the Denver metro’s $106K median household income, the typical home costs more against local pay than in 75% of Colorado towns; that ratio is one input to its D for cost of living. The median property tax bill is $7,302, against $2,602 across Colorado, another input to its cost-of-living grade.
Sterling Ranch’s median rent is $3,501 a month.
| Sterling Ranch | Colorado towns | U.S. towns | |
|---|---|---|---|
| Median rent | $3,501 a month | $1,807 a month | $1,185 a month |
| Households that own their home | 91% | 71% | 73% |
Census ACS, 2020–24 · Zillow Home Value Index · Redfin Data Center
Everything we know about Sterling Ranch
Colleges nearby
6 within 15 miles of the center of Sterling Ranch
About 2 of every 100 Sterling Ranch residents are enrolled in college, against 6 across Colorado.
About Sterling Ranch
Unincorporated community in Douglas County, CO, USA
Sterling Ranch is an unincorporated community and a census-designated place (CDP) located in and governed by Douglas County, Colorado, United States. The population was 1,789 at the 2020 census. The CDP is a part of the Denver–Aurora–Lakewood, CO Metropolitan Statistical Area. Douglas County governs the unincorporated community and the Sterling Ranch Community Authority Board provides services through several metropolitan districts. The Littleton post office (Zip Code 80125) serves the area.
From Wikipedia, licensed CC BY-SA 4.0 · facts via Wikidata (CC0)
Questions about Sterling Ranch
Short answers, built from the data on this page.
Is Sterling Ranch, CO a good place to live?
For most people who can afford it, yes. Sterling Ranch grades B+ overall, better than 68% of U.S. towns and #62 of 158 in Colorado. It grades A+ for health and A for schools. Hazard risk is its weak spot, with a D.
Is Sterling Ranch, CO expensive?
Yes. The typical home is worth about $802,000, 52% above the Colorado typical home. Cost of living, which also weighs rents, property taxes and how many households pay 30% or more of their income for housing, grades D.