Home › Wisconsin › Rankings › Best small towns Mount Horeb, #1 on this list · Photo: Jaknelaps · CC BY-SA 3.0 Wisconsin rankings · 2026 Best small towns in Wisconsin Mount Horeb ranks first of Wisconsin’s 260 graded small towns (2,500–9,999 residents), with an A+: hazard risk (A+) and safety (A+) are its strongest grades; cost of living (C+) is its lowest. 102 of the 260 (39%) grade A− or better nationally, against 25% of U.S. towns.
The overall grade, sorted: cost of living, safety, schools, health, jobs & income, walkability and hazard risk, from Census, FBI, state, CDC, EPA and FEMA data. How grades work
All towns Small towns (2,500–9,999) #1 Dane County · 7,725 people A+ Strongest: hazard risk A+ , safety A+ · lowest: cost of living C+
C+ CostA+ SafetyA− SchoolsA HealthA JobsA− WalkA+ Hazards
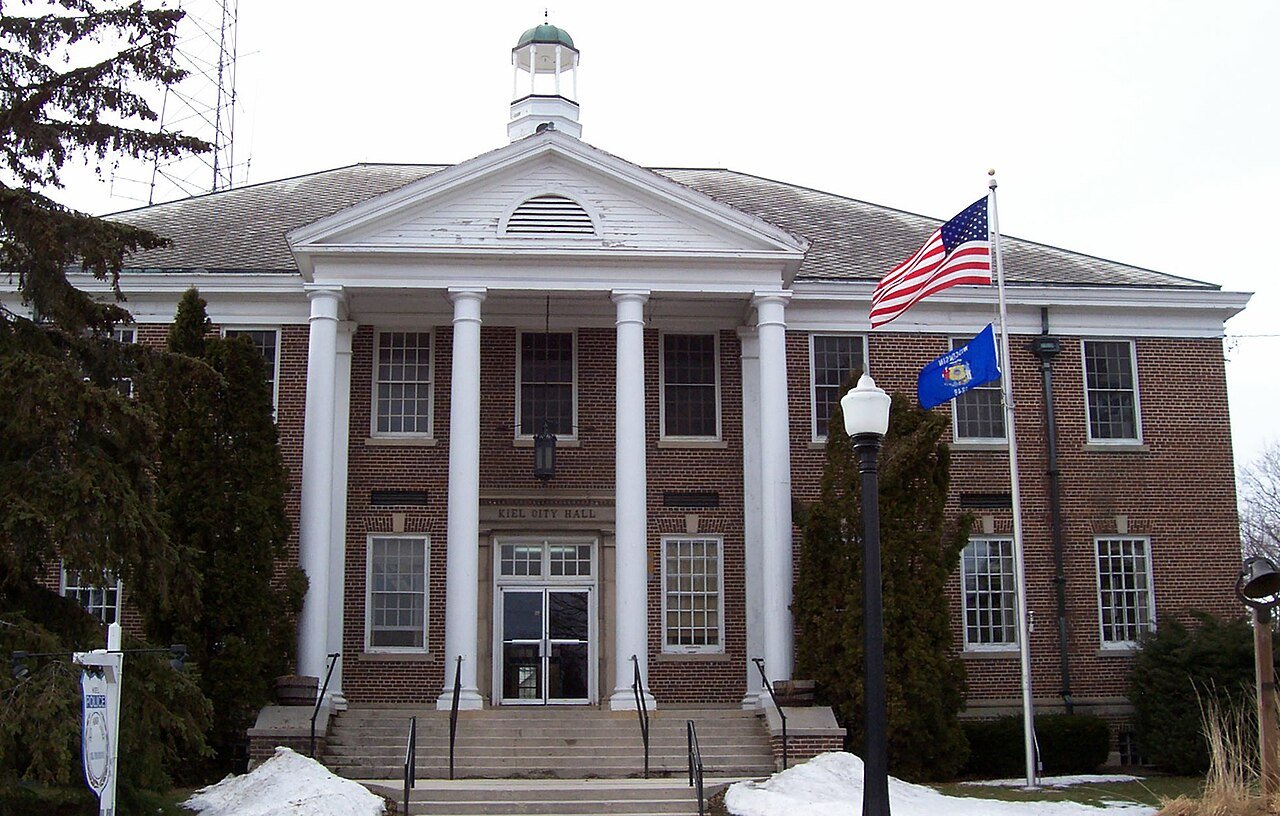
#2 Manitowoc County · 3,973 people A+ Strongest: safety A , hazard risk A · lowest: health B−
A− CostA SafetyA− SchoolsB− HealthB+ JobsB+ WalkA Hazards
#3 Calumet County · 3,040 people A+ Strongest: hazard risk A+ , cost of living A · lowest: schools B
A CostA− SafetyB SchoolsB+ HealthB+ JobsB+ WalkA+ Hazards
Where they are: Two of the top 10 are in Calumet County.
All 260 small towns Overall score, highest first. The score (0–100) blends the seven livability grades and sets the order; the letter places that score among every U.S. town of 2,500+, and A+ is the top 5%, so neighbors on the list often share a letter. Each town links to its page, where the grade sheet shows every subject. The rank is the town’s place among all 357 Wisconsin towns.
# Town Score Grade What drives it
1 Mount Horeb Dane County · 7,725 people 78.0 top 0.4% A+ Strongest: hazard risk A+ , safety A+ · lowest: cost of living C+ 2 Kiel Manitowoc County · 3,973 people 76.9 top 0.6% A+ Strongest: safety A , hazard risk A · lowest: health B− 3 New Holstein Calumet County · 3,040 people 76.2 top 0.9% A+ Strongest: hazard risk A+ , cost of living A · lowest: schools B 4 Kimberly Outagamie County · 7,556 people 75.8 top 1.0% A+ Strongest: hazard risk A+ , schools A · lowest: health B+ 7 Fox Point Milwaukee County · 6,583 people 75.2 top 1.3% A+ Strongest: jobs & income A+ , schools A+ · lowest: cost of living D 8 Combined Locks Outagamie County · 3,626 people 74.8 top 1.6% A+ Strongest: hazard risk A+ , schools A · lowest: walkability C+ 11 Brillion Calumet County · 3,327 people 74.0 top 2.1% A+ Strongest: hazard risk A+ , safety A · lowest: health B− 13 Elm Grove Waukesha County · 6,354 people 73.4 top 2.6% A+ Strongest: jobs & income A+ , schools A · lowest: cost of living D 14 Hartford Washington County · 3,359 people 73.4 top 2.7% A+ Strongest: hazard risk A+ , jobs & income A · lowest: walkability C+ 15 Oostburg Sheboygan County · 3,056 people 73.2 top 2.8% A+ Strongest: hazard risk A , schools A · lowest: cost of living B− 16 Howards Grove Sheboygan County · 3,190 people 72.8 top 3.2% A+ Strongest: schools A− , jobs & income A− · lowest: walkability B 18 Bayside Milwaukee County · 4,331 people 72.6 top 3.4% A+ Strongest: schools A+ , jobs & income A+ · lowest: cost of living D 19 Mineral Point Iowa County · 2,555 people 72.4 top 3.5% A+ Strongest: hazard risk A , safety A− · lowest: schools B+ 22 Addison Washington County · 3,416 people 71.8 top 4.3% A+ Strongest: hazard risk A , schools A · lowest: walkability C− 24 Kewaunee Kewaunee County · 2,793 people 71.3 top 4.8% A+ Strongest: hazard risk A+ , cost of living A · lowest: schools C+ 25 Prescott Pierce County · 4,581 people 71.3 top 4.8% A+ Strongest: schools A , health A− · lowest: cost of living C+ 26 Freedom Outagamie County · 6,354 people 71.1 top 5.2% A Strongest: jobs & income A+ , hazard risk A · lowest: walkability C+ 28 Chilton Calumet County · 4,183 people 70.8 top 5.5% A Strongest: hazard risk A , cost of living A− · lowest: health B− 29 Baldwin St. Croix County · 4,347 people 70.8 top 5.6% A Strongest: schools A− , health A− · lowest: walkability C+ 31 Bristol Kenosha County · 5,300 people 70.6 top 6.0% A Strongest: hazard risk A+ , jobs & income A · lowest: cost of living C 32 Jackson Washington County · 8,322 people 69.9 top 6.9% A Strongest: safety A+ , jobs & income A · lowest: walkability C− 33 Springfield Dane County · 2,800 people 69.9 top 6.9% A Strongest: jobs & income A+ , health A · lowest: cost of living C 35 Thiensville Ozaukee County · 3,267 people 69.7 top 7.3% A Strongest: jobs & income A+ , schools A+ · lowest: cost of living C− 37 Mosinee Marathon County · 4,529 people 69.5 top 7.5% A Strongest: cost of living A− , schools B+ · lowest: hazard risk B− 38 Center Outagamie County · 3,706 people 69.5 top 7.5% A Strongest: jobs & income A+ , hazard risk A · lowest: walkability C− 39 Wales Waukesha County · 2,885 people 69.5 top 7.6% A Strongest: health A , schools A · lowest: cost of living C 41 Pulaski Brown County · 4,048 people 69.2 top 8.0% A Strongest: hazard risk A+ , safety A · lowest: walkability B− 42 Ellsworth Pierce County · 3,336 people 69.2 top 8.0% A Strongest: cost of living A− , jobs & income B+ · lowest: walkability C 44 Somerset St. Croix County · 3,408 people 69.1 top 8.2% A Strongest: safety A , health A− · lowest: cost of living B− 45 Milton Rock County · 6,024 people 69.1 top 8.2% A Strongest: safety A , jobs & income A · lowest: walkability B− 47 Luxemburg Kewaunee County · 2,784 people 69.1 top 8.3% A Strongest: hazard risk A+ , schools A · lowest: cost of living B− 48 Slinger Washington County · 6,495 people 69.0 top 8.4% A Strongest: hazard risk A , schools A · lowest: cost of living C+ 49 Burke Dane County · 3,089 people 69.0 top 8.5% A Strongest: hazard risk A , walkability A · lowest: cost of living C+ 50 Kronenwetter Marathon County · 8,413 people 68.2 top 9.7% A Strongest: safety A , jobs & income A · lowest: walkability C− 53 Hortonville Outagamie County · 3,340 people 68.1 top 10.0% A Strongest: jobs & income A , schools A− · lowest: walkability C+ 54 Hales Corners Milwaukee County · 7,740 people 68.0 top 10.1% A Strongest: hazard risk A+ , jobs & income A · lowest: cost of living C− 55 Amery Polk County · 2,927 people 68.0 top 10.1% A Strongest: walkability A , hazard risk A− · lowest: cost of living C+ 56 Ixonia Jefferson County · 5,083 people 68.0 top 10.2% A Strongest: jobs & income A , hazard risk A− · lowest: walkability B− 57 Grafton Ozaukee County · 4,343 people 67.8 top 10.5% A Strongest: jobs & income A , hazard risk A · lowest: walkability C− 58 Poynette Columbia County · 2,924 people 67.7 top 10.8% A Strongest: jobs & income A , schools A− · lowest: hazard risk D 59 Cross Plains Dane County · 4,182 people 67.6 top 11.0% A Strongest: jobs & income A+ , schools A · lowest: cost of living C− 60 Ottawa Waukesha County · 3,642 people 67.6 top 11.0% A Strongest: jobs & income A+ , schools A · lowest: walkability D 61 Sherwood Calumet County · 3,311 people 67.6 top 11.1% A Strongest: jobs & income A , health A · lowest: walkability C− 64 Wrightstown Brown County · 4,169 people 67.4 top 11.5% A Strongest: jobs & income A+ , schools A · lowest: cost of living C− 65 Belleville Dane County · 2,705 people 67.3 top 11.7% A Strongest: jobs & income A , hazard risk A · lowest: walkability C− 66 Pleasant Springs Dane County · 2,968 people 67.2 top 12.0% A Strongest: jobs & income A+ , health A− · lowest: cost of living C+ 67 Oak Grove Pierce County · 2,561 people 67.1 top 12.1% A Strongest: jobs & income A , schools A · lowest: walkability C 69 Pewaukee Waukesha County · 8,216 people 66.9 top 12.5% A Strongest: hazard risk A , health A · lowest: cost of living C− 70 Polk Washington County · 4,041 people 66.8 top 12.8% A Strongest: schools A , jobs & income A · lowest: walkability C− 71 Merton Waukesha County · 3,676 people 66.8 top 12.8% A Strongest: jobs & income A+ , schools A+ · lowest: cost of living C− 72 Somerset St. Croix County · 4,536 people 66.8 top 12.8% A Strongest: jobs & income A+ , health A− · lowest: cost of living C 74 Westport Dane County · 4,249 people 66.6 top 13.1% A Strongest: health A , jobs & income A · lowest: cost of living C 75 Peshtigo Marinette County · 3,423 people 66.5 top 13.4% A Strongest: safety A , cost of living A · lowest: schools C 76 Pittsfield Brown County · 2,838 people 66.4 top 13.6% A Strongest: hazard risk A+ , jobs & income A · lowest: walkability C 77 Summit Waukesha County · 5,323 people 66.4 top 13.7% A Strongest: jobs & income A+ , schools A · lowest: cost of living C− 78 Dousman Waukesha County · 2,665 people 66.2 top 14.0% A Strongest: jobs & income A , schools A · lowest: cost of living C− 79 Belgium Ozaukee County · 2,540 people 66.2 top 14.0% A Strongest: hazard risk A , schools A · lowest: walkability C− 80 Seymour Outagamie County · 3,628 people 66.1 top 14.2% A Strongest: hazard risk A , cost of living A · lowest: schools C− 81 North Hudson St. Croix County · 3,803 people 66.1 top 14.4% A Strongest: jobs & income A , schools A · lowest: walkability D 82 Hudson St. Croix County · 8,736 people 66.0 top 14.4% A Strongest: jobs & income A+ , schools A · lowest: cost of living C 83 Ripon Fond du Lac County · 7,738 people 65.9 top 14.6% A Strongest: hazard risk A , schools A− · lowest: jobs & income C+ 84 Jackson Washington County · 3,950 people 65.9 top 14.8% A Strongest: jobs & income A+ , hazard risk A · lowest: walkability C− 85 Geneva Walworth County · 5,443 people 65.7 top 15.1% A− Strongest: safety A+ , jobs & income A · lowest: cost of living C− 86 Cottage Grove Dane County · 8,930 people 65.7 top 15.1% A− Strongest: jobs & income A+ , health A · lowest: cost of living D 88 Star Prairie St. Croix County · 3,771 people 65.7 top 15.2% A− Strongest: jobs & income A , schools A− · lowest: walkability D 89 Lake Mills Jefferson County · 6,655 people 65.5 top 15.6% A− Strongest: jobs & income A , hazard risk A · lowest: cost of living C 90 Middleton Dane County · 6,833 people 65.5 top 15.7% A− Strongest: jobs & income A+ , health A+ · lowest: cost of living D 91 Kewaskum Washington County · 4,561 people 65.3 top 15.9% A− Strongest: schools A , safety A− · lowest: walkability C+ 92 Mukwonago Waukesha County · 8,544 people 65.3 top 15.9% A− Strongest: schools A , jobs & income A− · lowest: cost of living C 94 Merton Waukesha County · 8,319 people 65.1 top 16.4% A− Strongest: jobs & income A+ , schools A+ · lowest: cost of living D 95 Rothschild Marathon County · 5,627 people 65.1 top 16.5% A− Strongest: jobs & income A− , cost of living B+ · lowest: walkability C 96 Bristol Dane County · 4,347 people 65.1 top 16.5% A− Strongest: jobs & income A+ , health A · lowest: cost of living C− 99 Fennimore Grant County · 2,775 people 64.8 top 17.2% A− Strongest: safety A , hazard risk A · lowest: health C 100 Columbus Columbia County · 5,400 people 64.8 top 17.2% A− Strongest: safety A− , health A− · lowest: hazard risk C− 102 Union Grove Racine County · 5,370 people 64.7 top 17.4% A− Strongest: hazard risk A+ , jobs & income A+ · lowest: walkability C 103 Plymouth Sheboygan County · 8,821 people 64.7 top 17.5% A− Strongest: hazard risk A , safety A− · lowest: jobs & income B− 104 Chase Oconto County · 3,373 people 64.6 top 17.7% A− Strongest: jobs & income A , hazard risk A− · lowest: walkability D− 105 Cedarburg Ozaukee County · 6,169 people 64.6 top 17.7% A− Strongest: schools A+ , health A · lowest: cost of living D 107 Buchanan Outagamie County · 6,793 people 64.4 top 18.1% A− Strongest: hazard risk A+ , schools A− · lowest: cost of living C+ 109 Paddock Lake Kenosha County · 2,974 people 64.2 top 18.6% A− Strongest: hazard risk A+ , jobs & income A · lowest: walkability C+ 111 East Troy Walworth County · 4,988 people 64.2 top 18.7% A− Strongest: safety A , hazard risk A− · lowest: cost of living D 112 Maine Marathon County · 2,621 people 64.1 top 19.0% A− Strongest: jobs & income A , hazard risk A · lowest: schools C+ 114 Delafield Waukesha County · 7,314 people 64.0 top 19.2% A− Strongest: schools A , health A · lowest: cost of living D 117 Viroqua Vernon County · 4,435 people 63.8 top 19.5% A− Strongest: hazard risk A , walkability A · lowest: safety B− 118 West Salem La Crosse County · 5,288 people 63.8 top 19.5% A− Strongest: schools A− , hazard risk A− · lowest: cost of living C+ 121 Rochester Racine County · 3,786 people 63.5 top 20.3% A− Strongest: jobs & income A+ , schools B+ · lowest: walkability C− 122 Little Suamico Oconto County · 5,794 people 63.4 top 20.4% A− Strongest: jobs & income A , hazard risk A− · lowest: walkability D 123 Mayville Dodge County · 5,184 people 63.4 top 20.5% A− Strongest: hazard risk A− , safety A− · lowest: walkability C+ 124 Lima Sheboygan County · 2,920 people 63.3 top 20.7% A− Strongest: jobs & income A , hazard risk B+ · lowest: walkability C 125 Lawrence Brown County · 6,937 people 63.2 top 21.0% A− Strongest: hazard risk A+ , jobs & income A+ · lowest: walkability C− 127 Ledgeview Brown County · 9,642 people 63.0 top 21.4% A− Strongest: jobs & income A+ , schools A · lowest: cost of living C 128 Denmark Brown County · 2,875 people 63.0 top 21.5% A− Strongest: hazard risk A+ , jobs & income B+ · lowest: walkability C+ 130 Eagle Waukesha County · 3,536 people 62.9 top 21.6% A− Strongest: jobs & income A , schools A · lowest: walkability C− 131 Deerfield Dane County · 2,619 people 62.9 top 21.8% A− Strongest: jobs & income A , hazard risk A · lowest: walkability C 132 Ellington Outagamie County · 3,307 people 62.9 top 21.8% A− Strongest: jobs & income A , schools A− · lowest: walkability D− 134 Sheboygan Falls Sheboygan County · 8,687 people 62.8 top 22.0% A− Strongest: hazard risk A− , safety B+ · lowest: schools B− 136 Holland La Crosse County · 4,512 people 62.4 top 22.9% A− Strongest: jobs & income A , health A− · lowest: walkability C 137 Juneau Dodge County · 2,706 people 62.3 top 23.3% A− Strongest: hazard risk A , safety A · lowest: health C+ 138 Sugar Creek Walworth County · 3,888 people 62.1 top 23.8% A− Strongest: jobs & income A , hazard risk B+ · lowest: schools B− 140 Clayton Winnebago County · 5,303 people 61.9 top 24.3% A− Strongest: jobs & income A+ , schools A− · lowest: cost of living C 142 Farmington Washington County · 3,586 people 61.8 top 24.6% A− Strongest: jobs & income A+ , schools A · lowest: walkability D− 143 Dover Racine County · 4,202 people 61.8 top 24.6% A− Strongest: hazard risk A , jobs & income A · lowest: walkability C+ 144 Rice Lake Barron County · 2,897 people 61.6 top 25.2% B+ Strongest: hazard risk A , jobs & income A− · lowest: health C+ 145 Oconomowoc Waukesha County · 8,849 people 61.4 top 25.7% B+ Strongest: jobs & income A+ , schools A · lowest: cost of living D 146 Brookfield Waukesha County · 6,515 people 61.3 top 26.1% B+ Strongest: hazard risk A , health A · lowest: cost of living D 147 Neenah Winnebago County · 3,673 people 61.3 top 26.1% B+ Strongest: jobs & income A , schools A− · lowest: walkability C 148 Trenton Washington County · 4,721 people 61.3 top 26.2% B+ Strongest: jobs & income A+ , hazard risk A · lowest: walkability C− 150 Ashippun Dodge County · 2,666 people 61.0 top 26.8% B+ Strongest: jobs & income A , hazard risk A · lowest: walkability C− 151 Lodi Columbia County · 3,190 people 61.0 top 26.8% B+ Strongest: health A , jobs & income A− · lowest: hazard risk D 152 Troy St. Croix County · 5,686 people 61.0 top 27.0% B+ Strongest: jobs & income A , schools A · lowest: walkability D 153 Randall Kenosha County · 3,276 people 60.8 top 27.4% B+ Strongest: jobs & income A , hazard risk A− · lowest: walkability C− 155 Edgerton Rock County · 6,121 people 60.8 top 27.4% B+ Strongest: safety A+ , walkability B+ · lowest: hazard risk C− 156 Stockton Portage County · 3,019 people 60.8 top 27.4% B+ Strongest: hazard risk A , jobs & income A− · lowest: walkability C− 158 Hammond St. Croix County · 2,732 people 60.6 top 28.0% B+ Strongest: jobs & income A+ , hazard risk A− · lowest: walkability C− 159 Saukville Ozaukee County · 4,554 people 60.5 top 28.1% B+ Strongest: schools A , hazard risk A− · lowest: cost of living C 160 West Bend Washington County · 4,401 people 60.5 top 28.3% B+ Strongest: jobs & income A+ , hazard risk A · lowest: walkability D 161 Wheaton Chippewa County · 2,785 people 60.4 top 28.4% B+ Strongest: jobs & income A− , hazard risk B+ · lowest: walkability B− 162 Yorkville Racine County · 3,253 people 60.4 top 28.4% B+ Strongest: hazard risk A+ , jobs & income A− · lowest: cost of living C− 163 Linn Walworth County · 2,707 people 60.4 top 28.5% B+ Strongest: hazard risk A , jobs & income A · lowest: cost of living C− 164 Washington Eau Claire County · 7,478 people 60.1 top 29.2% B+ Strongest: jobs & income A , health A− · lowest: walkability C+ 166 Genesee Waukesha County · 7,235 people 60.0 top 29.4% B+ Strongest: jobs & income A+ , health A− · lowest: cost of living C 167 Oregon Dane County · 2,994 people 59.9 top 29.6% B+ Strongest: jobs & income A+ , hazard risk A · lowest: walkability D 169 Dale Outagamie County · 2,902 people 59.9 top 29.6% B+ Strongest: jobs & income A , schools B+ · lowest: walkability D 170 St. Joseph St. Croix County · 4,408 people 59.7 top 30.0% B+ Strongest: jobs & income A+ , schools A · lowest: cost of living D 171 Oneida Outagamie County · 4,568 people 59.5 top 30.6% B+ Strongest: hazard risk A , cost of living A− · lowest: walkability C− 172 Plymouth Sheboygan County · 3,038 people 59.4 top 30.8% B+ Strongest: hazard risk A , jobs & income A− · lowest: walkability D 173 Dayton Waupaca County · 2,608 people 59.3 top 31.2% B+ Strongest: hazard risk A− , jobs & income B+ · lowest: walkability C− 174 New London Waupaca County · 7,726 people 59.2 top 31.4% B+ Strongest: safety A , walkability A− · lowest: health C 175 Grand Rapids Wood County · 7,622 people 59.2 top 31.6% B+ Strongest: safety A , hazard risk B+ · lowest: walkability D 178 Stanley Chippewa County · 3,876 people 58.8 top 32.5% B+ Strongest: cost of living A , walkability A · lowest: jobs & income D 179 Arbor Vitae Vilas County · 3,503 people 58.7 top 32.7% B+ Strongest: hazard risk A , walkability B+ · lowest: jobs & income B− 180 Barton Washington County · 2,769 people 58.7 top 32.7% B+ Strongest: hazard risk A , jobs & income A · lowest: walkability D 181 Hull Portage County · 5,239 people 58.6 top 32.8% B+ Strongest: jobs & income A , health A− · lowest: walkability C− 182 Sturgeon Bay Door County · 9,917 people 58.6 top 32.9% B+ Strongest: hazard risk A+ , walkability A− · lowest: cost of living C 183 Onalaska La Crosse County · 5,809 people 58.5 top 33.2% B+ Strongest: jobs & income A , health A− · lowest: walkability C− 185 Omro Winnebago County · 3,639 people 58.3 top 33.6% B+ Strongest: safety A− , jobs & income B · lowest: hazard risk C+ 186 East Troy Walworth County · 4,002 people 58.3 top 33.8% B+ Strongest: jobs & income A+ , schools B+ · lowest: walkability C− 187 Williams Bay Walworth County · 2,935 people 58.2 top 33.9% B+ Strongest: hazard risk A , jobs & income B+ · lowest: cost of living C+ 188 Raymond Racine County · 4,006 people 58.2 top 34.0% B+ Strongest: jobs & income A+ , hazard risk A+ · lowest: walkability C− 189 Menomonie Dunn County · 3,514 people 58.2 top 34.1% B+ Strongest: jobs & income A , hazard risk B+ · lowest: walkability C 190 Marshall Dane County · 3,696 people 58.2 top 34.1% B+ Strongest: safety A , hazard risk A− · lowest: walkability C− 192 Evansville Rock County · 5,837 people 58.1 top 34.5% B+ Strongest: hazard risk A , jobs & income A− · lowest: cost of living C 193 Burlington Racine County · 6,403 people 58.0 top 34.6% B+ Strongest: jobs & income A− , hazard risk B+ · lowest: walkability C 195 Union Eau Claire County · 2,556 people 57.9 top 34.9% B+ Strongest: jobs & income A , health B+ · lowest: walkability C 196 Alden Polk County · 3,019 people 57.9 top 35.1% B Strongest: schools A− , jobs & income B+ · lowest: cost of living C 198 Harmony Rock County · 2,608 people 57.6 top 35.9% B Strongest: jobs & income A , schools A− · lowest: cost of living C 199 Waterford Racine County · 6,025 people 57.5 top 36.1% B Strongest: jobs & income A , schools A · lowest: cost of living D 202 Milton Rock County · 3,129 people 57.0 top 37.2% B Strongest: jobs & income A+ , schools A− · lowest: cost of living C− 203 Beaver Dam Dodge County · 4,105 people 57.0 top 37.2% B Strongest: hazard risk A , jobs & income B+ · lowest: schools C+ 204 Sevastopol Door County · 2,835 people 57.0 top 37.2% B Strongest: schools A+ , hazard risk A · lowest: cost of living C− 205 Bloomer Chippewa County · 3,634 people 57.0 top 37.3% B Strongest: hazard risk B+ , cost of living B · lowest: health B− 206 Twin Lakes Kenosha County · 6,338 people 57.0 top 37.4% B Strongest: hazard risk A− , jobs & income B+ · lowest: walkability C 207 Norway Racine County · 7,856 people 57.0 top 37.4% B Strongest: jobs & income A , schools A− · lowest: cost of living C 209 Fulton Rock County · 3,715 people 56.8 top 37.8% B Strongest: jobs & income A , schools B+ · lowest: hazard risk C− 211 Farmington Waupaca County · 3,501 people 56.6 top 38.4% B Strongest: hazard risk A , jobs & income B+ · lowest: walkability D 213 Delavan Walworth County · 5,210 people 56.4 top 39.0% B Strongest: hazard risk A , safety A− · lowest: walkability C− 215 Erin Washington County · 3,835 people 56.3 top 39.3% B Strongest: jobs & income A , hazard risk A− · lowest: walkability C− 216 Lomira Dodge County · 2,686 people 56.1 top 40.0% B Strongest: hazard risk A , walkability B+ · lowest: health C+ 217 Waterloo Jefferson County · 3,600 people 55.9 top 40.3% B Strongest: safety A , jobs & income B+ · lowest: schools C− 219 Berlin Green Lake County · 5,588 people 55.7 top 40.8% B Strongest: walkability A− , safety A− · lowest: health C− 220 Seymour Eau Claire County · 3,261 people 55.7 top 40.9% B Strongest: jobs & income A , health B+ · lowest: walkability C 222 Oconto Oconto County · 4,640 people 55.4 top 41.7% B Strongest: cost of living A , safety B+ · lowest: hazard risk C− 223 Dodgeville Iowa County · 5,076 people 55.1 top 42.2% B Strongest: hazard risk A+ , walkability B+ · lowest: safety C+ 224 Altoona Eau Claire County · 9,376 people 55.0 top 42.7% B Strongest: health A− , walkability B+ · lowest: cost of living C+ 225 Pacific Columbia County · 2,769 people 54.8 top 43.4% B Strongest: cost of living A , jobs & income A− · lowest: walkability D 226 Rhinelander Oneida County · 8,242 people 54.7 top 43.5% B Strongest: walkability A , cost of living A− · lowest: health C 227 McFarland Dane County · 9,145 people 54.5 top 44.0% B Strongest: health A , jobs & income A · lowest: schools D 229 Rib Mountain Marathon County · 7,280 people 54.2 top 44.9% B Strongest: health A− , jobs & income B+ · lowest: walkability C 230 Lake Delton Sauk County · 3,451 people 54.1 top 45.1% B− Strongest: cost of living B+ , hazard risk B · lowest: jobs & income C 231 Lake Geneva Walworth County · 8,818 people 53.9 top 45.5% B− Strongest: hazard risk A+ , walkability A− · lowest: cost of living D 232 Empire Fond du Lac County · 2,790 people 53.7 top 46.0% B− Strongest: jobs & income A+ , hazard risk A · lowest: walkability D 233 Wheatland Kenosha County · 3,337 people 53.7 top 46.1% B− Strongest: jobs & income A , schools B+ · lowest: cost of living C− 234 Monona Dane County · 8,664 people 53.7 top 46.2% B− Strongest: health A , hazard risk A · lowest: cost of living C− 236 Lyons Walworth County · 3,635 people 53.6 top 46.6% B− Strongest: hazard risk A− , schools B+ · lowest: walkability C− 237 Medford Taylor County · 2,506 people 53.5 top 46.7% B− Strongest: hazard risk A− , jobs & income A− · lowest: health C+ 238 Richmond St. Croix County · 4,276 people 53.5 top 46.7% B− Strongest: schools A− , health B+ · lowest: walkability C− 240 Lincoln Vilas County · 2,737 people 53.4 top 46.9% B− Strongest: walkability A− , jobs & income B− · lowest: schools B− 241 Osceola Polk County · 2,890 people 53.4 top 47.0% B− Strongest: hazard risk A− , schools A− · lowest: jobs & income C− 242 Waupaca Waupaca County · 6,352 people 53.3 top 47.4% B− Strongest: hazard risk A+ , cost of living B+ · lowest: jobs & income C 243 Taycheedah Fond du Lac County · 4,690 people 53.2 top 47.7% B− Strongest: jobs & income A , hazard risk A · lowest: walkability C− 244 Brodhead Green County · 3,214 people 53.2 top 47.8% B− Strongest: safety B+ , hazard risk B+ · lowest: jobs & income C 245 Bloomfield Walworth County · 6,369 people 53.1 top 48.0% B− Strongest: hazard risk A− , jobs & income B+ · lowest: walkability C− 246 Medford Taylor County · 4,589 people 53.1 top 48.1% B− Strongest: hazard risk A− , cost of living B+ · lowest: safety C+ 247 Horicon Dodge County · 3,917 people 53.1 top 48.2% B− Strongest: schools A− , hazard risk A− · lowest: health C 248 Koshkonong Jefferson County · 3,776 people 53.0 top 48.2% B− Strongest: jobs & income A , schools B− · lowest: walkability C− 249 Algoma Kewaunee County · 3,225 people 52.9 top 48.5% B− Strongest: hazard risk A+ , cost of living A · lowest: schools D 250 Johnson Creek Jefferson County · 3,435 people 52.9 top 48.6% B− Strongest: jobs & income A+ , health B+ · lowest: schools C 251 Dunn Dane County · 4,676 people 52.9 top 48.6% B− Strongest: jobs & income A+ , health A · lowest: walkability D 252 Beloit Rock County · 8,014 people 52.9 top 48.6% B− Strongest: jobs & income A− , schools B · lowest: health C− 253 Eagle Point Chippewa County · 3,267 people 52.7 top 48.9% B− Strongest: jobs & income A , health B− · lowest: walkability C− 255 Pelican Oneida County · 2,840 people 52.6 top 49.3% B− Strongest: cost of living A− , hazard risk B · lowest: schools C+ 259 Shelby La Crosse County · 4,668 people 52.4 top 50.0% B− Strongest: jobs & income A , walkability B · lowest: schools C 260 Merrill Lincoln County · 2,856 people 52.3 bottom 49.9% B− Strongest: cost of living A− , jobs & income B · lowest: walkability C− 262 Prairie du Sac Sauk County · 4,316 people 52.1 bottom 49.1% B− Strongest: jobs & income A , health B · lowest: cost of living C 265 Sheboygan Sheboygan County · 8,615 people 51.8 bottom 48.5% B− Strongest: hazard risk A , jobs & income A · lowest: schools C− 270 Sauk City Sauk County · 3,439 people 51.4 bottom 47.4% B− Strongest: walkability A− , jobs & income B+ · lowest: hazard risk C− 272 St. Francis Milwaukee County · 8,955 people 51.2 bottom 46.9% B− Strongest: hazard risk A+ , walkability A · lowest: schools C− 273 Lake Hallie Chippewa County · 7,396 people 51.1 bottom 46.7% B− Strongest: jobs & income B+ , hazard risk B · lowest: cost of living C+ 275 Cottage Grove Dane County · 3,677 people 50.9 bottom 46.2% B− Strongest: health A , hazard risk A− · lowest: cost of living D 276 Mukwa Waupaca County · 2,793 people 50.7 bottom 45.6% B− Strongest: jobs & income A− , schools B · lowest: walkability D 277 Sturtevant Racine County · 6,852 people 50.5 bottom 45.0% B− Strongest: hazard risk A+ , walkability A− · lowest: schools D 278 Fond du Lac Fond du Lac County · 3,780 people 50.4 bottom 44.7% C+ Strongest: jobs & income A , hazard risk A− · lowest: schools C 279 Algoma Winnebago County · 6,956 people 50.4 bottom 44.6% C+ Strongest: jobs & income A+ , health B+ · lowest: walkability D 280 Oconto Falls Oconto County · 3,012 people 50.1 bottom 43.9% C+ Strongest: hazard risk A , cost of living B+ · lowest: health C− 281 Wisconsin Dells Columbia County · 3,149 people 50.1 bottom 43.8% C+ Strongest: walkability A− , cost of living B · lowest: jobs & income C− 282 Arcadia Trempealeau County · 3,840 people 50.1 bottom 43.8% C+ Strongest: safety A+ , cost of living A− · lowest: jobs & income C− 283 Mondovi Buffalo County · 2,853 people 50.0 bottom 43.7% C+ Strongest: walkability B+ , schools B+ · lowest: health C 284 Pine Lake Oneida County · 2,733 people 50.0 bottom 43.7% C+ Strongest: jobs & income B , walkability B · lowest: schools C+ 285 Prairie du Chien Crawford County · 5,408 people 50.0 bottom 43.5% C+ Strongest: walkability A , schools B+ · lowest: health C− 286 Pleasant Valley Eau Claire County · 3,878 people 49.9 bottom 43.3% C+ Strongest: jobs & income A+ , health A− · lowest: cost of living D 287 Scott Brown County · 3,650 people 49.8 bottom 43.1% C+ Strongest: hazard risk A+ , jobs & income A · lowest: walkability D 288 Friendship Fond du Lac County · 2,774 people 49.7 bottom 42.7% C+ Strongest: jobs & income A , hazard risk B+ · lowest: walkability D 290 Delavan Walworth County · 9,228 people 49.4 bottom 42.0% C+ Strongest: hazard risk A , walkability B · lowest: schools C 291 Janesville Rock County · 3,699 people 49.2 bottom 41.3% C+ Strongest: jobs & income A+ , hazard risk A− · lowest: cost of living C− 293 Portage Columbia County · 9,956 people 49.0 bottom 40.8% C+ Strongest: walkability A− , cost of living B+ · lowest: hazard risk D 295 Tomahawk Lincoln County · 3,387 people 48.8 bottom 40.3% C+ Strongest: cost of living B+ , walkability B+ · lowest: health C− 296 Walworth Walworth County · 2,759 people 48.7 bottom 39.9% C+ Strongest: hazard risk A+ , safety A− · lowest: schools D 297 Newbold Oneida County · 2,869 people 48.6 bottom 39.8% C+ Strongest: jobs & income B+ , hazard risk B · lowest: walkability C 299 Stettin Marathon County · 2,593 people 48.6 bottom 39.6% C+ Strongest: jobs & income A , health B · lowest: walkability C− 300 Jefferson Jefferson County · 7,814 people 48.4 bottom 39.2% C+ Strongest: jobs & income B+ , walkability B · lowest: hazard risk C− 301 Minocqua Oneida County · 5,062 people 48.1 bottom 38.3% C+ Strongest: hazard risk A+ , jobs & income B− · lowest: walkability C+ 302 Oakland Jefferson County · 3,215 people 48.0 bottom 38.0% C+ Strongest: hazard risk B+ , schools B · lowest: walkability C 303 Lancaster Grant County · 4,031 people 47.6 bottom 36.9% C+ Strongest: hazard risk A+ , walkability A− · lowest: schools D− 304 Genoa City Walworth County · 2,866 people 47.5 bottom 36.6% C+ Strongest: hazard risk A− , jobs & income B+ · lowest: walkability C− 309 Rice Lake Barron County · 8,882 people 47.3 bottom 36.1% C+ Strongest: hazard risk A+ , schools B+ · lowest: safety C 310 Black River Falls Jackson County · 3,555 people 47.2 bottom 35.9% C+ Strongest: cost of living B+ , walkability B+ · lowest: schools C− 312 Lafayette Chippewa County · 6,430 people 46.9 bottom 35.1% C+ Strongest: jobs & income B+ , hazard risk B · lowest: walkability C− 314 Clintonville Waupaca County · 4,499 people 46.8 bottom 34.7% C Strongest: hazard risk A , walkability B+ · lowest: health C 315 Spooner Washburn County · 2,531 people 46.2 bottom 33.5% C Strongest: hazard risk A , walkability A · lowest: jobs & income D− 316 Mauston Juneau County · 4,133 people 46.0 bottom 32.9% C Strongest: walkability A , cost of living B · lowest: health D 317 Peshtigo Marinette County · 4,087 people 45.8 bottom 32.3% C Strongest: hazard risk B+ , jobs & income B+ · lowest: schools C− 319 Campbell La Crosse County · 4,092 people 45.6 bottom 31.7% C Strongest: walkability A− , safety A− · lowest: jobs & income C− 320 Barron Barron County · 3,634 people 45.3 bottom 31.1% C Strongest: hazard risk A , walkability B+ · lowest: jobs & income D 321 Shawano Shawano County · 9,693 people 45.3 bottom 31.0% C Strongest: walkability A− , cost of living B · lowest: health C− 322 Tainter Dunn County · 2,690 people 45.2 bottom 30.7% C Strongest: jobs & income B+ , schools B · lowest: walkability D− 323 Antigo Langlade County · 8,060 people 45.1 bottom 30.5% C Strongest: hazard risk A+ , cost of living A− · lowest: jobs & income D 324 Fox Lake Dodge County · 2,550 people 45.0 bottom 30.1% C Strongest: hazard risk A− , jobs & income A− · lowest: walkability D 325 Wilson Sheboygan County · 3,401 people 44.8 bottom 29.8% C Strongest: hazard risk A , jobs & income A · lowest: walkability D 326 New Lisbon Juneau County · 2,577 people 44.3 bottom 28.6% C Strongest: safety A , cost of living A− · lowest: schools D 329 Merrill Lincoln County · 9,389 people 43.5 bottom 26.6% C Strongest: walkability B+ , cost of living B+ · lowest: health C− 330 Saratoga Wood County · 5,141 people 43.0 bottom 25.5% C Strongest: cost of living B+ , jobs & income B− · lowest: walkability D 332 Rock Rock County · 2,988 people 42.9 bottom 25.2% C Strongest: hazard risk B+ , jobs & income B · lowest: walkability C 334 Ladysmith Rusk County · 3,172 people 42.5 bottom 24.2% C− Strongest: safety B+ , walkability B+ · lowest: jobs & income D− 335 Sparta Monroe County · 3,277 people 42.1 bottom 23.5% C− Strongest: jobs & income A− , cost of living B− · lowest: walkability D 337 Boscobel Grant County · 3,250 people 41.5 bottom 22.1% C− Strongest: cost of living A− , walkability A− · lowest: jobs & income D 338 Somers Kenosha County · 8,171 people 40.1 bottom 19.3% C− Strongest: hazard risk A+ , health B+ · lowest: cost of living C− 339 North Fond du Lac Fond du Lac County · 5,425 people 39.9 bottom 18.8% C− Strongest: hazard risk B , safety B · lowest: schools C 340 Sparta Monroe County · 9,974 people 39.8 bottom 18.6% C− Strongest: walkability A− , cost of living B · lowest: safety C− 341 Hayward Sawyer County · 3,928 people 39.3 bottom 17.8% C− Strongest: hazard risk B , cost of living B− · lowest: jobs & income C 344 Bass Lake Sawyer County · 2,896 people 37.9 bottom 15.0% C− Strongest: cost of living B , hazard risk B− · lowest: jobs & income D− 345 Richland Center Richland County · 5,020 people 37.5 bottom 14.5% D Strongest: cost of living B+ , walkability B · lowest: schools D 346 Tomah Monroe County · 9,600 people 37.1 bottom 13.7% D Strongest: walkability A− , cost of living B · lowest: jobs & income C− 347 Rome Adams County · 3,420 people 36.7 bottom 13.1% D Strongest: safety A− , jobs & income B · lowest: schools D− 348 Hayward Sawyer County · 2,614 people 36.6 bottom 12.9% D Strongest: walkability A , hazard risk B+ · lowest: jobs & income D 349 West Milwaukee Milwaukee County · 3,984 people 36.2 bottom 12.3% D Strongest: hazard risk A+ , walkability A · lowest: safety D− 351 Ashland Ashland County · 7,927 people 34.7 bottom 10.2% D Strongest: hazard risk A+ , walkability A · lowest: schools D 353 Brockway Jackson County · 2,991 people 32.6 bottom 7.6% D Strongest: cost of living B , hazard risk B · lowest: jobs & income D 354 Stephenson Marinette County · 3,654 people 32.3 bottom 7.2% D Strongest: cost of living B , hazard risk B− · lowest: jobs & income D 355 Wescott Shawano County · 3,287 people 28.3 bottom 3.5% D− Strongest: hazard risk C+ , health C · lowest: walkability C− 356 Lac du Flambeau Vilas County · 3,659 people 26.7 bottom 2.5% D− Strongest: hazard risk A+ , cost of living B− · lowest: jobs & income D− Method
How this list is made Each town’s overall grade blends seven livability grades: cost of living (weight 18), safety (18), schools (16), health (14), jobs & income (12), walkability (8) and hazard risk (4). A town needs 2,500+ residents and three of the first four. Letters are national, so an A here means the same as an A in any state; the list is the same towns in the same order, ranked within Wisconsin. Towns without their own FBI figures are graded on the rest and their page says why.
Data years: crime 2023–2025 (FBI), Census ACS 2020–2024, CDC PLACES 2025, state school tests. How grades work
Quick answers
Questions people ask What is the best small town in Wisconsin? Among 260 graded towns of 2,500 to 9,999 residents, Mount Horeb (Dane County) ranks first, with an A+; hazard risk (A+) and safety (A+) are its strongest grades; cost of living (C+) is its lowest. Kiel and New Holstein follow.
How are these towns ranked? By the overall grade, which blends seven livability grades from public data. The letter is national; the rank is within Wisconsin. The full method is on How grades work .
Why isn’t my town on this list? The list covers towns of 2,500 to 9,999 residents with an overall grade (260 in Wisconsin). 517 smaller places have subject grades only; 5 towns of 2,500+ lack enough data for a grade; Larger towns are on the best places to live list. Every town is on the Wisconsin page .
Go deeper More Wisconsin lists Every list ranks the same 2,500+ towns, so a town’s rank means the same thing on each.
All Wisconsin rankings → Other states
Best small towns in other states  #1
 #2
 #3