Home › Iowa › Rankings › Best small towns Orange City, #1 on this list · Zwemer Hall, Northwestern College · Photo: Tlandegent at en.wikipedia · Public domain Iowa rankings · 2026 Best small towns in Iowa Orange City ranks first of Iowa’s 99 graded small towns (2,500–9,999 residents), with an A+: walkability (A) and schools (A) are its strongest grades; jobs & income (B) is its lowest. 42 of the 99 (42%) grade A− or better nationally, against 25% of U.S. towns.
The overall grade, sorted: cost of living, safety, schools, health, jobs & income, walkability and hazard risk, from Census, FBI, state, CDC, EPA and FEMA data. How grades work
All towns Small towns (2,500–9,999) #1 Sioux County · 6,468 people A+ Strongest: walkability A , schools A · lowest: jobs & income B
A− Cost– SafetyA SchoolsA HealthB JobsA WalkA− Hazards
#3 Polk County · 2,671 people A+ Strongest: cost of living A , safety A · lowest: walkability B
A CostA SafetyB+ SchoolsB HealthA− JobsB WalkB+ Hazards
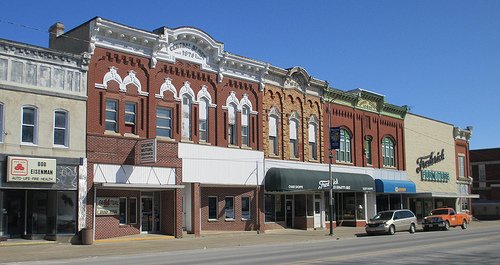
#4 Grundy County · 2,814 people A+ Strongest: schools A+ , safety A+ · lowest: health B
B+ CostA+ SafetyA+ SchoolsB HealthB JobsB WalkA− Hazards
Where they are: Two of the top 10 are in Polk County.
All 99 small towns Overall score, highest first. The score (0–100) blends the seven livability grades and sets the order; the letter places that score among every U.S. town of 2,500+, and A+ is the top 5%, so neighbors on the list often share a letter. Each town links to its page, where the grade sheet shows every subject. The rank is the town’s place among all 140 Iowa towns.
# Town Score Grade What drives it
1 Orange City Sioux County · 6,468 people 79.1 top 0.3% A+ Strongest: walkability A , schools A · lowest: jobs & income B 3 Mitchellville Polk County · 2,671 people 77.3 top 0.5% A+ Strongest: cost of living A , safety A · lowest: walkability B 4 Grundy Center Grundy County · 2,814 people 76.9 top 0.7% A+ Strongest: schools A+ , safety A+ · lowest: health B 5 Center Point Linn County · 2,572 people 76.7 top 0.7% A+ Strongest: jobs & income A , schools A− · lowest: walkability B− 6 Mount Vernon Linn County · 4,514 people 75.3 top 1.2% A+ Strongest: health A , schools A− · lowest: cost of living B 8 Polk City Polk County · 6,630 people 74.5 top 1.7% A+ Strongest: schools A+ , safety A · lowest: walkability C 9 Decorah Winneshiek County · 7,417 people 74.1 top 2.0% A+ Strongest: schools A+ , walkability A · lowest: hazard risk C+ 10 Eldridge Scott County · 6,954 people 74.1 top 2.0% A+ Strongest: jobs & income A+ , health A · lowest: walkability C+ 11 Solon Johnson County · 3,345 people 73.8 top 2.3% A+ Strongest: jobs & income A+ , schools A+ · lowest: hazard risk C− 12 Hudson Black Hawk County · 3,028 people 72.8 top 3.1% A+ Strongest: schools A , hazard risk A− · lowest: walkability C+ 13 Waukon Allamakee County · 3,849 people 72.8 top 3.2% A+ Strongest: safety A , cost of living A · lowest: health C+ 14 Forest City Winnebago County · 4,143 people 72.5 top 3.5% A+ Strongest: cost of living A , walkability A · lowest: hazard risk C+ 16 Osage Mitchell County · 3,552 people 71.9 top 4.1% A+ Strongest: cost of living A+ , safety A− · lowest: hazard risk C+ 17 Rock Valley Sioux County · 4,188 people 71.5 top 4.6% A+ Strongest: safety A+ , walkability A− · lowest: hazard risk C 18 Sergeant Bluff Woodbury County · 5,324 people 71.2 top 4.9% A+ Strongest: schools A , jobs & income A− · lowest: cost of living C+ 19 Adel Dallas County · 7,098 people 70.8 top 5.6% A Strongest: schools A , health A− · lowest: hazard risk C 20 Rock Rapids Lyon County · 2,733 people 70.8 top 5.6% A Strongest: schools A , cost of living A · lowest: hazard risk C 21 Dyersville Dubuque County · 4,574 people 70.6 top 5.9% A Strongest: safety A , schools A · lowest: hazard risk C− 22 Cresco Howard County · 3,925 people 70.4 top 6.1% A Strongest: cost of living A , hazard risk A · lowest: jobs & income C+ 24 Carlisle Warren County · 4,532 people 70.3 top 6.3% A Strongest: jobs & income A− , hazard risk A− · lowest: walkability B 26 Huxley Story County · 4,715 people 69.5 top 7.6% A Strongest: jobs & income A , health A · lowest: cost of living C− 27 Monticello Jones County · 4,104 people 69.4 top 7.7% A Strongest: cost of living A , safety A− · lowest: hazard risk C 28 Story City Story County · 3,382 people 68.5 top 9.2% A Strongest: schools A+ , health A− · lowest: walkability C+ 29 Sioux Center Sioux County · 8,864 people 68.1 top 10.0% A Strongest: safety A+ , walkability A · lowest: schools C− 32 Emmetsburg Palo Alto County · 3,684 people 66.9 top 12.6% A Strongest: cost of living A+ , walkability A · lowest: jobs & income C 33 Winterset Madison County · 5,520 people 66.3 top 13.8% A Strongest: hazard risk A , walkability A− · lowest: jobs & income B− 34 Garner Hancock County · 3,029 people 65.7 top 15.2% A− Strongest: schools A , cost of living A− · lowest: health C+ 35 West Branch Cedar County · 2,956 people 65.7 top 15.2% A− Strongest: jobs & income A , safety A− · lowest: hazard risk C 37 Williamsburg Iowa County · 3,408 people 65.2 top 16.4% A− Strongest: schools A , cost of living B+ · lowest: walkability C+ 38 Tipton Cedar County · 3,060 people 65.1 top 16.6% A− Strongest: cost of living A , walkability A− · lowest: health B− 39 Saylorville unincorporated, Polk County · 3,366 people 64.8 top 17.1% A− Strongest: hazard risk A , schools A− · lowest: walkability C− 42 Glenwood Mills County · 5,287 people 64.7 top 17.4% A− Strongest: schools A− , health B+ · lowest: hazard risk C− 43 Nevada Story County · 6,974 people 64.6 top 17.6% A− Strongest: health B+ , schools B+ · lowest: walkability B− 45 Bondurant Polk County · 9,647 people 64.2 top 18.6% A− Strongest: jobs & income A+ , health A · lowest: walkability C− 48 Vinton Benton County · 5,004 people 63.8 top 19.6% A− Strongest: walkability A− , schools A− · lowest: hazard risk D 50 Milford Dickinson County · 3,209 people 63.4 top 20.4% A− Strongest: schools A− , cost of living B+ · lowest: hazard risk C 51 Algona Kossuth County · 5,309 people 63.4 top 20.6% A− Strongest: walkability A , hazard risk B+ · lowest: schools B− 52 Independence Buchanan County · 6,312 people 63.1 top 21.1% A− Strongest: cost of living A− , walkability A− · lowest: hazard risk C− 53 Kalona Washington County · 2,811 people 62.4 top 23.0% A− Strongest: jobs & income A− , walkability A− · lowest: hazard risk C+ 54 Jesup Buchanan County · 2,557 people 62.3 top 23.3% A− Strongest: cost of living B+ , health B+ · lowest: walkability C+ 55 New Hampton Chickasaw County · 3,420 people 62.0 top 24.1% A− Strongest: cost of living A , schools A− · lowest: jobs & income C 56 Madrid Boone County · 2,820 people 62.0 top 24.1% A− Strongest: jobs & income A , health B+ · lowest: schools C+ 57 Le Claire Scott County · 4,741 people 61.5 top 25.6% B+ Strongest: schools A , jobs & income A · lowest: cost of living C− 60 Harlan Shelby County · 4,859 people 61.2 top 26.4% B+ Strongest: schools A , cost of living A− · lowest: jobs & income C 61 Asbury Dubuque County · 6,035 people 60.4 top 28.5% B+ Strongest: jobs & income A+ , safety A+ · lowest: walkability C− 63 Wilton Muscatine County · 2,892 people 59.7 top 30.3% B+ Strongest: jobs & income B+ , cost of living B+ · lowest: hazard risk B− 64 DeWitt Clinton County · 5,704 people 59.6 top 30.4% B+ Strongest: jobs & income A− , schools A− · lowest: safety C+ 66 Clear Lake Cerro Gordo County · 7,601 people 59.1 top 31.7% B+ Strongest: schools A− , walkability A− · lowest: safety C 67 Clarion Wright County · 2,758 people 58.9 top 32.2% B+ Strongest: cost of living A , safety B+ · lowest: schools C 68 Spirit Lake Dickinson County · 5,525 people 58.1 top 34.5% B+ Strongest: schools B+ , walkability B+ · lowest: safety C+ 69 Albia Monroe County · 3,599 people 58.0 top 34.6% B+ Strongest: walkability A− , schools A− · lowest: jobs & income C 70 Cherokee Cherokee County · 5,122 people 57.8 top 35.2% B Strongest: cost of living A , walkability A− · lowest: health D 71 Hawarden Sioux County · 2,665 people 57.4 top 36.2% B Strongest: cost of living A , jobs & income B · lowest: hazard risk C 73 Missouri Valley Harrison County · 2,616 people 57.2 top 36.8% B Strongest: cost of living A+ , walkability B+ · lowest: schools C− 74 Tiffin Johnson County · 7,156 people 57.0 top 37.5% B Strongest: health A , jobs & income A · lowest: hazard risk C− 75 Camanche Clinton County · 4,557 people 56.3 top 39.2% B Strongest: cost of living A− , safety B · lowest: hazard risk C 77 Sheldon O'Brien County · 5,575 people 55.7 top 41.0% B Strongest: hazard risk B+ , schools B+ · lowest: safety C+ 78 Estherville Emmet County · 5,807 people 54.5 top 44.0% B Strongest: cost of living A− , walkability A− · lowest: health C 79 Bloomfield Davis County · 2,785 people 54.3 top 44.5% B Strongest: cost of living A− , safety A− · lowest: schools C 81 Grinnell Poweshiek County · 9,430 people 54.0 top 45.3% B− Strongest: walkability A− , hazard risk A− · lowest: jobs & income C+ 82 Fairfax Linn County · 2,925 people 53.7 top 46.2% B− Strongest: jobs & income A , health A− · lowest: walkability C− 83 Mount Pleasant Henry County · 8,500 people 53.6 top 46.3% B− Strongest: hazard risk A− , cost of living B+ · lowest: schools C 84 Creston Union County · 7,335 people 53.3 top 47.5% B− Strongest: walkability A− , hazard risk B+ · lowest: jobs & income C− 86 Humboldt Humboldt County · 4,675 people 52.8 top 48.8% B− Strongest: cost of living A− , schools B+ · lowest: jobs & income C− 87 Hampton Franklin County · 4,264 people 52.3 bottom 49.8% B− Strongest: cost of living A , safety A− · lowest: jobs & income D 89 Robins Linn County · 3,366 people 51.3 bottom 46.9% B− Strongest: health A , hazard risk B+ · lowest: schools D 90 Denison Crawford County · 8,214 people 51.2 bottom 46.9% B− Strongest: cost of living A− , walkability A− · lowest: health D 91 Webster City Hamilton County · 7,815 people 50.9 bottom 46.1% B− Strongest: cost of living A , health B · lowest: jobs & income C 93 Perry Dallas County · 8,208 people 49.9 bottom 43.3% C+ Strongest: cost of living A , hazard risk B+ · lowest: schools C− 94 Jefferson Greene County · 4,150 people 48.9 bottom 40.7% C+ Strongest: cost of living B+ , hazard risk B · lowest: schools C− 95 Knoxville Marion County · 7,469 people 48.1 bottom 38.1% C+ Strongest: cost of living A− , hazard risk A− · lowest: safety C− 97 Anamosa Jones County · 5,901 people 47.6 bottom 36.9% C+ Strongest: safety B+ , walkability B+ · lowest: hazard risk C− 98 Manchester Delaware County · 5,357 people 47.4 bottom 36.5% C+ Strongest: cost of living A− , schools B+ · lowest: hazard risk D 99 Fairfield Jefferson County · 9,220 people 47.0 bottom 35.3% C+ Strongest: walkability A , hazard risk A · lowest: jobs & income D 100 Iowa Falls Hardin County · 5,013 people 46.4 bottom 33.8% C Strongest: walkability A− , cost of living B+ · lowest: jobs & income D 101 Chariton Lucas County · 4,347 people 46.3 bottom 33.8% C Strongest: cost of living A , hazard risk B+ · lowest: jobs & income D 102 Shenandoah Page County · 4,808 people 46.0 bottom 32.9% C Strongest: walkability A , cost of living B+ · lowest: jobs & income D 103 West Liberty Muscatine County · 3,717 people 46.0 bottom 32.9% C Strongest: safety B , jobs & income B · lowest: schools D 106 Sibley Osceola County · 2,762 people 44.5 bottom 29.0% C Strongest: cost of living A− , hazard risk B · lowest: jobs & income D 107 Hiawatha Linn County · 7,432 people 44.4 bottom 28.8% C Strongest: hazard risk A− , walkability B · lowest: schools D 109 Clarinda Page County · 5,273 people 43.9 bottom 27.5% C Strongest: cost of living A− , hazard risk B+ · lowest: jobs & income D 111 Charles City Floyd County · 7,013 people 42.5 bottom 24.4% C− Strongest: cost of living A , walkability C+ · lowest: hazard risk D 112 Eldora Hardin County · 2,593 people 42.5 bottom 24.2% C− Strongest: cost of living A , walkability A− · lowest: safety D− 114 Onawa Monona County · 2,821 people 42.2 bottom 23.6% C− Strongest: hazard risk B+ , cost of living B · lowest: health C− 115 Atlantic Cass County · 6,676 people 41.3 bottom 21.8% C− Strongest: walkability B+ , cost of living B · lowest: health C− 119 Windsor Heights Polk County · 5,059 people 39.4 bottom 17.9% C− Strongest: jobs & income A , health A− · lowest: schools D− 120 Washington Washington County · 7,261 people 39.1 bottom 17.4% C− Strongest: walkability A− , hazard risk A− · lowest: schools D 122 Eagle Grove Wright County · 3,653 people 38.7 bottom 16.5% C− Strongest: cost of living A− , walkability A− · lowest: schools D− 123 Centerville Appanoose County · 5,327 people 38.2 bottom 15.6% C− Strongest: walkability A− , hazard risk B+ · lowest: health D 124 Maquoketa Jackson County · 6,027 people 38.0 bottom 15.1% C− Strongest: cost of living A , walkability B · lowest: schools D 125 Fort Madison Lee County · 9,935 people 37.6 bottom 14.5% D Strongest: cost of living A− , walkability B+ · lowest: schools D 126 Carter Lake Pottawattamie County · 3,670 people 37.3 bottom 14.1% D Strongest: cost of living A− , walkability B+ · lowest: safety D 128 Oelwein Fayette County · 5,757 people 36.7 bottom 13.1% D Strongest: walkability A− , cost of living B+ · lowest: schools D− 130 West Burlington Des Moines County · 3,358 people 35.8 bottom 11.6% D Strongest: walkability A+ , hazard risk A− · lowest: safety D− 131 Tama Tama County · 3,011 people 34.9 bottom 10.5% D Strongest: cost of living A , hazard risk B · lowest: health D 133 Red Oak Montgomery County · 5,388 people 34.9 bottom 10.4% D Strongest: cost of living B+ , walkability B− · lowest: health C− 136 Osceola Clarke County · 5,679 people 33.7 bottom 9.0% D Strongest: hazard risk B+ , cost of living B · lowest: schools D 138 Keokuk Lee County · 9,510 people 32.3 bottom 7.2% D Strongest: walkability B+ , cost of living B · lowest: schools D 140 Evansdale Black Hawk County · 4,463 people 31.4 bottom 6.2% D Strongest: cost of living B , safety C+ · lowest: schools D− Method
How this list is made Each town’s overall grade blends seven livability grades: cost of living (weight 18), safety (18), schools (16), health (14), jobs & income (12), walkability (8) and hazard risk (4). A town needs 2,500+ residents and three of the first four. Letters are national, so an A here means the same as an A in any state; the list is the same towns in the same order, ranked within Iowa. Towns without their own FBI figures are graded on the rest and their page says why.
Data years: crime 2023–2025 (FBI), Census ACS 2020–2024, CDC PLACES 2025, state school tests. How grades work
Quick answers
Questions people ask What is the best small town in Iowa? Among 99 graded towns of 2,500 to 9,999 residents, Orange City (Sioux County) ranks first, with an A+; walkability (A) and schools (A) are its strongest grades; jobs & income (B) is its lowest. Mitchellville and Grundy Center follow.
How are these towns ranked? By the overall grade, which blends seven livability grades from public data. The letter is national; the rank is within Iowa. The full method is on How grades work .
Why isn’t my town on this list? The list covers towns of 2,500 to 9,999 residents with an overall grade (99 in Iowa). 136 smaller places have subject grades only; Larger towns are on the best places to live list. Every town is on the Iowa page .
Go deeper More Iowa lists Every list ranks the same 2,500+ towns, so a town’s rank means the same thing on each.
All Iowa rankings → Other states
Best small towns in other states 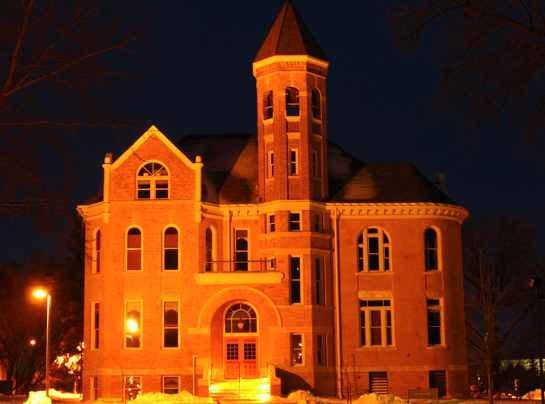 #1
 #3
 #4