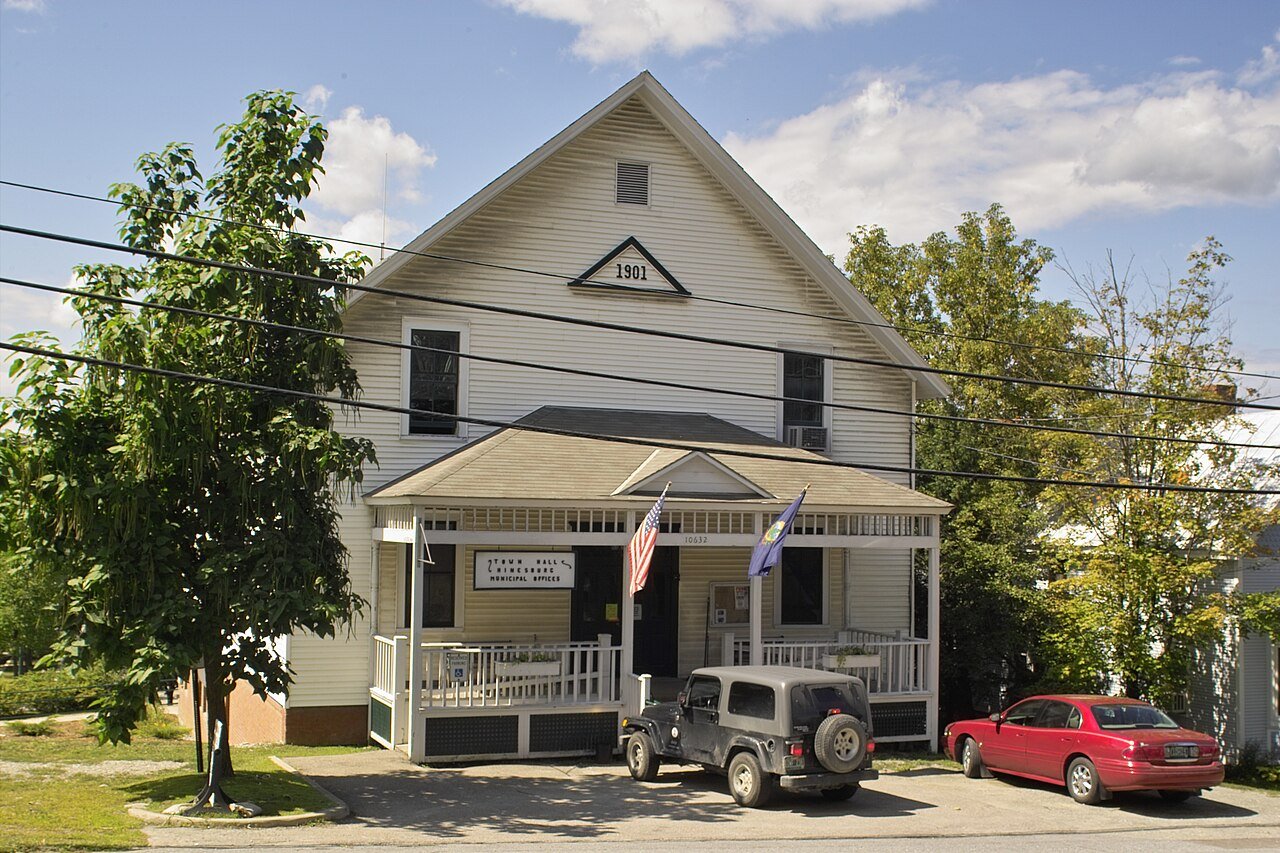
Norwich, #1 on this list · Photo: Ascended Dreamer · CC BY 4.0
Vermont rankings · 2026
Best small towns in Vermont
Norwich ranks first of Vermont’s 61 graded small towns (2,500–9,999 residents), with an A+: health (A+) and schools (A+) are its strongest grades; cost of living (D) is its lowest. 13 of the 61 (21%) grade A− or better nationally, against 25% of U.S. towns.
The overall grade, sorted: cost of living, safety, schools, health, jobs & income, walkability and hazard risk, from Census, FBI, state, CDC, EPA and FEMA data. How grades work
Where they are: Five of the top 10 are in Chittenden County.
All 61 small towns
Overall score, highest first. The score (0–100) blends the seven livability grades and sets the order; the letter places that score among every U.S. town of 2,500+, and A+ is the top 5%, so neighbors on the list often share a letter. Each town links to its page, where the grade sheet shows every subject. The rank is the town’s place among all 71 Vermont towns.
1NorwichWindsor County · 3,577 people74.3top 1.8%A+Strongest: health A+, schools A+·lowest: cost of living D
2JerichoChittenden County · 5,056 people70.6top 5.9%AStrongest: health A+, schools A·lowest: cost of living D
3HinesburgChittenden County · 4,675 people70.1top 6.6%AStrongest: health A+, schools A+·lowest: cost of living C−
4CharlotteChittenden County · 3,846 people68.2top 9.8%AStrongest: health A+, schools A+·lowest: cost of living D
6RichmondChittenden County · 4,103 people66.7top 13.0%AStrongest: health A+, schools A·lowest: hazard risk C−
7BristolAddison County · 3,759 people66.6top 13.1%AStrongest: safety A, health A·lowest: cost of living C−
8BradfordOrange County · 2,834 people66.3top 13.8%AStrongest: walkability A−, health A−·lowest: cost of living B
9ShelburneChittenden County · 8,133 people65.6top 15.4%A−Strongest: health A+, schools A+·lowest: cost of living D
10WaterburyWashington County · 5,434 people65.0top 16.9%A−Strongest: health A+, schools A·lowest: cost of living C−
11East MontpelierWashington County · 2,594 people64.8top 17.1%A−Strongest: health A+, hazard risk A·lowest: cost of living C−
12FairfaxFranklin County · 5,455 people64.6top 17.6%A−Strongest: health A, jobs & income A−·lowest: walkability B−
14RandolphOrange County · 4,958 people62.9top 21.7%A−Strongest: walkability A, health A−·lowest: cost of living C
15CastletonRutland County · 4,411 people62.8top 22.0%A−Strongest: safety A+, walkability A·lowest: cost of living C−
17WeathersfieldWindsor County · 2,809 people61.3top 26.0%B+Strongest: safety A, health A−·lowest: jobs & income C+
18ChesterWindsor County · 2,955 people61.0top 26.8%B+Strongest: safety A+, health A·lowest: schools C−
19VergennesAddison County · 2,559 people60.3top 28.8%B+Strongest: walkability A+, hazard risk A·lowest: cost of living C+
20RoyaltonWindsor County · 2,692 people60.1top 29.2%B+Strongest: health A−, walkability A−·lowest: schools C+
21WoodstockWindsor County · 2,970 people59.8top 29.9%B+Strongest: walkability A+, health A+·lowest: cost of living D−
22MiddleburyAddison County · 9,208 people59.3top 31.1%B+Strongest: walkability A+, health A·lowest: cost of living C−
23StoweLamoille County · 5,325 people59.0top 32.1%B+Strongest: health A+, schools A·lowest: cost of living D−
24UnderhillChittenden County · 3,071 people58.2top 34.0%B+Strongest: health A+, schools A·lowest: walkability D
25WillistonChittenden County · 9,975 people57.4top 36.4%BStrongest: health A+, schools A+·lowest: cost of living D
27MorristownLamoille County · 6,129 people56.9top 37.7%BStrongest: schools A, hazard risk A−·lowest: cost of living C−
29FerrisburghAddison County · 2,677 people55.9top 40.3%BStrongest: health A, hazard risk B+·lowest: cost of living C−
30MontpelierWashington County · 7,823 people55.6top 41.0%BStrongest: walkability A+, health A+·lowest: cost of living D
31GeorgiaFranklin County · 4,906 people55.6top 41.0%BStrongest: health A−, hazard risk A−·lowest: cost of living C
33ThetfordOrange County · 2,863 people54.9top 42.8%BStrongest: health A, schools B·lowest: walkability C
34NorthfieldWashington County · 5,873 people54.1top 45.1%B−Strongest: safety A, walkability A·lowest: schools D−
35HighgateFranklin County · 3,575 people53.8top 45.7%B−Strongest: hazard risk B+, schools B+·lowest: walkability D
36ManchesterBennington County · 4,413 people53.3top 47.3%B−Strongest: walkability A, health A−·lowest: cost of living D
37SwantonFranklin County · 6,894 people52.8top 48.9%B−Strongest: hazard risk B+, schools B+·lowest: jobs & income C+
38WindsorWindsor County · 3,464 people52.6top 49.4%B−Strongest: health A, safety B·lowest: jobs & income C
39EnosburghFranklin County · 2,780 people52.5top 49.7%B−Strongest: walkability B+, cost of living B·lowest: jobs & income C
40PittsfordRutland County · 2,859 people52.5top 49.8%B−Strongest: safety A+, hazard risk B+·lowest: schools D
41BartonOrleans County · 2,732 people51.0bottom 46.4%B−Strongest: walkability A−, health B·lowest: hazard risk C−
42PutneyWindham County · 2,575 people50.6bottom 45.2%B−Strongest: health A−, hazard risk B+·lowest: jobs & income C
44Fair HavenRutland County · 2,676 people48.4bottom 39.3%C+Strongest: hazard risk A, walkability A−·lowest: jobs & income C
45PoultneyRutland County · 2,962 people47.8bottom 37.2%C+Strongest: walkability B+, health B+·lowest: jobs & income C−
46LyndonCaledonia County · 5,628 people47.7bottom 37.0%C+Strongest: walkability A, health B+·lowest: schools C
47Hyde ParkLamoille County · 2,958 people47.5bottom 36.6%C+Strongest: hazard risk A−, health A−·lowest: schools D
48BerlinWashington County · 2,948 people46.3bottom 33.7%CStrongest: health A, schools B+·lowest: safety D−
49HardwickCaledonia County · 2,950 people46.2bottom 33.5%CStrongest: walkability A−, health B+·lowest: schools D−
50ShaftsburyBennington County · 3,558 people46.1bottom 33.2%CStrongest: health A−, hazard risk A−·lowest: schools D
51WestminsterWindham County · 2,932 people45.5bottom 31.3%CStrongest: health A−, walkability A−·lowest: schools C−
52HartlandWindsor County · 3,398 people44.2bottom 28.2%CStrongest: health A, hazard risk B+·lowest: cost of living D
53JohnsonLamoille County · 3,369 people43.1bottom 25.8%CStrongest: walkability A, health A−·lowest: schools D
54CambridgeLamoille County · 3,666 people42.8bottom 24.9%C−Strongest: health A, walkability A−·lowest: schools D
55NewportOrleans County · 2,583 people42.1bottom 23.5%C−Strongest: hazard risk A−, health B+·lowest: jobs & income C
56SpringfieldWindsor County · 8,881 people41.9bottom 23.1%C−Strongest: walkability A−, hazard risk B·lowest: schools D
57DerbyOrleans County · 4,456 people41.8bottom 22.8%C−Strongest: hazard risk B+, walkability B+·lowest: jobs & income C
58BrandonRutland County · 4,173 people39.9bottom 18.8%C−Strongest: hazard risk B, health B·lowest: schools D
59WilliamstownOrange County · 3,576 people39.2bottom 17.6%C−Strongest: health B+, jobs & income B+·lowest: schools D−
60St. JohnsburyCaledonia County · 7,354 people39.1bottom 17.3%C−Strongest: walkability A, hazard risk B·lowest: schools C−
61WinooskiChittenden County · 8,239 people38.6bottom 16.2%C−Strongest: walkability A+, health A·lowest: schools D−
62RockinghamWindham County · 4,697 people38.4bottom 15.8%C−Strongest: walkability A, health A−·lowest: schools C−
63RutlandRutland County · 3,869 people37.2bottom 13.9%DStrongest: hazard risk A+, health B+·lowest: cost of living D
64Bellows FallsWindham County · 2,706 people36.9bottom 13.3%DStrongest: walkability A, health B·lowest: jobs & income D
65St. AlbansFranklin County · 6,939 people36.4bottom 12.7%DStrongest: walkability A, hazard risk A·lowest: safety D−
67PownalBennington County · 3,219 people34.6bottom 10.1%DStrongest: health B+, hazard risk B−·lowest: schools D
69NewportOrleans County · 4,274 people33.8bottom 9.2%DStrongest: walkability A, hazard risk B+·lowest: jobs & income D−
71BarreWashington County · 8,214 people32.1bottom 7.0%DStrongest: walkability A, health B−·lowest: safety D
Method
How this list is made
Each town’s overall grade blends seven livability grades: cost of living (weight 18), safety (18), schools (16), health (14), jobs & income (12), walkability (8) and hazard risk (4). A town needs 2,500+ residents and three of the first four. Letters are national, so an A here means the same as an A in any state; the list is the same towns in the same order, ranked within Vermont. Towns without their own FBI figures are graded on the rest and their page says why.
Data years: crime 2023–2025 (FBI), Census ACS 2020–2024, CDC PLACES 2025, state school tests. How grades work
Quick answers
Questions people ask
What is the best small town in Vermont?
Among 61 graded towns of 2,500 to 9,999 residents, Norwich (Windsor County) ranks first, with an A+; health (A+) and schools (A+) are its strongest grades; cost of living (D) is its lowest. Jericho and Hinesburg follow.
How are these towns ranked?
By the overall grade, which blends seven livability grades from public data. The letter is national; the rank is within Vermont. The full method is on How grades work.
Why isn’t my town on this list?
The list covers towns of 2,500 to 9,999 residents with an overall grade (61 in Vermont). 101 smaller places have subject grades only; Larger towns are on the best places to live list. Every town is on the Vermont page.
Go deeper
More Vermont lists
Every list ranks the same 2,500+ towns, so a town’s rank means the same thing on each.
 #1
 #2
 #3