Guest, Sign inJoin
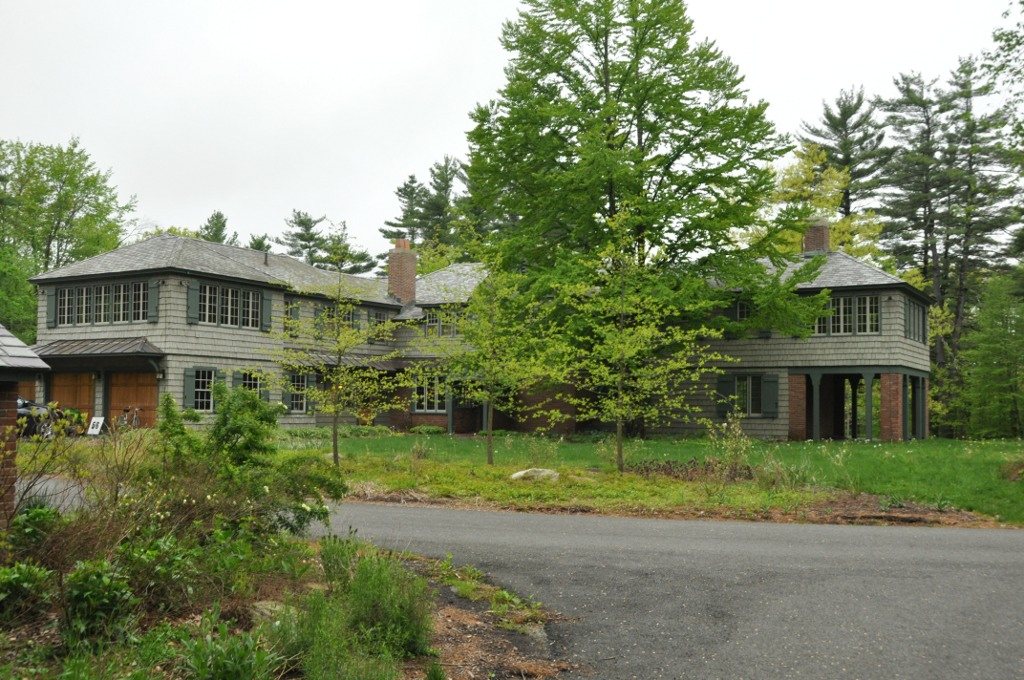
Nichols, Marion, Summer HomeHollis, #1 on this list · Nichols, Marion, Summer Home · Photo: User:Magicpiano · CC BY-SA 4.0
New Hampshire rankings · 2026

Best small towns in New Hampshire

Hollis ranks first of New Hampshire’s 97 graded small towns (2,500–9,999 residents), with an A+: jobs & income (A+) and safety (A+) are its strongest grades; walkability (C) is its lowest. 35 of the 97 (36%) grade A− or better nationally, against 25% of U.S. towns.

The overall grade, sorted: cost of living, safety, schools, health, jobs & income, walkability and hazard risk, from Census, FBI, state, CDC, EPA and FEMA data. How grades work

#1

Hollis

Hillsborough County · 8,819 people
A+

Strongest: jobs & income A+, safety A+·lowest: walkability C

CCostA+SafetyASchoolsAHealthA+JobsCWalkBHazards
#2

Mont Vernon

Hillsborough County · 2,698 people
A+

Strongest: safety A, jobs & income A·lowest: walkability C−

C+CostASafetyASchoolsAHealthAJobsC−WalkAHazards
#3

Candia

Rockingham County · 4,248 people
A+

Strongest: safety A+, health A−·lowest: walkability B−

BCostA+SafetyB+SchoolsA−HealthA−JobsB−WalkBHazards

Where they are: Five of the top 10 are in Rockingham County.

All 97 small towns

Overall score, highest first. The score (0–100) blends the seven livability grades and sets the order; the letter places that score among every U.S. town of 2,500+, and A+ is the top 5%, so neighbors on the list often share a letter. Each town links to its page, where the grade sheet shows every subject. The rank is the town’s place among all 125 New Hampshire towns.

97 towns ranked. Not here? See why a town may be missing.

#TownScoreGradeWhat drives it
1HollisHillsborough County · 8,819 people75.3top 1.2%A+Strongest: jobs & income A+, safety A+·lowest: walkability C
2Mont VernonHillsborough County · 2,698 people74.6top 1.6%A+Strongest: safety A, jobs & income A·lowest: walkability C−
3CandiaRockingham County · 4,248 people73.8top 2.3%A+Strongest: safety A+, health A−·lowest: walkability B−
4BrooklineHillsborough County · 5,858 people73.4top 2.7%A+Strongest: jobs & income A+, safety A+·lowest: cost of living C
6HopkintonMerrimack County · 6,120 people72.9top 3.1%A+Strongest: safety A+, health A·lowest: hazard risk C
7AtkinsonRockingham County · 7,397 people72.4top 3.5%A+Strongest: safety A+, health A·lowest: walkability C
8AuburnRockingham County · 6,336 people72.1top 3.9%A+Strongest: jobs & income A+, safety A+·lowest: cost of living C
9NorthwoodRockingham County · 4,757 people71.9top 4.1%A+Strongest: health A, safety A·lowest: walkability B−
11StrathamRockingham County · 7,735 people70.7top 5.8%AStrongest: health A+, safety A+·lowest: cost of living D
12New BostonHillsborough County · 6,276 people70.3top 6.3%AStrongest: safety A+, schools A·lowest: walkability D
13LeeStrafford County · 4,563 people70.2top 6.5%AStrongest: health A, safety A·lowest: cost of living C−
16BowMerrimack County · 8,415 people69.4top 7.7%AStrongest: health A+, safety A·lowest: cost of living C−
17RyeRockingham County · 5,689 people68.7top 8.9%AStrongest: health A+, safety A+·lowest: cost of living C−
18HampsteadRockingham County · 9,110 people68.7top 9.0%AStrongest: health A, safety A·lowest: cost of living C
19BrentwoodRockingham County · 4,923 people68.3top 9.6%AStrongest: health A, jobs & income A·lowest: cost of living D
20GreenlandRockingham County · 4,143 people68.1top 9.9%AStrongest: health A+, jobs & income A·lowest: cost of living D
22GilmantonBelknap County · 4,060 people67.6top 11.0%AStrongest: health A, safety A·lowest: walkability D
23DeerfieldRockingham County · 4,989 people67.3top 11.7%AStrongest: safety A+, health A·lowest: walkability C+
25GranthamSullivan County · 3,482 people66.8top 12.6%AStrongest: schools A+, safety A+·lowest: walkability D
26NottinghamRockingham County · 5,490 people66.3top 13.8%AStrongest: safety A+, health A·lowest: walkability C−
27PlainfieldSullivan County · 2,560 people65.8top 14.9%AStrongest: safety A, health A·lowest: cost of living D
29New LondonMerrimack County · 4,411 people65.7top 15.3%A−Strongest: health A+, hazard risk A−·lowest: cost of living D
30WarnerMerrimack County · 2,902 people65.6top 15.4%A−Strongest: safety A+, health A·lowest: hazard risk C−
31North HamptonRockingham County · 4,526 people65.5top 15.7%A−Strongest: jobs & income A+, health A·lowest: cost of living D
32LitchfieldHillsborough County · 8,704 people65.2top 16.3%A−Strongest: safety A+, jobs & income A·lowest: cost of living D
34HennikerMerrimack County · 6,256 people64.8top 17.3%A−Strongest: health A, walkability A−·lowest: cost of living C+
35DunbartonMerrimack County · 3,233 people64.4top 18.2%A−Strongest: safety A, health A·lowest: walkability C−
36PeterboroughHillsborough County · 6,499 people64.1top 19.0%A−Strongest: health A, safety A·lowest: hazard risk C−
37NewmarketRockingham County · 9,647 people63.9top 19.4%A−Strongest: health A, safety A·lowest: cost of living C−
38EpsomMerrimack County · 5,057 people63.8top 19.6%A−Strongest: health A, safety A−·lowest: hazard risk C−
41GilfordBelknap County · 7,898 people62.9top 21.7%A−Strongest: health A, jobs & income A−·lowest: walkability C−
42TuftonboroCarroll County · 2,678 people62.5top 22.6%A−Strongest: health A, safety A−·lowest: cost of living C
43PlaistowRockingham County · 7,848 people62.3top 23.1%A−Strongest: health A, jobs & income A−·lowest: cost of living C
44BarringtonStrafford County · 9,642 people62.1top 23.8%A−Strongest: safety A, health A·lowest: walkability C−
45ChesterRockingham County · 5,322 people61.9top 24.4%A−Strongest: safety A+, health A·lowest: cost of living C−
46NewtonRockingham County · 4,851 people61.5top 25.4%B+Strongest: safety A+, health A·lowest: walkability C−
49DanvilleRockingham County · 4,650 people61.0top 26.9%B+Strongest: safety A+, health A−·lowest: walkability D
51ThorntonGrafton County · 2,895 people60.3top 28.7%B+Strongest: safety A, health A·lowest: hazard risk D
52LoudonMerrimack County · 5,781 people60.0top 29.4%B+Strongest: safety A, jobs & income A−·lowest: hazard risk C−
54RindgeCheshire County · 6,502 people59.7top 30.3%B+Strongest: health A, safety A·lowest: cost of living C−
55MoultonboroughCarroll County · 5,293 people59.5top 30.6%B+Strongest: health A, safety A−·lowest: cost of living C−
56JaffreyCheshire County · 5,633 people59.1top 31.6%B+Strongest: health A, safety B·lowest: schools C+
57KingstonRockingham County · 6,288 people59.1top 31.7%B+Strongest: safety A, jobs & income A·lowest: cost of living C−
58New DurhamStrafford County · 2,890 people59.1top 31.7%B+Strongest: safety A, health A−·lowest: walkability D
59New IpswichHillsborough County · 5,467 people59.1top 31.8%B+Strongest: jobs & income A, health A−·lowest: schools C
61BethlehemGrafton County · 2,575 people58.6top 33.0%B+Strongest: health A, safety A−·lowest: jobs & income C
63WiltonHillsborough County · 4,015 people58.3top 33.7%B+Strongest: jobs & income A, health A·lowest: hazard risk C−
64SunapeeSullivan County · 3,442 people58.1top 34.4%B+Strongest: schools A−, safety A−·lowest: cost of living C−
65ChichesterMerrimack County · 2,834 people57.9top 34.9%B+Strongest: health A, jobs & income A−·lowest: cost of living D
66WolfeboroCarroll County · 6,637 people57.9top 35.1%BStrongest: health A−, safety A−·lowest: cost of living C−
67SandownRockingham County · 6,753 people57.7top 35.6%BStrongest: safety A+, health A−·lowest: walkability D
68AntrimHillsborough County · 2,757 people57.4top 36.3%BStrongest: health B+, safety B+·lowest: walkability C+
69RollinsfordStrafford County · 2,621 people57.3top 36.4%BStrongest: health A, safety A·lowest: cost of living C−
70FremontRockingham County · 4,923 people57.2top 36.7%BStrongest: safety A, jobs & income A·lowest: cost of living C−
71MeredithBelknap County · 6,854 people57.0top 37.3%BStrongest: health A−, walkability A−·lowest: cost of living C
72StraffordStrafford County · 4,338 people56.6top 38.5%BStrongest: safety A+, health A−·lowest: walkability C−
73SanborntonBelknap County · 3,038 people56.2top 39.5%BStrongest: safety A, health A·lowest: cost of living C
74WeareHillsborough County · 9,291 people56.1top 39.8%BStrongest: jobs & income A, health A·lowest: schools C−
76CamptonGrafton County · 3,436 people55.7top 40.9%BStrongest: health A, jobs & income B+·lowest: hazard risk D
77EnfieldGrafton County · 4,470 people55.5top 41.3%BStrongest: health A, safety A−·lowest: cost of living C−
78PlymouthGrafton County · 6,721 people55.3top 41.8%BStrongest: walkability A, health A·lowest: jobs & income C−
79MadisonCarroll County · 2,728 people55.3top 41.9%BStrongest: safety A, health A·lowest: schools C
80ChesterfieldCheshire County · 3,684 people54.4top 44.1%BStrongest: health A, safety A−·lowest: cost of living C
82TamworthCarroll County · 2,895 people52.5top 49.7%B−Strongest: health A, safety A·lowest: schools C−
83BoscawenMerrimack County · 4,255 people52.4top 50.0%B−Strongest: safety A, health A−·lowest: cost of living C
85AltonBelknap County · 6,036 people52.2bottom 49.5%B−Strongest: health A, safety A−·lowest: walkability C−
86NorthfieldMerrimack County · 5,081 people52.2bottom 49.4%B−Strongest: safety B+, health B+·lowest: walkability D
87EppingRockingham County · 7,973 people51.7bottom 48.2%B−Strongest: jobs & income A, health A−·lowest: cost of living C−
88AllenstownMerrimack County · 4,882 people50.9bottom 46.0%B−Strongest: safety B+, walkability B+·lowest: schools C−
89GorhamCoos County · 2,661 people50.8bottom 45.8%B−Strongest: health B+, walkability B+·lowest: hazard risk D
90BarnsteadBelknap County · 5,038 people50.7bottom 45.7%B−Strongest: health A−, safety A−·lowest: schools D
92PembrokeMerrimack County · 7,579 people50.0bottom 43.6%C+Strongest: safety A−, health B·lowest: walkability C−
93HillsboroughHillsborough County · 6,134 people49.4bottom 42.1%C+Strongest: safety B+, health B+·lowest: schools D
94WalpoleCheshire County · 3,706 people49.0bottom 41.0%C+Strongest: safety A, health B+·lowest: walkability C−
96CanaanGrafton County · 3,833 people48.2bottom 38.5%C+Strongest: safety B+, health B+·lowest: hazard risk D
97WakefieldCarroll County · 5,558 people47.6bottom 36.9%C+Strongest: safety A, health B+·lowest: schools D
99HaverhillGrafton County · 4,667 people47.3bottom 36.2%C+Strongest: health A−, safety B·lowest: schools C
100OssipeeCarroll County · 4,599 people47.3bottom 36.1%C+Strongest: health B+, schools B·lowest: cost of living D
101PittsfieldMerrimack County · 4,148 people46.9bottom 35.2%C+Strongest: safety A−, health B·lowest: schools C−
102FranklinMerrimack County · 8,839 people46.4bottom 34.0%CStrongest: health B+, safety B·lowest: schools D−
104TiltonBelknap County · 4,092 people45.8bottom 32.4%CStrongest: walkability A−, health B+·lowest: safety D
105LancasterCoos County · 3,218 people45.6bottom 31.7%CStrongest: safety A, walkability A−·lowest: hazard risk D
106BristolGrafton County · 3,251 people45.6bottom 31.7%CStrongest: health B+, walkability B+·lowest: hazard risk D
107BelmontBelknap County · 7,408 people45.5bottom 31.4%CStrongest: safety B, health B−·lowest: hazard risk C−
108BartlettCarroll County · 3,335 people44.5bottom 28.9%CStrongest: health A, safety B+·lowest: hazard risk D
110CharlestownSullivan County · 4,924 people43.3bottom 26.1%CStrongest: safety A, health B−·lowest: jobs & income C−
111FarmingtonStrafford County · 6,781 people43.1bottom 25.6%CStrongest: safety B, cost of living B·lowest: hazard risk C−
112MiltonStrafford County · 4,562 people43.0bottom 25.4%CStrongest: safety B, health B·lowest: schools D−
113LittletonGrafton County · 6,003 people41.7bottom 22.7%C−Strongest: walkability A, safety B−·lowest: hazard risk D
114SwanzeyCheshire County · 7,461 people41.1bottom 21.4%C−Strongest: health B+, safety B·lowest: schools C−
116NewportSullivan County · 6,417 people40.8bottom 20.5%C−Strongest: walkability B+, health B+·lowest: schools D
117WhitefieldCoos County · 2,535 people40.5bottom 20.0%C−Strongest: safety A+, health B−·lowest: cost of living D
118FitzwilliamCheshire County · 2,500 people38.5bottom 16.1%C−Strongest: health A−, jobs & income B+·lowest: schools C−
119SeabrookRockingham County · 8,430 people38.0bottom 15.1%C−Strongest: health B+, walkability B+·lowest: hazard risk C−
122HinsdaleCheshire County · 4,034 people36.3bottom 12.5%DStrongest: health B+, walkability B−·lowest: schools D
124BerlinCoos County · 9,502 people29.3bottom 4.1%D−Strongest: walkability B+, safety C+·lowest: jobs & income D
125WinchesterCheshire County · 4,281 people26.5bottom 2.3%D−Strongest: safety B−, health C+·lowest: schools D−
Method

How this list is made

Each town’s overall grade blends seven livability grades: cost of living (weight 18), safety (18), schools (16), health (14), jobs & income (12), walkability (8) and hazard risk (4). A town needs 2,500+ residents and three of the first four. Letters are national, so an A here means the same as an A in any state; the list is the same towns in the same order, ranked within New Hampshire. Towns without their own FBI figures are graded on the rest and their page says why.

Data years: crime 2023–2025 (FBI), Census ACS 2020–2024, CDC PLACES 2025, state school tests. How grades work

Quick answers

Questions people ask

What is the best small town in New Hampshire?

Among 97 graded towns of 2,500 to 9,999 residents, Hollis (Hillsborough County) ranks first, with an A+; jobs & income (A+) and safety (A+) are its strongest grades; walkability (C) is its lowest. Mont Vernon and Candia follow.

How are these towns ranked?

By the overall grade, which blends seven livability grades from public data. The letter is national; the rank is within New Hampshire. The full method is on How grades work.

Why isn’t my town on this list?

The list covers towns of 2,500 to 9,999 residents with an overall grade (97 in New Hampshire). 61 smaller places have subject grades only; Larger towns are on the best places to live list. Every town is on the New Hampshire page.

Go deeper

More New Hampshire lists

Every list ranks the same 2,500+ towns, so a town’s rank means the same thing on each.

All New Hampshire rankings →
Other states

Best small towns in other states