
FreedomWisconsinStNicholas, 2006
Freedom’s story
174 years in pictures
The archive holds 12 old photos and papers going back to 2004 and 3 maps from 1955 on.
- 1852Freedom is settled
Each edition grades its towns against each other only.
Freedom’s strongest is incomes (A+): the median household earns $122K. With an A overall, Freedom is better than 95% of U.S. towns and ranks 26th of 357 in Wisconsin. Homes run about $431K for a typical one, 5 times the Appleton metro’s $86K median household income. Add health to its strengths (A−): residents are healthier than nearly four fifths of U.S. towns on CDC estimates. The biggest park or preserve is VFW Memorial Park, at 40 acres. 30% of residents are under 18 in the town, above both the Wisconsin town median (21%) and the median of U.S. towns (22%). Its other grades sit near the middle: B for schools and C+ for walkability.
Figures: incomes, Census ACS, 2020–24 · health, CDC PLACES · home values, Zillow · schools, state test and graduation results · OpenStreetMap.
Where Freedom beats most towns.
Where Freedom’s working residents go each day. Line width shows the share.
Census LEHD 2023
Each subject compared with towns across the country (schools within Wisconsin), ordered by how far Freedom is from typical.
How TownRatings grades towns →
The archive holds 12 old photos and papers going back to 2004 and 3 maps from 1955 on.
Who provides power, water and the rest in Freedom, and how to reach them.
EPA SDWIS (Oct 9, 2026) · HIFLD + EIA-861 2025 · Census 2020 ZCTAs · NCES 2024–25 · registration: vote.gov, updated Nov 18, 2024.
Ordered by what stands out in Freedom.
Freedom owes part of its health edge to its incomes, has household incomes well above the Wisconsin norm and has added a third more jobs in ten years.
Freedom’s natural-hazard score from FEMA stands at 12 of 100. 50% of the town’s expected losses from natural hazards come from inland flooding, followed by cold waves at 26%. Expected storm and flood damage is lower than in 88% of U.S. communities.
FEMA National Risk Index · OpenFEMA
The Freedom Area School District runs its public schools. The largest public high school is Freedom High, with 510 students. Of its 5 schools, two are listed below, each with the reason.
| School | Level | Students | Letter |
|---|---|---|---|
| Freedom ElementaryLargest public elementary schoolGrades PK–5 | Grades PK–5 | 691 | A− |
| Freedom HighLargest public high schoolGrades 9–12 | Grades 9–12 | 510 | B− |
NCES · EDFacts · graded within WI on state tests and graduation
Against the 5,481 U.S. towns with household incomes like Freedom’s, it is healthier than 50%, a smaller edge than it has nationally: part of it comes with its incomes.
In Freedom, 31% of adults sleep under 7 hours, and 12% report frequent physical distress. Against the Wisconsin average, Freedom comes out ahead on 12 CDC measures out of 32, and behind on 1. For adults here, the share who binge drink is 22%.
| Freedom | Wisconsin towns | U.S. towns | |
|---|---|---|---|
| Binge drink (CDC PLACES) | 22% | 20% | 16% |
| Sleep under 7 hours (CDC PLACES) | 31% | 32% | 36% |
| Frequent physical distress (CDC PLACES) | 12% | 13% | 14% |
| Diabetes (CDC PLACES) | 9.6% | 11% | 12% |
| What stands out | Freedom | WI |
|---|---|---|
| Fewer adults facing food insecurity | 8.9% | 12.1% |
| Fewer older adults who have lost all their teeth | 7.5% | 9.9% |
| More binge drinkers | 22.2% | 19% |
CDC PLACES 2025 · modeled estimates for adults · CMS · HRSA
Jobs based here grew from 1,025 in 2013 to 1,360.
The top destinations are Appleton (17%), Grand Chute (7%) and Green Bay (6%). Only 8% of working residents stay in Freedom for work; the rest commute out. Freedom: 1.9% of residents live below the poverty line. Also worth knowing: between 2013 and 2023, jobs locally rose by 335, to 1,360.
| Freedom | Wisconsin towns | U.S. towns | |
|---|---|---|---|
| Median household income | $122,000 | $87,000 | $80,000 |
| Below the poverty line | 1.9% | 6.4% | 9.6% |
| Average trip to work | 22 minutes | 22 minutes | 25 minutes |
Census LEHD 2023 · ACS
For Freedom, the median rent is $862 a month. In the year to September 2026, typical home values climbed 8%. Just over nine in ten households own their home here.
| Freedom | Wisconsin towns | U.S. towns | |
|---|---|---|---|
| Households that own their home | 91% | 74% | 73% |
| Median rent | $862 a month | $1,080 a month | $1,185 a month |
Census ACS, 2020–24 · Zillow Home Value Index · Redfin Data Center
The median household earns $121,711, against $77,485 across Wisconsin, one input to its A+ for jobs and income.
The share of residents in Freedom who are 65 or older: 13%. Among 362 Wisconsin towns, just 9 have a higher share of children under 18 than Freedom. For Freedom, the midpoint age is 38 years. The Census Bureau’s 2025 estimate puts Freedom at 6,354 residents, up 2.3% since 2020.
| Freedom | Wisconsin towns | U.S. towns | |
|---|---|---|---|
| Under 18 | 30% | 21% | 22% |
| Aged 65 or older | 13% | 20% | 18% |
| Median age | 38 years | 42.1 years | 40.5 years |
| Bachelor’s degree or more, 25+ | 34% | 32% | 29% |
49% women, 51% men
That’s an even split within the survey’s margin of ±3.2 points. Across Wisconsin, 49.9% of residents are women.
| Freedom | WI | U.S. | |
|---|---|---|---|
| Under 10 | 18.3% | 11.2% | 11.6% |
| 10 to 17 | 12.1% | 10.2% | 10.3% |
| 18 to 24 | 4.6% | 9.3% | 9.1% |
| 25 to 34 | 9.5% | 12.6% | 13.7% |
| 35 to 44 | 16.1% | 12.7% | 13.2% |
| 45 to 54 | 11.3% | 11.8% | 12.2% |
| 55 to 64 | 14.8% | 13.8% | 12.7% |
| 65 to 74 | 7.2% | 11.2% | 10.2% |
| 75 and older | 6.1% | 7.3% | 7% |
| No diploma | 1.2% | 6.4% | 10.4% |
| High school | 32.7% | 29.4% | 26% |
| Some college | 12.6% | 19.5% | 19.1% |
| Associate’s | 19.3% | 11.3% | 8.8% |
| Bachelor’s | 26.5% | 22% | 21.6% |
| Graduate | 7.6% | 11.4% | 14.1% |
Census population estimates, 2025 · U.S. Census Bureau · ACS 2020-2024 5-year estimates
Expect July afternoons of 81° and January nights of 10°, with about 49 inches of snow a winter.
NOAA U.S. Climate Normals, 1991–2020
6.0 miles of trail wind through 1 park or preserve. The trail network density in Freedom is 0.2 miles per square mile.
| Freedom | Wisconsin towns | U.S. towns | |
|---|---|---|---|
| Conserved land | 0.7% | 3.8% | 4.3% |
| Miles of trail per square mile | 0.2 miles per square mile | 0.4 | 0.4 |
| Biggest places to walk | Trails | Acres |
|---|---|---|
| 1. VFW Memorial Park | — | 40 |
Trails & parks © OpenStreetMap contributors · Conserved land: USGS PAD-US
Museums, parks, gardens and other places to visit around Freedom. Close and well known come first.
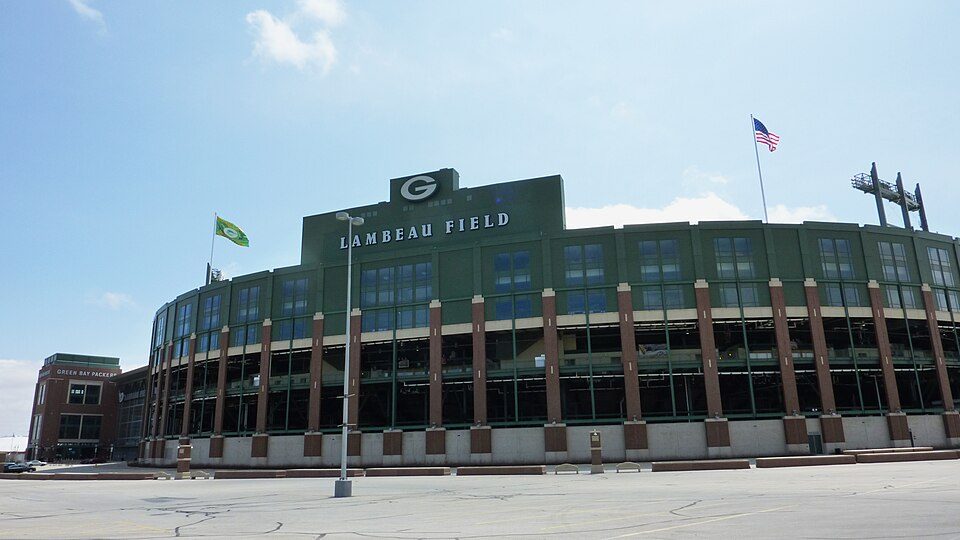 Big draw15 mi Stadium & arenaLambeau Field
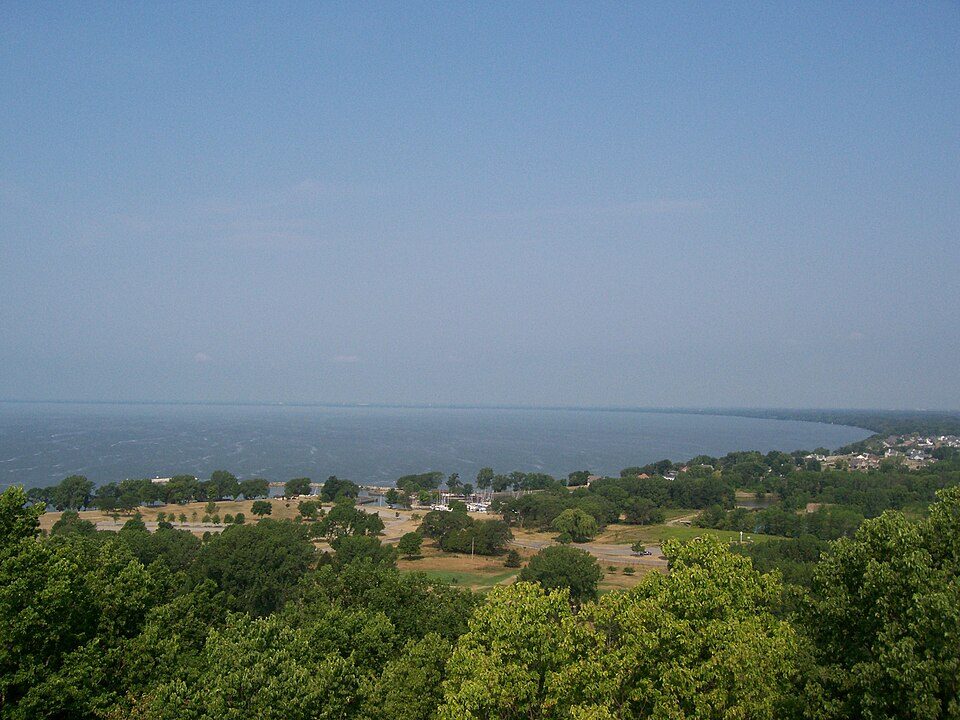 25 mi LakeLake Winnebago
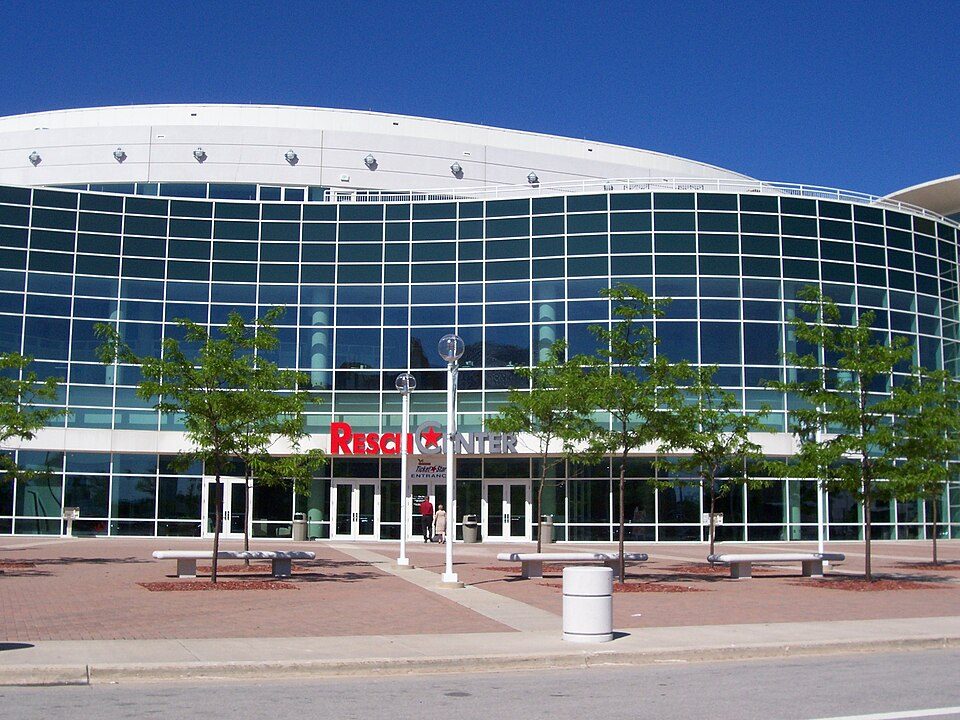 15 mi Stadium & arenaResch Center
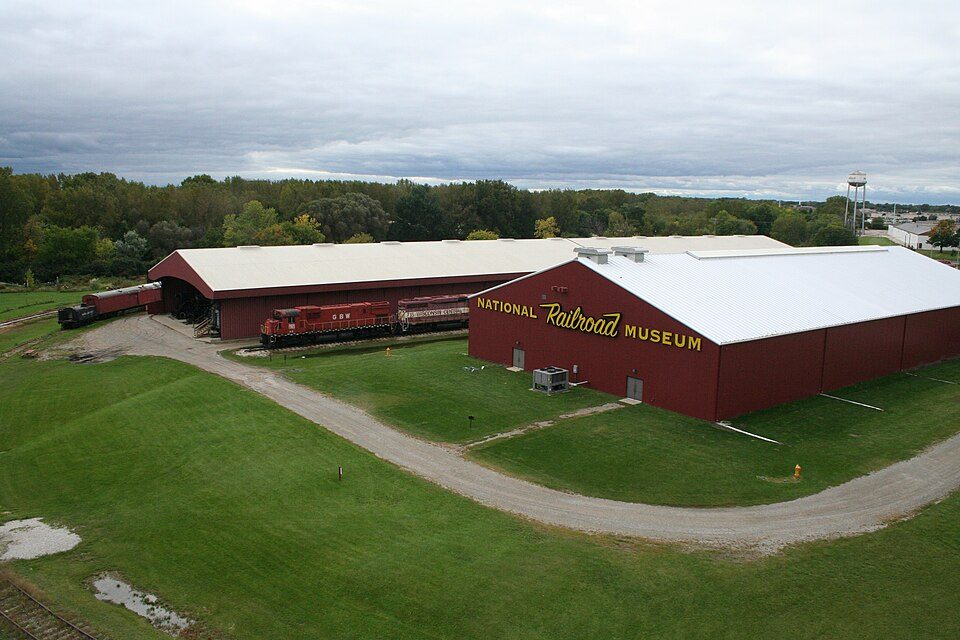 15 mi MuseumNational Railroad Museum
 38 mi MuseumUSS Cobia
 20 mi Theme parkBay Beach Amusement Park
Lambeau Field: JL1Row, CC BY-SA 3.0 · Lake Winnebago: self, CC BY-SA 2.5 · Resch Center: User Royalbroil on en.wikipedia, CC BY-SA 2.5 · National Railroad Museum: Dual Freq, CC BY 3.0 · USS Cobia: Unknown authorUnknown author, Public domain · Bay Beach Amusement Park: Royalbroil, CC BY-SA 3.0
4 within 15 miles of the center of Freedom
About 2 of every 100 Freedom residents are enrolled in college, against 6 across Wisconsin.
6 towns share a border with Freedom.
At #26 in WI, it grades higher overall than all 4 graded towns on its borders; Center (A) comes closest.
| Town | WI rank | Overall | Cost | Safety | Schools | Health |
|---|---|---|---|---|---|---|
| Freedom | #26 | A | B+ | — | B | A− |
| Appleton | #168 | B+ | B+ | C+ | C | B+ |
| Vandenbroek | — | — | B | — | A− | B+ |
| Osborn | — | — | C | — | C− | B− |
| Center | #38 | A | B− | — | A− | A− |
| Oneida | #171 | B+ | A− | — | C+ | B+ |
| Grand Chute | #267 | B− | C+ | D | C | A− |
Vandenbroek and Osborn have fewer than 2,500 residents, so they get subject grades but no overall grade. Freedom, Vandenbroek, Osborn, Center and Oneida report no FBI crime data of their own. Compare Freedom with a neighbor →
Short answers, built from the data on this page.
Yes, by almost any measure. Freedom grades A overall, better than 95% of U.S. towns and #26 of 357 in Wisconsin. It grades A− for health and B for schools.
Not for the area. Cost of living, which also weighs rents, property taxes and how many households pay 30% or more of their income for housing, grades B+.


