
Rutland Falls, Vermont, 1848
Rutland’s story
Rutland in pictures
The archive holds 12 old photos and papers going back to 1828 and 4 maps from 1891 on.
Explore the history →Each edition grades its towns against each other only.
A town of 3,869.
Rutland grades D overall, 63rd of 71 graded towns in Vermont, mostly because of safety. Its crime rate is higher than 83% of U.S. towns, with 6 violent crimes reported to the FBI in 2025. What it does well: natural-hazard risk is low. No town in Vermont scores lower than Rutland on history. The typical home is worth about $302K, 4.4 years of the Rutland area’s $69K median household income. On civic life, just 8 of Vermont’s 165 towns do worse.
Where Rutland beats most towns.
Where Rutland’s working residents go each day. Line width shows the share.
Census LEHD 2023
Each subject compared with towns across the country (schools within Vermont), ordered by how far Rutland is from typical.
Its grades run from A+ for hazard risk (better than 96% of comparable towns) to D for cost of living (better than 14%), so the D overall blends very different results.
How TownRatings grades towns →
The archive holds 12 old photos and papers going back to 1828 and 4 maps from 1891 on.
Explore the history →Who provides power, water and the rest in Rutland, and how to reach them.
EPA SDWIS (Oct 9, 2026) · HIFLD + EIA-861 2025 · Census 2020 ZCTAs · NCES 2024–25 · registration: vote.gov, updated Aug 3, 2026.
Ordered by what stands out in Rutland.
Rutland draws workers from Rutland and beyond, gets more snow than nearly all U.S. towns and is healthier than towns with similar incomes.
3,419 jobs are based in Rutland, 1.8 for every working resident, so most of the people who work here commute in.
Most working residents leave Rutland for work: only 14% work in town. Rutland’s average trip to work is 20 minutes, below both the Vermont town median (23 minutes) and the median of U.S. towns (25 minutes). Since 2013, Rutland has added 755 jobs, to 3,419 in 2023.
| Rutland | Vermont towns | U.S. towns | |
|---|---|---|---|
| Average trip to work | 20 minutes | 23 minutes | 25 minutes |
| Working residents who work in town | 14% | 16% | 8% |
| Median household income | $72,000 | $81,000 | $80,000 |
| Below the poverty line | 10% | 9.2% | 9.6% |
Census LEHD 2023 · ACS
Its public schools are run by the Rutland Town School District. Its one school is below.
| School | Level | Students | Letter |
|---|---|---|---|
| Rutland Town Elementary SchoolLargest public elementary schoolGrades PK–8 | Grades PK–8 | 379 | B+ |
NCES · EDFacts · graded within VT on state tests and graduation
Rutland’s FEMA risk score is 8 of 100, against 34 of 100 in Vermont’s towns and 44 of 100 across U.S. towns. Since 1981, 7 flood insurance claims have been paid out in Rutland.
FEMA flood insurance claims · FEMA National Risk Index · OpenFEMA
Reported crimes fell from 155 to 92 over the last three FBI years, a drop beyond ordinary year-to-year swings.
The property crime rate in Rutland is 22 per 1,000 residents. Rutland reports more crime per resident than most U.S. towns we grade: about 83% report less.
| Rutland | Vermont towns | U.S. towns | |
|---|---|---|---|
| Property crimes per 1,000 (2025) | 22 per 1,000 residents | 13.6 | 9.9 |
| Violent crimes per 1,000 (2025) | 1.5 per 1,000 residents | 1.8 | 1.6 |
FBI crime data, 2025 · crimes reported to police
13 miles of trail in 4 parks and preserves. Only 3 of the 71 Vermont towns we compare have a lower share of conserved land than Rutland. Northwood Park, at 299 acres with 2.8 miles of trail, is the biggest park or preserve.
| Rutland | Vermont towns | U.S. towns | |
|---|---|---|---|
| Conserved land | 3.4% | 14% | 4.3% |
| Miles of trail per square mile | 0.7 miles per square mile | 0.6 | 0.4 |
| Biggest places to walk | Trails | Acres |
|---|---|---|
| 1. Northwood Park | 2.8 mi | 299 |
| 2. Pine Hill Park | — | 29 |
| 3. Hathaway Farm Corn Maze | — | 12 |
Trails & parks © OpenStreetMap contributors · Conserved land: USGS PAD-US
Against the 10,676 U.S. towns with household incomes like Rutland’s, it is healthier than 81%, so its B+ isn’t only a matter of income. Within Vermont it is less healthy than 77% of the 71 graded towns: Vermont sets a high bar.
Rutland beats the Vermont average on 0 of 31 CDC measures and trails it on 12. 36% of Rutland adults have obesity. Among 71 Vermont towns, just 6 have a higher share of adults who have high blood pressure than Rutland.
| Rutland | Vermont towns | U.S. towns | |
|---|---|---|---|
| Obesity (CDC PLACES) | 36% | 30% | 35% |
| Sleep under 7 hours (CDC PLACES) | 30% | 30% | 36% |
| High blood pressure (CDC PLACES) | 37% | 32% | 35% |
| Frequent physical distress (CDC PLACES) | 15% | 13% | 14% |
| What stands out | Rutland | VT |
|---|---|---|
| More older adults who have lost all their teeth | 12.8% | 10.1% |
| More adults with obesity | 35.7% | 28.6% |
| More adults with COPD | 7.9% | 6.5% |
CDC PLACES 2025 · modeled estimates for adults · CMS · HRSA
The Chittenden weather station records that 83 inches of snow fall in a normal winter, more than in 95% of U.S. towns.
Rutland has cold, snowy winters and pleasant summers. Rutland’s July high is 80°F.
NOAA U.S. Climate Normals, 1991–2020
People 65 and older are 29% of residents (22% statewide); adults 18 to 34 are 17% of residents (22% statewide). 15% of residents are under 18 in Rutland. Among 71 Vermont towns, just 7 have a higher median age than Rutland.
| Rutland | Vermont towns | U.S. towns | |
|---|---|---|---|
| Median age | 50.8 years | 43.7 years | 40.5 years |
| Aged 65 or older | 29% | 22% | 18% |
| Under 18 | 15% | 19% | 22% |
| Bachelor’s degree or more, 25+ | 38% | 40% | 29% |
56% women, 44% men
About 79 men for every 100 women (the survey’s margin: ±4.1 points). Across Vermont, 50.4% of residents are women.
| Rutland | VT | U.S. | |
|---|---|---|---|
| Under 10 | 6.9% | 9.1% | 11.6% |
| 10 to 17 | 7.7% | 8.8% | 10.3% |
| 18 to 24 | 7.2% | 10% | 9.1% |
| 25 to 34 | 10.1% | 11.9% | 13.7% |
| 35 to 44 | 7.4% | 12.3% | 13.2% |
| 45 to 54 | 15.2% | 12% | 12.2% |
| 55 to 64 | 16.6% | 14.5% | 12.7% |
| 65 to 74 | 14.1% | 13% | 10.2% |
| 75 and older | 14.8% | 8.5% | 7% |
| No diploma | 2.5% | 5.1% | 10.4% |
| High school | 31.2% | 26.8% | 26% |
| Some college | 16.6% | 15.8% | 19.1% |
| Associate’s | 11.7% | 8.6% | 8.8% |
| Bachelor’s | 14.9% | 25.2% | 21.6% |
| Graduate | 23.1% | 18.6% | 14.1% |
U.S. Census Bureau · ACS 2020-2024 5-year estimates · in a town of 3,900, single groups can be off by several points
Museums, parks, gardens and other places to visit around Rutland. Close and well known come first.
 Big draw26 mi LandmarkFort Ticonderoga
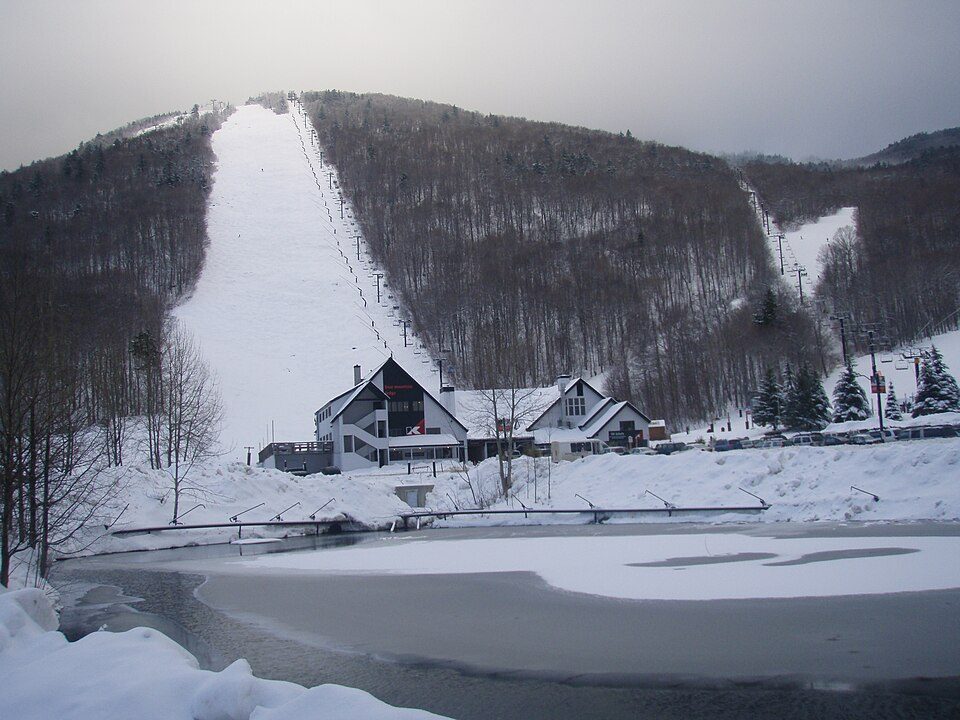 8 mi Ski areaKillington Resort184 runs · 3,031 ft vertical
 30 mi LakeLake George
 20 mi Ski areaOkemo Mountain119 runs · 2,165 ft vertical
 6 mi Ski areaPico Mountain Resort68 runs · 1,947 ft vertical
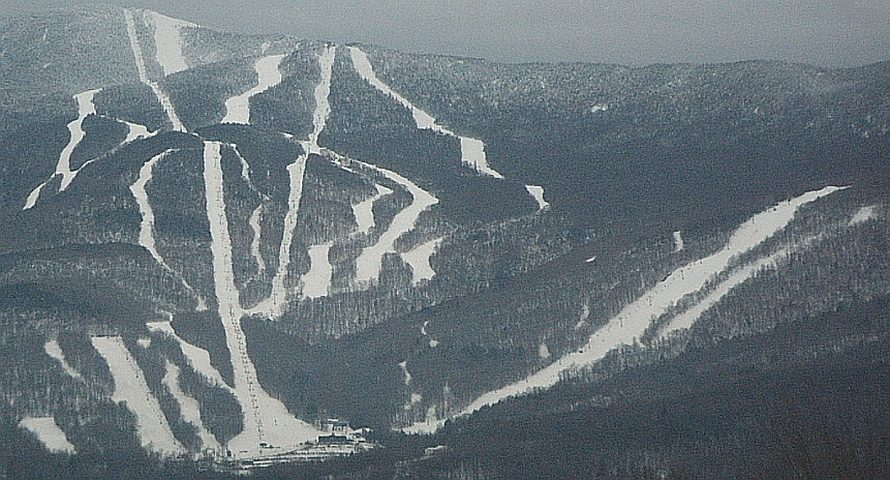 35 mi Ski areaSugarbush Resort142 runs · 2,569 ft vertical
Fort Ticonderoga: Mwanner, CC BY-SA 3.0 · Killington Resort: NHRHS2010, CC BY-SA 3.0 · Lake George: Sixlocal, CC BY-SA 3.0 · Okemo Mountain: Jrclark (talk), CC BY-SA 3.0 · Pico Mountain Resort: petersent, Public domain · Sugarbush Resort: Mrtrek1701 at English Wikipedia, CC BY-SA 3.0
None within 15 miles of Rutland; the nearest are
About 3 of every 100 Rutland residents are enrolled in college, against 7 across Vermont.
6 towns share a border with Rutland.
| Town | VT rank | Overall | Cost | Safety | Schools | Health |
|---|---|---|---|---|---|---|
| Rutland | #63 | D | D | C− | C+ | B+ |
| Proctor | — | — | C | — | C+ | B |
| West Rutland | — | — | C+ | — | C+ | B+ |
| Mendon | — | — | C− | — | D | B |
| Clarendon | — | — | C | — | C− | B+ |
| Pittsford | #40 | B− | B | A+ | D | B |
| Chittenden | — | — | C− | — | D | A− |
Proctor, West Rutland, Mendon, Clarendon and Chittenden have fewer than 2,500 residents, so they get subject grades but no overall grade. Proctor, West Rutland, Mendon, Clarendon and Chittenden report no FBI crime data of their own. Compare Rutland with a neighbor →
Short answers, built from the data on this page.
Rutland grades D overall, better than 14% of U.S. towns and #63 of 71 in Vermont. It grades B+ for health, C− for safety and C+ for schools. Cost of living is its weak spot, with a D.
Yes. Cost of living, which also weighs rents, property taxes and how many households pay 30% or more of their income for housing, grades D.


