Guest, Sign inJoin

Post to Richmond

We’ll email a one-tap link to publish your post. No password, and nothing is public until you click it.
Already a member? Sign in
Richmond
Vermont›Chittenden County

RichmondVT

A town of 4,103, settled in 1794.

4 bordering townsMap →
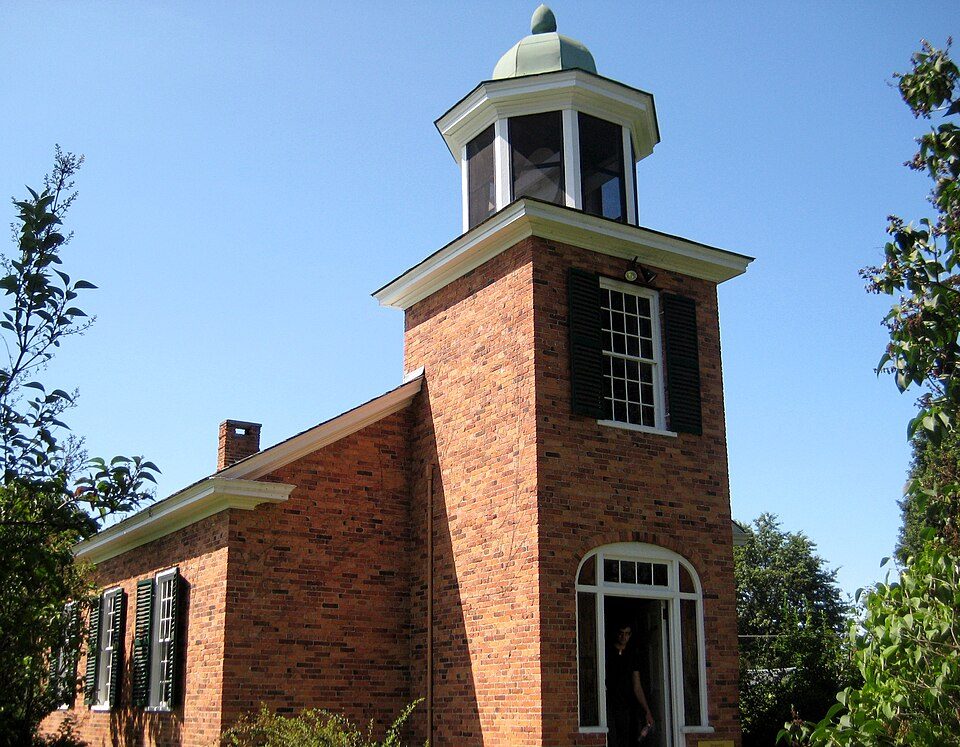
Richmond Congregational Church · Photo: John Need · CC BY-SA 3.0
Photo of Richmond

Richmond, VT · Richmond Congregational Church · Photo: John Need · CC BY-SA 3.0

Is Richmond a good place to live?

For most people who can afford it, yes. Richmond grades A overall, ranked 6th of 71 in Vermont. On CDC health estimates it is near the top nationally. Its public schools beat 94% of Vermont towns on state tests and graduation and the median household earns $108K. What holds it back is price: homes are expensive, about $579K for a typical one and 6.2 times the Burlington metro’s $93K median household income. Richmond’s trail density is 2.2 miles per square mile, against 0.6 in Vermont’s towns and 0.4 across U.S. towns. On hazard risk, just 3 of Vermont’s 172 towns do worse. Richmond's civic life (library use, community groups, volunteering) is stronger than in 95% of U.S. towns.

What makes Richmond stand out

Where Richmond beats most towns.

Round Church
Round Church · National Register of Historic Places
Richmond’s story

232 years in pictures

Round Church is a National Historic Landmark, the National Register’s top tier.

Census counts: 718 in 1800, 4,167 in 2020. The archive holds 6 old photos and papers going back to 2004 and 3 maps from 1924 on.

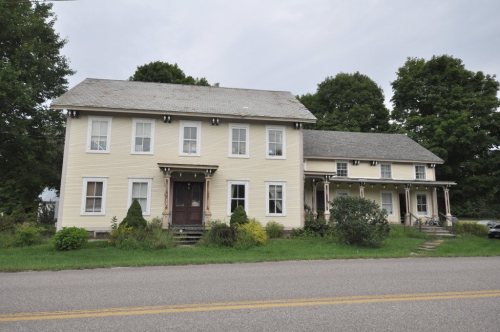
8 places on the National Register of Historic Places.

  • 1794Richmond is settled
Explore the history →

How Richmond grades

Each subject compared with towns across the country (schools within Vermont), ordered by how far Richmond is from typical.

How grading works
Character Graded, but not part of the overall grade.
Described, not graded Taste, not quality: snow or an older crowd is neither good nor bad.

How TownRatings grades towns →

Getting set up

Moving to Richmond: who provides what

Who provides power, water and the rest in Richmond, and how to reach them.

The full setup list →
PowerGreen Mountain Power23.3¢/kWh · EIA 2025HIFLD · EIA
WaterRichmond Water DeptNo health-based violations in 5 years · EPAEPA
Internet5 providers93% of addresses get 100/20 MbpsFCC
Trash & dumpCasella Waste Systems Dropoff CenterIn townOpenStreetMap
SchoolsMount Mansfield Unified Union School District 401Mount Mansfield Unified Union School District (Supervisory)2 districts serve Richmond; which school depends on your address and gradeNCES
Register to voteOnlineIn Vermont you can register online up to and including Election Day, in person up to and including Election Day, or by mail (received by Election Day).vote.gov
Who runs elections hereRichmond Town ClerkThe town itself; contacts on the Handbook page.FVAP, Nov 2025
ZIP code0547705477 100%Census 2020

EPA SDWIS (Oct 9, 2026) · HIFLD + EIA-861 2025 · Census 2020 ZCTAs · NCES 2024–25 · registration: vote.gov, updated Aug 3, 2026.

The data

Ordered by what stands out in Richmond.

Richmond gets more snow than nearly all U.S. towns, but it carries more natural-hazard risk than most of Vermont (mostly inland flooding) and has homes that cost more against local pay than most of Vermont.

OutdoorsA

17.1% of Richmond is conserved land

73 miles of trail in 1 park or preserve. The biggest place to walk is Robbins Mountain Wildlife Management Area, 354 acres with 1.1 miles of trail.

#8for trails in VT
17.1%
conserved · 3,580 of 20,915 acres
73 mi
of trails · 2.2 per sq mi
Biggest places to walkTrailsAcres
1. Robbins Mountain Wildlife Management Area1.1 mi354

Trails & parks © OpenStreetMap contributors · Conserved land: USGS PAD-US

SchoolsA

For schools, Richmond earns an A

Its public schools are run by the Mount Mansfield Unified Union School District #401. Two of its 3 schools are below, each with why it’s listed.

94%of VT districts it outscoresASchool Grade
SchoolLevelStudentsLetter
Richmond Elementary SchoolLargest public elementary schoolGrades PK–4Grades PK–4356A
Camels Hump Middle SchoolTop results in townGrades 5–8Grades 5–8332A

NCES · EDFacts · graded within VT on state tests and graduation

HealthA+

A smaller share of adults in Richmond sleep under 7 hours than in the typical Vermont or U.S. town

Its widest gap with Vermont is food insecurity: 5% of its 3,575 adults worry about having enough food, against 9.2% statewide.

23% of adults sleep under 7 hours in Richmond, where Vermont’s towns sit at 30% and U.S. towns at 36%. 12% of Richmond adults get no exercise outside work. Only 5 of the 71 Vermont towns we compare have a higher share of adults who binge drink than Richmond.

99%healthier than U.S. townsA+Health Grade
RichmondVermont townsU.S. towns
Sleep under 7 hours (CDC PLACES)23%30%36%
Get no exercise (CDC PLACES)12%19%25%
Obesity (CDC PLACES)23%30%35%
High blood pressure (CDC PLACES)26%32%35%
31 measures vs. Vermont
23 better7 too close to call1 worse
What stands outRichmondVT
Fewer adults facing food insecurity5%9.2%
Fewer older adults who have lost all their teeth6.2%10.1%
Fewer adults treating high blood pressure73.7%76.7%
University. of Vermont - Fletcher Allen Health Care
12.6 mi away · emergency room
None
primary care, dental or mental-health shortage
94th
percentile among VT towns

CDC PLACES 2025 · modeled estimates for adults · CMS · HRSA

HousingCost of living grade C−

For cost of living, Richmond earns a C−

At 6.2 years of the Burlington metro’s $93K median household income, the typical home (about $579K) costs more against local pay than in 86% of Vermont towns; that ratio is one input to its C− for cost of living.

The typical Richmond home is worth about $579,000, about the same as a year ago, 48% above the Vermont typical home.

$579KZillow home value

Typical home value

Richmond$579K
Vermont$392K
+0%
value change, 1 year

Zillow Home Value Index · Redfin Data Center

Work & commuteJobs & income grade A

Most of Richmond’s workers commute out: the town has 0.6 jobs for each of them

Most working residents leave Richmond for work: only 9% work in town. 4.2% of residents live below the poverty line in Richmond. Since 2013, Richmond has added 114 jobs, to 1,318 in 2023.

9%work in town
RichmondVermont townsU.S. towns
Median household income$108,000$80,000$80,000
Below the poverty line4.2%9.6%9.6%
Working residents who work in town8.7%16%8%
Average trip to work25 minutes22 minutes25 minutes

Where working residents work

In Richmond9%
Burlington24%
South Burlington13%
Williston9%
Essex Junction5%
11 mi
median commute distance
1,318
jobs based in Richmond
A commuter town
jobs vs. working residents
C+
Walkability grade: more walkable than 39% of U.S. towns

Census LEHD 2023 · ACS

Natural hazardsHazard risk grade C−

The FEMA risk score in Richmond is higher than in most of Vermont or the rest of the country

FEMA rates its natural-hazard risk higher than 97% of Vermont towns, with expected losses of about $638 per resident a year; that rating is what its C− for hazard risk is built on.

The FEMA risk score in Richmond is 75 of 100. Since 1979, 50 flood insurance claims have been paid out in Richmond.

75risk score of 100
FEMA risk score
75High riskLowerHigher
Inland floodingAvalanches
50
paid flood claims since 1979
12
federal disasters paid out here

FEMA flood insurance claims · FEMA National Risk Index · OpenFEMA

Climate

Richmond has snowy winters and pleasant summers

The Essex Junction 1 N weather station, 11 miles away, records that 86 inches of snow fall in a normal winter, more than in 95% of U.S. towns. The Essex Junction 1 N weather station, 11 miles away, records that the frost-free season runs about 160 days: shorter than most of the country, but longer than 88% of Vermont places with climate records.

Richmond has cold, snowy winters and pleasant summers. Richmond’s July high is 80°F.

86″snow a winter

Typical low → high °F

Winter12–31°
Spring32–54°
Summer56–78°
Fall38–57°
Oct 11
typical first frost
May 2
typical last frost
+1.8°
vs. the 20th-century average

NOAA U.S. Climate Normals, 1991–2020

Safety

Crime reported in Richmond

Richmond's reported crime rate is well below Vermont's. Among 42 Vermont towns, just 3 have a lower violent crime rate than Richmond. Most reported incidents are property crimes, mainly thefts.

RichmondVermont townsU.S. towns
Property crimes per 1,000 (2024)1.9 per 1,000 residents11.711.5
Violent crimes per 1,000 (2024)0 per 1,000 residents1.71.7

Violent crime per 1,000 residents

Richmond0
Vermont2.3
U.S.3.6

Property crime per 1,000 residents

Richmond1.9
Vermont16.7
U.S.17.7
0
violent crimes reported in 2024
8
property crimes reported in 2024

FBI crime data, 2024 · crimes reported to police

Nearby attractions

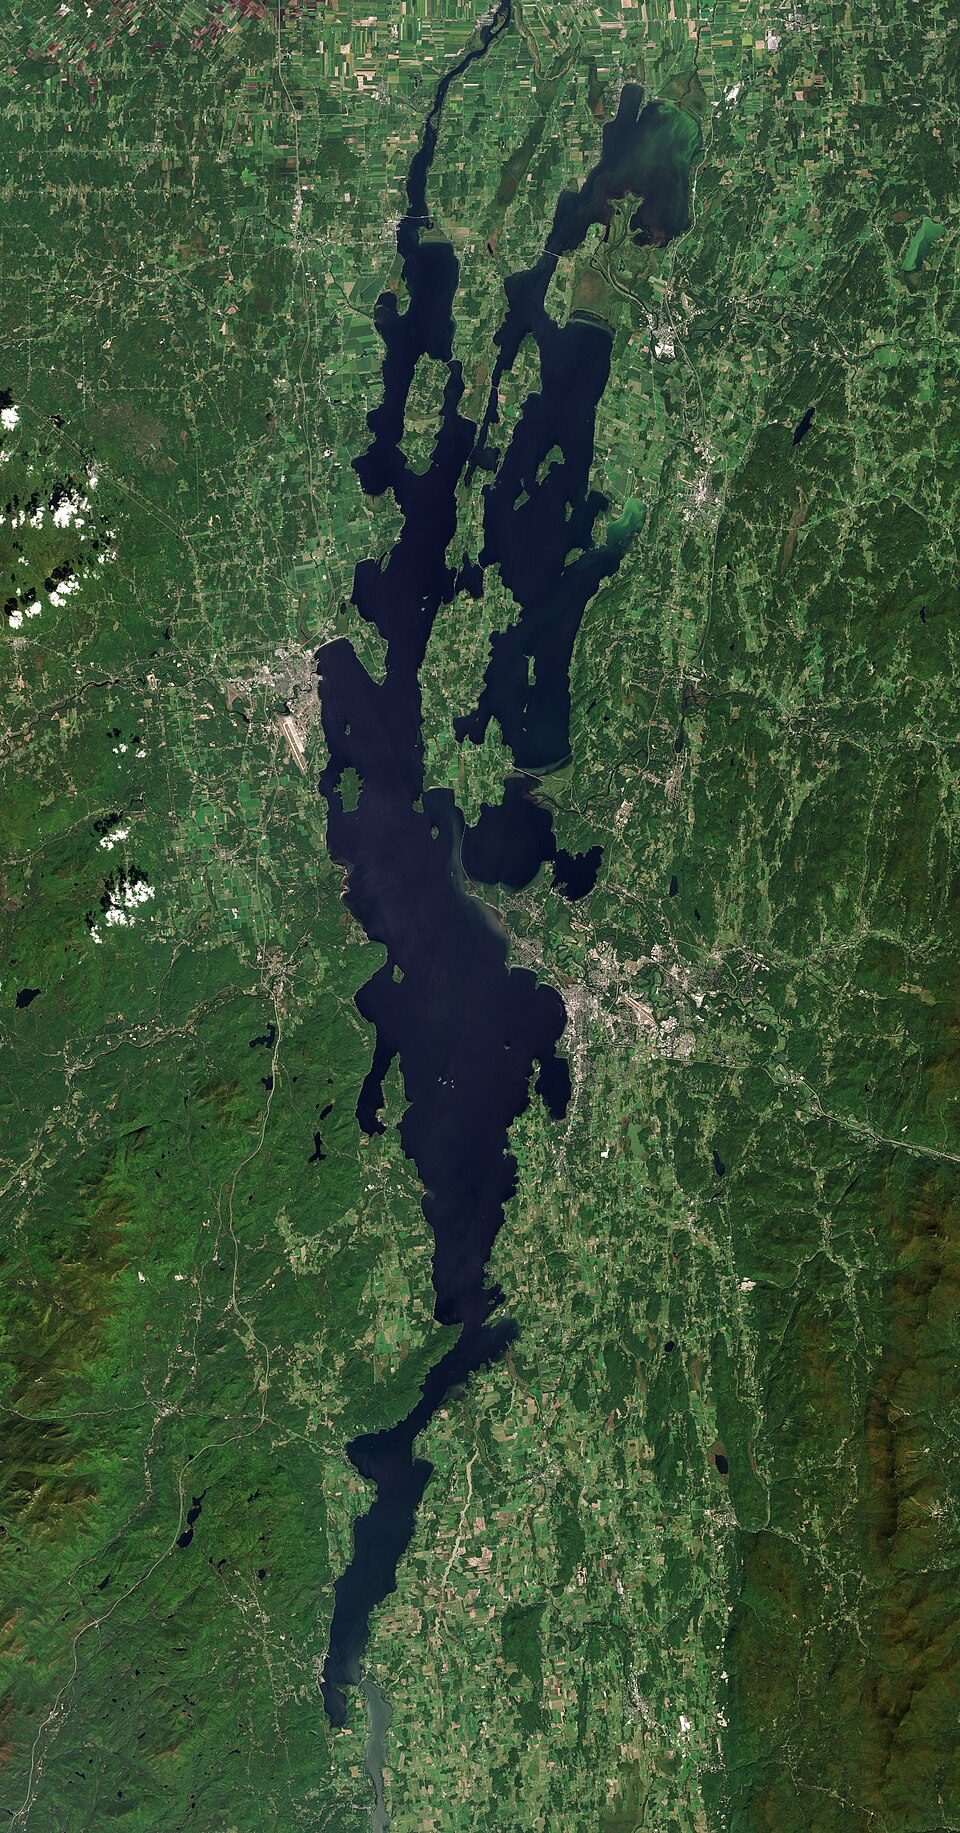
Lake Champlain and 16 more within 40 miles

Museums, parks, gardens and other places to visit around Richmond. Close and well known come first.

All 45 attractions →
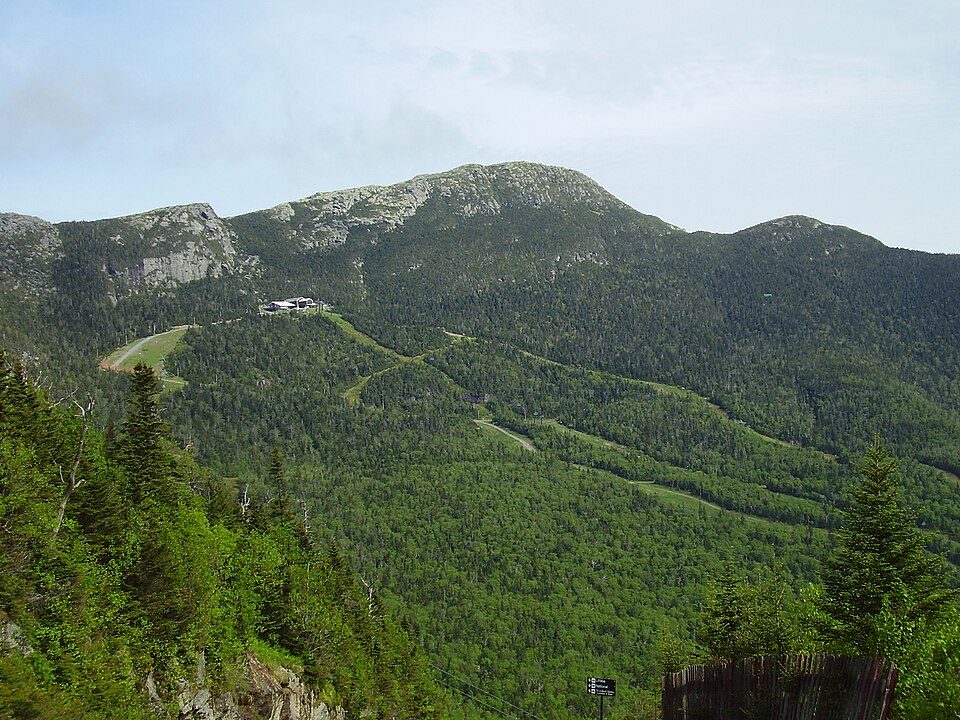
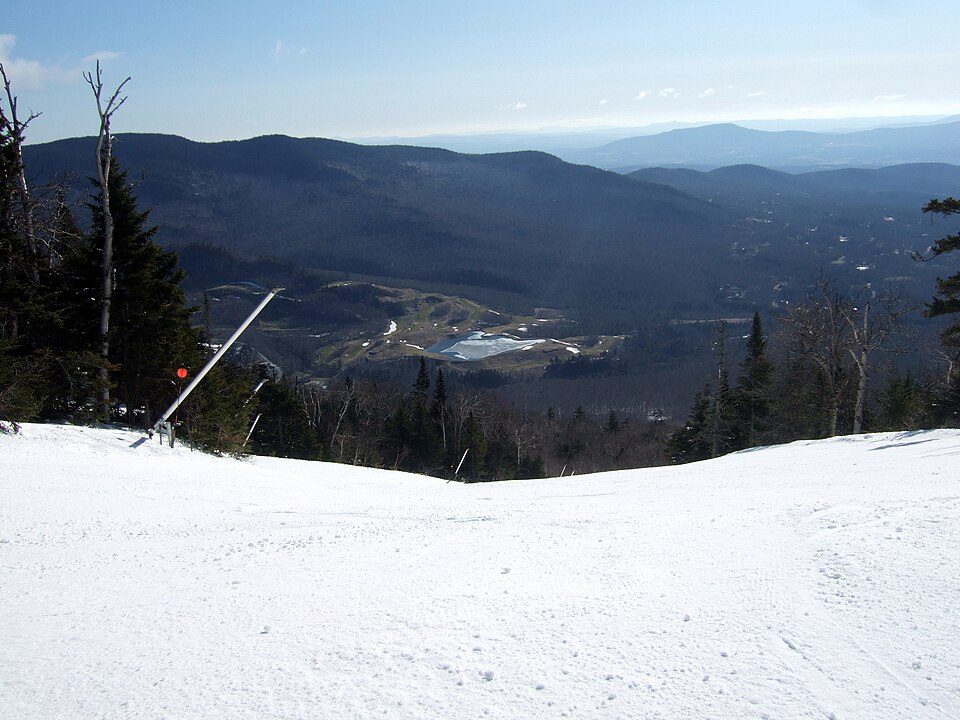
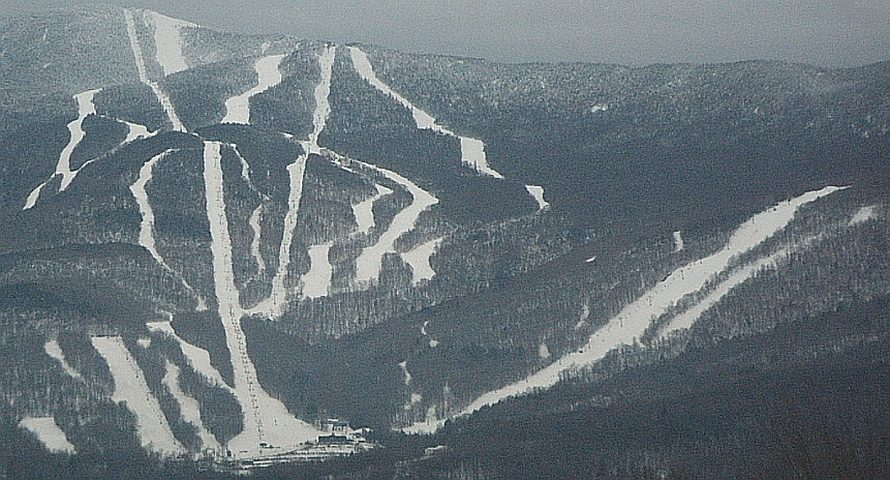
Sources: National Park Service · ski areas © OpenSkiMap / OpenStreetMap contributors · Wikidata · Wikipedia readership · photos via Wikimedia Commons
Photo credits

Lake Champlain: Copernicus Sentinel-2, ESA, CC BY-SA 3.0 igo · Mount Mansfield: Original uploader was Calzarette (Joe Calzarette) at en.wikipedia, Public domain · Stowe Mountain Resort: Stevage, CC BY-SA 3.0 · Sugarbush Resort: Mrtrek1701 at English Wikipedia, CC BY-SA 3.0 · Shelburne Museum: Storylanding, CC0 · Mad River Glen: Jrclark (talk), CC BY-SA 3.0

Keep exploring

Everything we know about Richmond

20pages on Richmond
After high school

Colleges nearby

3 within 15 miles of the center of Richmond

A commuter town

91% of working residents leave Richmond for work

Where Richmond’s working residents go each day. Line width shows the share.

24% → Burlington Burlington 24% 13% → South Burlington South Burlington 13% 9% → Williston Williston 9% 5% → Essex Junction Essex Junction 5% 4% → Essex Essex 4% 4% → Colchester Colchester 4% Richmond · 9% stay
1,318jobs based in Richmond
9%of working residents work in town
11 mimedian commute distance

Census LEHD 2023

Landmarks

8 places in Richmond on the National Register of Historic Places.

All landmarks →

Famous people from Richmond

4 notable people were born in Richmond.

See all 4 →

About Richmond

Town in Vermont, United States

Richmond is a town in Chittenden County, Vermont, United States. As of the 2020 census the population was 4,167. The main settlement of Richmond, in the north-central part of town, is a census-designated place (CDP), with a population of 853 at the 2020 census; it was formerly an incorporated village.

From Wikipedia, licensed CC BY-SA 4.0 · facts via Wikidata (CC0)

Established
1794
Area
33 sq mi
Elevation
289 ft
ZIP code
05477
Area code
802

Richmond’s neighbors

4 towns share a border with Richmond.

Explore the map →
How the neighbors grade
TownVT rankOverallCostSafetySchoolsHealth
Richmond#6AC−—AA+
Bolton——B−—AA+
Williston#25BDDA+A+
Jericho#2AD—AA+
Huntington——B—AA+

Bolton and Huntington have fewer than 2,500 residents, so they get subject grades but no overall grade. Richmond, Bolton, Jericho and Huntington report no FBI crime data of their own. Compare Richmond with a neighbor →

Questions about Richmond

Short answers, built from the data on this page.

Is Richmond, VT a good place to live?

For most people who can afford it, yes. Richmond grades A overall, better than 87% of U.S. towns and #6 of 71 in Vermont. It grades A+ for health and A for schools. Hazard risk is its weak spot, with a C−.

Is Richmond, VT expensive?

Yes. Cost of living, which also weighs rents, property taxes and how many households pay 30% or more of their income for housing, grades C−.

What is Richmond, VT known for?

4 notable people were born here, including George F. Edmunds and Cody Arens.