Guest, Sign inJoin
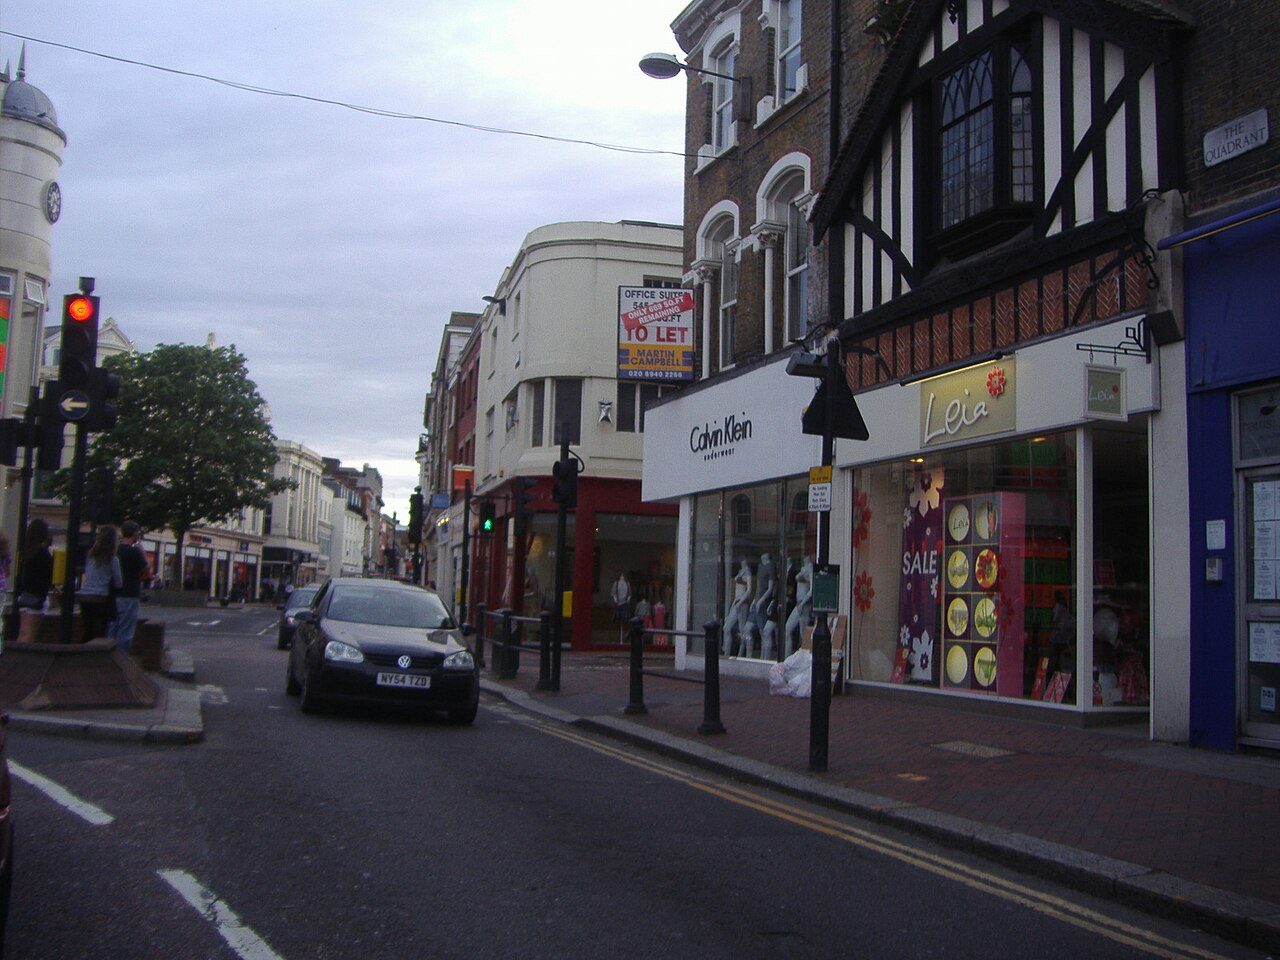
The Quadrant, Richmond town centreRichmond upon Thames, #1 on this list · Photo: David Howard · CC BY-SA 2.0
England, Wales and Northern Ireland · Big towns and cities

Best big towns and cities to live in in England, Wales and Northern Ireland

Richmond upon Thames, London, ranks first of the 96 places of 100,000+ in England, Wales and Northern Ireland with an overall grade, with an A. 5 of the 96 grade A− or better.

The overall score, among places of 100,000+ only; the letter is the same UK grade every town gets. The area rank sits beside each letter. How grades work

#1

Richmond upon Thames

London · 192,888 people
A

Score 69.2·#1 of 33 in London

Strongest: walkability A+, schools A+·lowest: hazard risk C−
#2

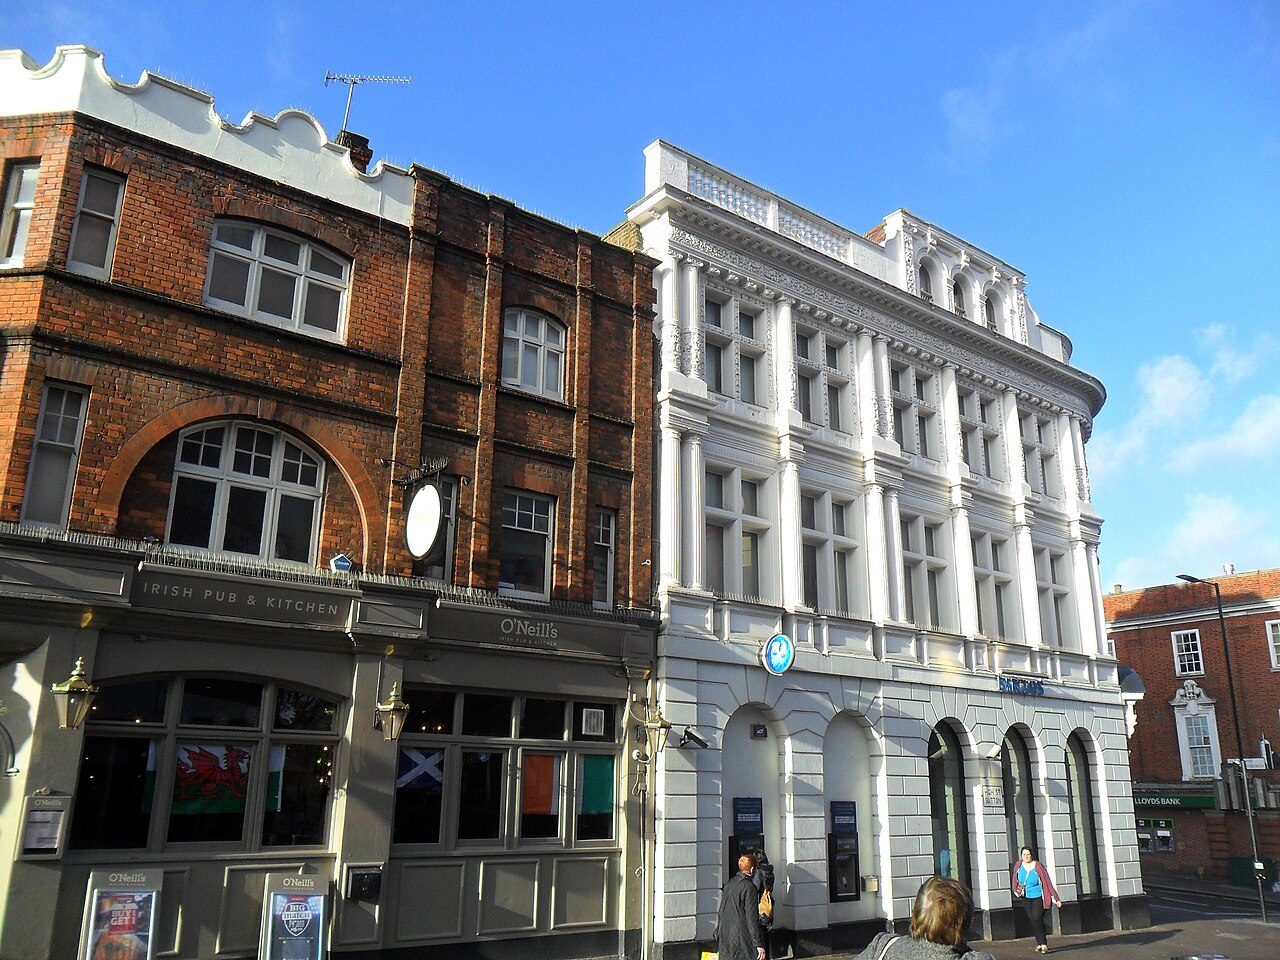
Sutton

London · 208,858 people
A

Score 68.2·#2 of 33 in London

Strongest: walkability A+, schools A+·lowest: safety C

#3

Kingston upon Thames

London · 166,333 people
A

Score 68.1·#3 of 33 in London

Strongest: walkability A+, schools A+·lowest: hazard risk D

All 96

By overall score; the letter is the same UK grade as on each town’s page. Each area rank links to that area’s list. The score (0–100) blends the seven livability grades and sets the order; the letter places that score among UK towns of 2,500+, and A+ is the top 5%, so neighbours on the list often share a letter.

96 towns on this page. Counties and council areas with 15 or more towns have their own list.

#TownScoreGrade · area rankWhat drives it
1Richmond upon ThamesLondon · 192,888 people69.2top 7.4%A#1 of 33 in LondonStrongest: walkability A+, schools A+·lowest: hazard risk C−
2SuttonLondon · 208,858 people68.2top 8.5%A#2 of 33 in LondonStrongest: walkability A+, schools A+·lowest: safety C
3Kingston upon ThamesLondon · 166,333 people68.1top 8.7%A#3 of 33 in LondonStrongest: walkability A+, schools A+·lowest: hazard risk D
4BromleyLondon · 325,469 people66.8top 10.6%A#4 of 33 in LondonStrongest: walkability A+, schools A·lowest: hazard risk C−
5BexleyLondon · 246,074 people61.5top 18.9%A−#5 of 33 in LondonStrongest: walkability A+, schools A·lowest: safety C
6MertonLondon · 214,931 people58.0top 26.7%B+#7 of 33 in LondonStrongest: walkability A+, schools A·lowest: hazard risk C−
7ChelmsfordEssex · 110,612 people58.0top 26.7%B+#28 of 81 in EssexStrongest: walkability A, schools A·lowest: safety D
8HarrowLondon · 260,534 people57.6top 27.2%B+#8 of 33 in LondonStrongest: walkability A+, schools A·lowest: hazard risk C
9SolihullWest Midlands · 107,754 people56.4top 29.6%B+#6 of 35 in West MidlandsStrongest: schools A−, jobs & income B+·lowest: safety C−
10BarnetLondon · 388,572 people56.3top 29.7%B+#9 of 33 in LondonStrongest: walkability A+, schools A+·lowest: safety C
11CambridgeCambridgeshire · 152,742 people56.0top 30.5%B+#32 of 50 in CambridgeshireStrongest: walkability A+, jobs & income A·lowest: safety C−
12HaveringLondon · 259,401 people54.8top 33.4%B+#10 of 33 in LondonStrongest: walkability A+, schools B+·lowest: safety C
13WandsworthLondon · 326,725 people54.2top 34.8%B+#11 of 33 in LondonStrongest: walkability A+, schools A·lowest: hazard risk C−
14Kensington and ChelseaLondon · 143,348 people54.2top 34.9%B+#12 of 33 in LondonStrongest: walkability A+, schools A+·lowest: safety D
15RedbridgeLondon · 309,509 people53.5top 35.8%B#13 of 33 in LondonStrongest: walkability A+, schools A+·lowest: safety C−
16BasingstokeHampshire · 117,211 people53.2top 36.4%B#47 of 76 in HampshireStrongest: cost of living A, walkability A·lowest: safety C−
17HillingdonLondon · 307,089 people52.3top 38.4%B#14 of 33 in LondonStrongest: walkability A+, schools A−·lowest: safety C−
18ColchesterEssex · 130,259 people51.7top 39.4%B#37 of 81 in EssexStrongest: walkability A, cost of living A−·lowest: safety D
19BelfastBelfast · 293,298 people50.9top 41.0%BStrongest: cost of living A+, walkability A+·lowest: health D−
20WarringtonCheshire · 174,968 people50.7top 41.4%B#29 of 46 in CheshireStrongest: schools A−, cost of living A−·lowest: hazard risk C−
21HounslowLondon · 286,591 people49.6top 44.1%B#15 of 33 in LondonStrongest: walkability A+, schools A·lowest: safety C−
22Hammersmith and FulhamLondon · 182,187 people49.0top 45.7%B−#16 of 33 in LondonStrongest: walkability A+, schools A+·lowest: safety D
23WestminsterLondon · 203,571 people48.9top 45.8%B−#17 of 33 in LondonStrongest: walkability A+, schools A·lowest: safety D−
24CroydonLondon · 389,242 people48.8top 45.9%B−#18 of 33 in LondonStrongest: walkability A+, schools B+·lowest: safety D
25EalingLondon · 367,271 people48.5top 46.5%B−#19 of 33 in LondonStrongest: walkability A+, schools A·lowest: safety C−
26SouthwarkLondon · 307,076 people48.0top 47.7%B−#20 of 33 in LondonStrongest: walkability A+, schools A·lowest: safety D
27CheltenhamGloucestershire · 115,941 people47.6top 48.5%B−#29 of 48 in GloucestershireStrongest: walkability A+, schools B+·lowest: safety C−
28WatfordHertfordshire · 131,336 people47.6top 48.7%B−#38 of 50 in HertfordshireStrongest: walkability A+, schools A·lowest: safety C−
29YorkNorth Yorkshire · 141,696 people47.3top 49.4%B−#31 of 54 in North YorkshireStrongest: walkability A+, schools A−·lowest: hazard risk D
30ReadingBerkshire · 203,789 people47.0top 49.9%B−#27 of 30 in BerkshireStrongest: walkability A+, schools A−·lowest: safety C−
31Waltham ForestLondon · 278,129 people46.9bottom 49.7%B−#21 of 33 in LondonStrongest: walkability A+, schools A·lowest: safety C−
32CamdenLondon · 209,342 people46.3bottom 48.2%B−#22 of 33 in LondonStrongest: walkability A+, hazard risk A·lowest: safety D−
33NewhamLondon · 351,065 people45.3bottom 46.4%B−#23 of 33 in LondonStrongest: walkability A+, schools A·lowest: safety D
34WorcesterWorcestershire · 105,439 people45.2bottom 46.2%B−#16 of 22 in WorcestershireStrongest: walkability A, cost of living B+·lowest: safety D
35GreenwichLondon · 288,117 people45.1bottom 45.7%B−#24 of 33 in LondonStrongest: walkability A+, schools A−·lowest: safety D
36NorthamptonNorthamptonshire · 243,527 people44.7bottom 44.4%C+#17 of 31 in NorthamptonshireStrongest: walkability A−, cost of living B+·lowest: safety D
37MaidstoneKent · 109,503 people44.5bottom 43.9%C+#35 of 87 in KentStrongest: walkability A−, schools A−·lowest: safety D
38EnfieldLondon · 329,822 people44.2bottom 43.1%C+#25 of 33 in LondonStrongest: walkability A+, schools A−·lowest: safety C−
39SwindonWiltshire · 183,687 people43.9bottom 42.6%C+#27 of 30 in WiltshireStrongest: walkability A, cost of living B·lowest: safety C−
40PooleDorset · 141,009 people43.9bottom 42.5%C+#12 of 30 in DorsetStrongest: walkability A−, schools A−·lowest: cost of living D
41Tower HamletsLondon · 311,072 people43.9bottom 42.4%C+#26 of 33 in LondonStrongest: walkability A+, schools A·lowest: safety D
42IslingtonLondon · 216,309 people43.5bottom 41.8%C+#27 of 33 in LondonStrongest: walkability A+, hazard risk A·lowest: safety D
43LambethLondon · 317,108 people43.5bottom 41.7%C+#28 of 33 in LondonStrongest: walkability A+, schools B+·lowest: safety D
44OxfordOxfordshire · 170,799 people43.3bottom 41.1%C+#37 of 38 in OxfordshireStrongest: walkability A+, jobs & income A·lowest: cost of living D
45HaringeyLondon · 264,069 people43.0bottom 40.2%C+#29 of 33 in LondonStrongest: walkability A+, schools A−·lowest: safety D
46LewishamLondon · 300,764 people42.9bottom 40.1%C+#30 of 33 in LondonStrongest: walkability A+, schools B+·lowest: safety D
47BrentLondon · 340,611 people42.8bottom 39.7%C+#31 of 33 in LondonStrongest: walkability A+, schools A−·lowest: cost of living D
48SunderlandTyne and Wear · 168,323 people42.7bottom 39.6%C+#19 of 34 in Tyne and WearStrongest: walkability A, cost of living A−·lowest: health D
49HackneyLondon · 258,464 people42.4bottom 39.2%C+#32 of 33 in LondonStrongest: walkability A+, schools A·lowest: safety D
50Barking and DagenhamLondon · 218,236 people42.3bottom 38.9%C+#33 of 33 in LondonStrongest: walkability A+, schools B+·lowest: safety D
51Milton KeynesBuckinghamshire · 197,328 people41.8bottom 37.7%C+#38 of 39 in BuckinghamshireStrongest: walkability B+, schools B·lowest: safety D
52Kingswood and FishpondsGloucestershire · 160,280 people41.0bottom 36.0%C+#37 of 48 in GloucestershireStrongest: walkability A−, jobs & income B·lowest: safety C−
53WorthingWest Sussex · 111,635 people39.9bottom 33.4%C#28 of 40 in West SussexStrongest: walkability A, schools B+·lowest: cost of living D
54PlymouthDevon · 266,970 people39.9bottom 33.3%C#23 of 47 in DevonStrongest: walkability A, schools B+·lowest: safety D
55IpswichSuffolk · 151,566 people39.6bottom 32.9%C#30 of 34 in SuffolkStrongest: walkability A, hazard risk B·lowest: safety C−
56Southend-on-SeaEssex · 182,295 people39.6bottom 32.8%C#62 of 81 in EssexStrongest: walkability A+, schools A−·lowest: safety D
57SloughBerkshire · 166,868 people39.5bottom 32.7%C#30 of 30 in BerkshireStrongest: schools A, walkability A·lowest: safety D
58BournemouthDorset · 196,453 people39.4bottom 32.4%C#17 of 30 in DorsetStrongest: walkability A, schools A·lowest: cost of living D
59ExeterDevon · 126,181 people39.0bottom 31.6%C#24 of 47 in DevonStrongest: walkability A+, jobs & income B·lowest: safety D
60HuddersfieldWest Yorkshire · 141,683 people37.5bottom 27.6%C#75 of 91 in West YorkshireStrongest: cost of living A, walkability A−·lowest: safety D
61PeterboroughCambridgeshire · 190,592 people37.0bottom 26.2%C#43 of 50 in CambridgeshireStrongest: walkability A−, cost of living A−·lowest: safety D
62TelfordShropshire · 156,890 people36.7bottom 25.4%C#18 of 19 in ShropshireStrongest: cost of living A−, hazard risk C+·lowest: health D
63BlackburnLancashire · 124,958 people36.5bottom 24.8%C−#41 of 65 in LancashireStrongest: walkability B+, cost of living B·lowest: health D
64Brighton and HoveEast Sussex · 277,096 people36.4bottom 24.6%C−#18 of 26 in East SussexStrongest: walkability A+, schools B·lowest: cost of living D−
65GatesheadTyne and Wear · 115,278 people36.3bottom 24.4%C−#29 of 34 in Tyne and WearStrongest: walkability A+, schools B·lowest: health D
66GloucesterGloucestershire · 118,562 people36.2bottom 23.8%C−#48 of 48 in GloucestershireStrongest: walkability A, schools B·lowest: safety D
67Kingston upon HullEast Riding of Yorkshire · 270,816 people35.6bottom 22.4%C−#23 of 25 in East Riding of YorkshireStrongest: walkability A, cost of living B+·lowest: safety D−
68SheffieldSouth Yorkshire · 500,520 people35.4bottom 21.8%C−#47 of 63 in South YorkshireStrongest: walkability A, cost of living B−·lowest: safety D
69DerbyDerbyshire · 275,561 people35.3bottom 21.4%C−#52 of 59 in DerbyshireStrongest: walkability A−, cost of living A−·lowest: safety D
70SwanseaWest Glamorgan · 170,090 people34.5bottom 19.4%C−#11 of 19 in West GlamorganStrongest: walkability B+, cost of living B+·lowest: health D
71BradfordWest Yorkshire · 333,968 people34.5bottom 19.2%C−#80 of 91 in West YorkshireStrongest: cost of living A, walkability A−·lowest: safety D−
72CardiffSouth Glamorgan · 348,511 people34.0bottom 18.2%C−#8 of 9 in South GlamorganStrongest: walkability A+, cost of living C+·lowest: safety D
73CrawleyWest Sussex · 120,567 people33.9bottom 18.1%C−#35 of 40 in West SussexStrongest: walkability A, jobs & income B−·lowest: safety D
74LutonBedfordshire · 233,524 people33.7bottom 17.5%C−#33 of 33 in BedfordshireStrongest: walkability A, schools B·lowest: cost of living D
75MiddlesbroughNorth Yorkshire · 148,232 people33.4bottom 17.0%C−#50 of 54 in North YorkshireStrongest: cost of living A−, walkability B+·lowest: safety D−
76GillinghamKent · 108,485 people33.3bottom 16.6%C−#66 of 87 in KentStrongest: walkability A−, jobs & income C+·lowest: safety D
77Newcastle upon TyneTyne and Wear · 286,472 people33.0bottom 16.1%C−#33 of 34 in Tyne and WearStrongest: walkability A+, schools B+·lowest: safety D
78LeedsWest Yorkshire · 536,262 people32.6bottom 15.3%C−#83 of 91 in West YorkshireStrongest: walkability A+, schools C+·lowest: safety D−
79NorwichNorfolk · 200,744 people31.8bottom 13.3%D#36 of 51 in NorfolkStrongest: walkability A+, hazard risk B−·lowest: safety D
80CoventryWest Midlands · 344,289 people31.5bottom 13.0%D#17 of 35 in West MidlandsStrongest: walkability A, hazard risk B−·lowest: safety D
81BristolBristol · 425,196 people30.7bottom 11.7%DStrongest: walkability A+, jobs & income B−·lowest: safety D−
82BirkenheadMerseyside · 109,854 people30.3bottom 11.1%D#16 of 25 in MerseysideStrongest: walkability A, hazard risk B+·lowest: health D−
83WolverhamptonWest Midlands · 234,029 people29.7bottom 10.4%D#19 of 35 in West MidlandsStrongest: walkability A−, schools B·lowest: safety D
84BirminghamWest Midlands · 1,121,367 people29.3bottom 9.6%D#21 of 35 in West MidlandsStrongest: walkability A, schools B·lowest: safety D−
85BasildonEssex · 115,935 people29.3bottom 9.6%D#77 of 81 in EssexStrongest: walkability A, hazard risk B·lowest: safety D−
86Stoke-on-TrentStaffordshire · 260,560 people28.8bottom 8.6%D#46 of 46 in StaffordshireStrongest: cost of living B+, walkability B·lowest: safety D−
87PortsmouthHampshire · 223,324 people28.5bottom 8.1%D#73 of 76 in HampshireStrongest: walkability A+, jobs & income C+·lowest: safety D
88NewportGwent · 130,882 people28.2bottom 7.5%D#26 of 38 in GwentStrongest: walkability B+, cost of living B−·lowest: safety D−
89SouthamptonHampshire · 249,633 people28.1bottom 7.4%D#74 of 76 in HampshireStrongest: walkability A+, jobs & income C+·lowest: safety D−
90LeicesterLeicestershire · 406,612 people26.3bottom 5.2%D#50 of 50 in LeicestershireStrongest: walkability A, schools B−·lowest: cost of living D−
91St HelensMerseyside · 107,684 people26.2bottom 5.0%D#22 of 25 in MerseysideStrongest: walkability B+, hazard risk C+·lowest: health D−
92LincolnLincolnshire · 104,553 people25.0bottom 4.0%D−#56 of 61 in LincolnshireStrongest: walkability A, cost of living C+·lowest: safety D
93NottinghamNottinghamshire · 299,786 people24.3bottom 3.6%D−#47 of 49 in NottinghamshireStrongest: walkability A+, schools C+·lowest: safety D−
94LiverpoolMerseyside · 506,564 people22.1bottom 1.9%D−#24 of 25 in MerseysideStrongest: walkability A+, hazard risk C+·lowest: health D−
95West BromwichWest Midlands · 103,099 people21.9bottom 1.7%D−#30 of 35 in West MidlandsStrongest: walkability A, hazard risk B−·lowest: safety D−
96BlackpoolLancashire · 149,087 people18.0bottom 0.3%D−#65 of 65 in LancashireStrongest: walkability A, cost of living C−·lowest: safety D−
Not ranked

Not on this list

4 towns have no overall grade: missing figures this grade needs. 6 towns have no overall grade: Greater Manchester Police doesn’t publish to police.uk, so no Safety Grade and no overall grade.

  • Aberdeen Aberdeen City · 192,968 people. missing figures this grade needs.
  • Bolton Greater Manchester · 184,077 people. Greater Manchester Police doesn’t publish to police.uk, so no Safety Grade and no overall grade.
  • Dundee Dundee City · 147,365 people. missing figures this grade needs.
  • Edinburgh City of Edinburgh · 493,794 people. missing figures this grade needs.
  • Glasgow Glasgow City · 617,904 people. missing figures this grade needs.
  • Manchester Greater Manchester · 470,395 people. Greater Manchester Police doesn’t publish to police.uk, so no Safety Grade and no overall grade.
  • Oldham Greater Manchester · 110,722 people. Greater Manchester Police doesn’t publish to police.uk, so no Safety Grade and no overall grade.
  • Rochdale Greater Manchester · 111,258 people. Greater Manchester Police doesn’t publish to police.uk, so no Safety Grade and no overall grade.
  • Salford Greater Manchester · 108,431 people. Greater Manchester Police doesn’t publish to police.uk, so no Safety Grade and no overall grade.
  • Stockport Greater Manchester · 117,925 people. Greater Manchester Police doesn’t publish to police.uk, so no Safety Grade and no overall grade.
Quick answers

Questions people ask

What is the best big town or city to live in?

Richmond upon Thames, London ranks first of 96 (A): walkability (A+) and schools (A+) are its strongest grades; hazard risk (C−) is its lowest. Sutton, London and Kingston upon Thames, London follow.

How are these towns ranked?

By the overall grade, which blends seven livability grades (cost of living, safety, schools, health, jobs & income, walkability, flood risk) from public data, each comparing a town with every UK town. How grades work.

Why isn’t my town on this list?

The list covers places of 100,000+ with an overall grade. Towns without one are counted above with the reason.

Sources: TownRatings grades: our own summary of the data, ranked against UK towns only. All under the Open Government Licence v3.0.

Contains public sector information licensed under the Open Government Licence v3.0. Contains HM Land Registry data © Crown copyright and database right 2026. Contains OS data © Crown copyright and database right 2026 (ONS boundaries). Northern Ireland: Source: NISRA; contains Land & Property Services data and Ordnance Survey of Northern Ireland information, © Crown copyright, licensed under the Open Government Licence v3.0. Scotland: contains National Records of Scotland data, Registers of Scotland data and SEPA data, © Crown copyright / © SEPA 2025, licensed under the Open Government Licence v3.0.