Guest, Sign inJoin
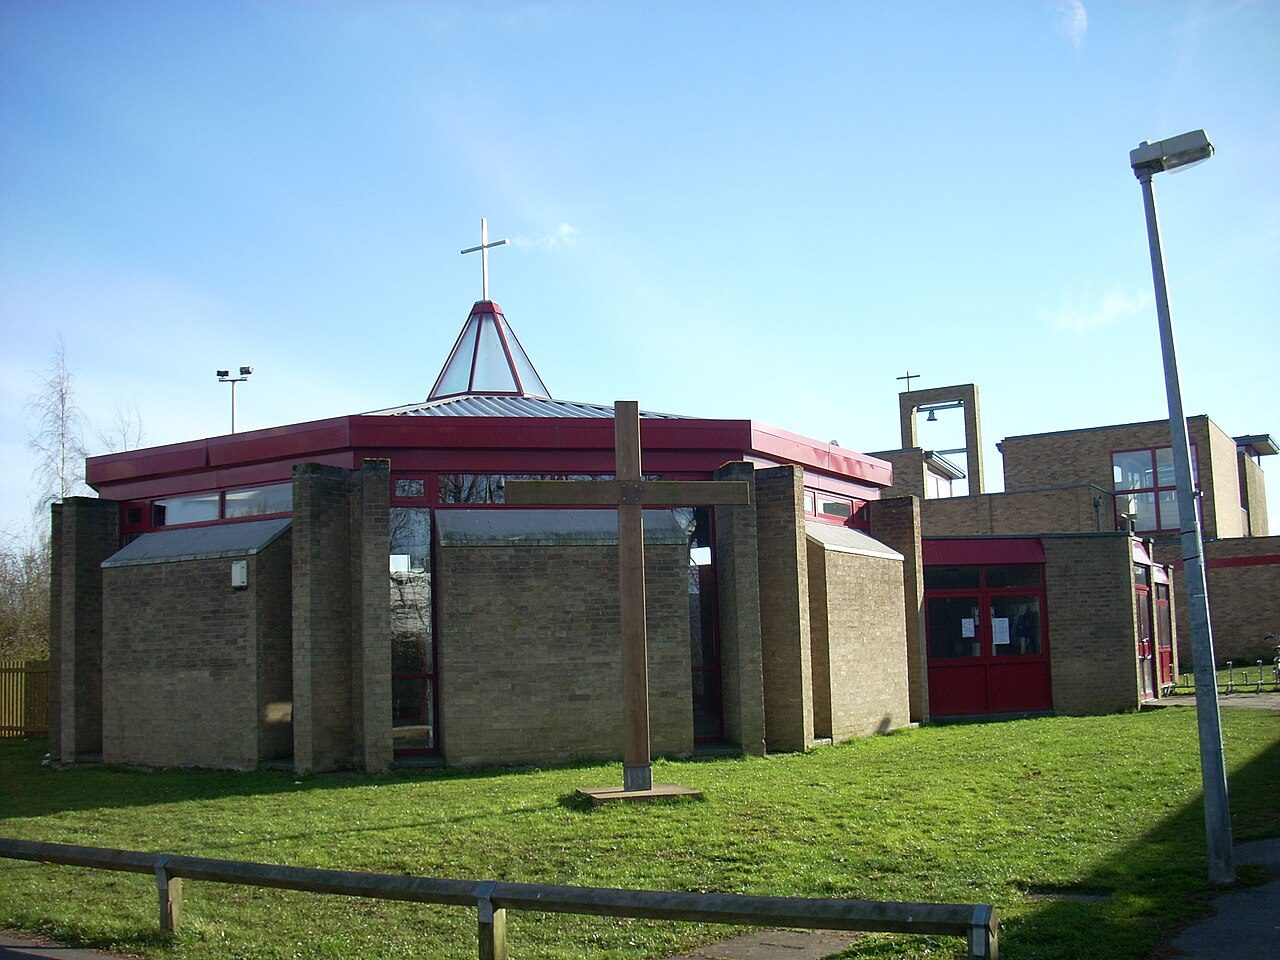
Bar Hill churchBar Hill, #1 on this list · Photo: Cruccone · CC BY 3.0
Cambridgeshire · 2026

Best places to live in Cambridgeshire

Bar Hill ranks first of 50 Cambridgeshire towns of 2,500+ residents, and #1 of 2,138 UK towns. 26 of the 50 grade A− or better; scores run from 87.4 down to 22.0.

The overall score, sorted within Cambridgeshire; the letter compares each town with every UK town, and its rank among UK towns sits beside it. How grades work

#1

Bar Hill

Cambridgeshire · 3,899 people
A+

Score 87.4·#1 of 2,138 UK towns

Strongest: health A+, jobs & income A+·lowest: hazard risk B+
#2

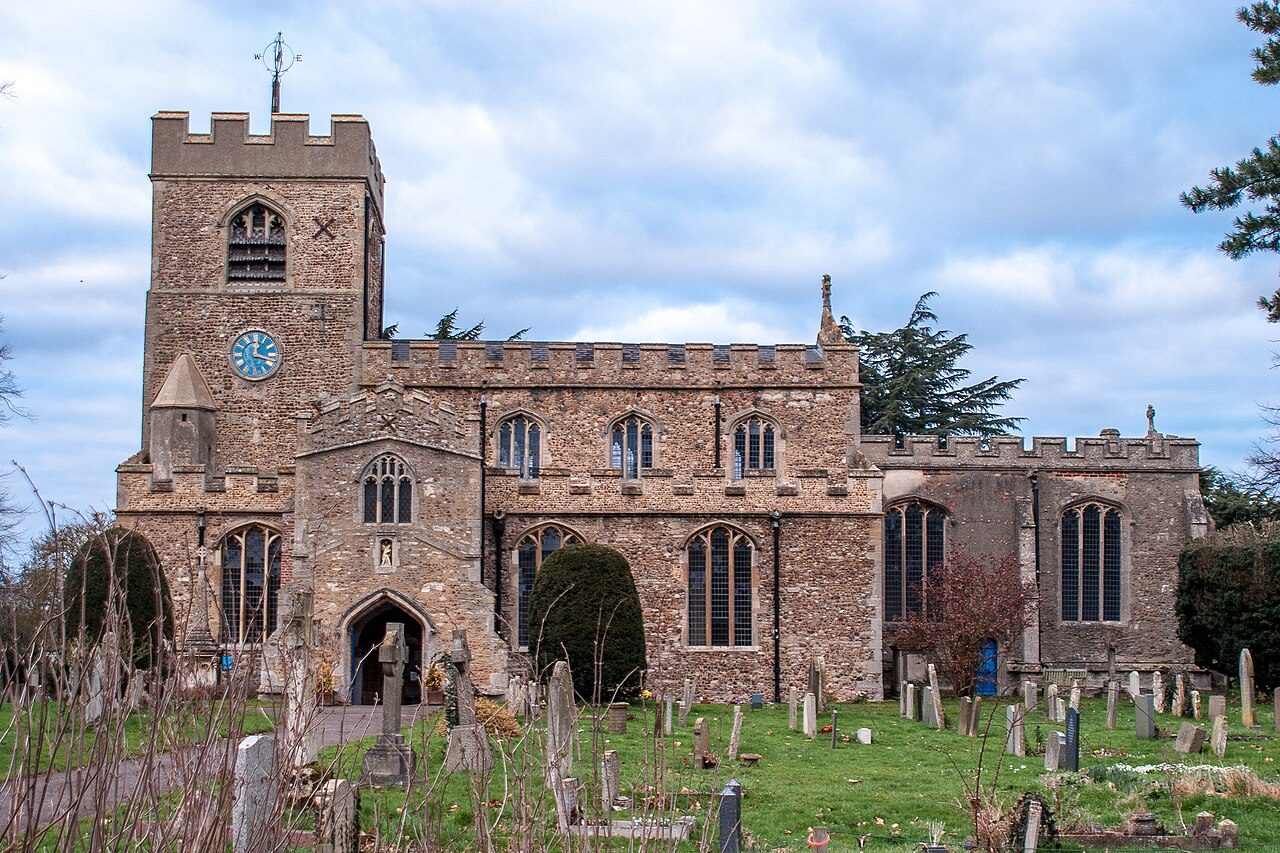
Girton

Cambridgeshire · 4,384 people
A+

Score 81.4·#3 of 2,138 UK towns

Strongest: jobs & income A+, health A+·lowest: hazard risk C−

#3

Great Shelford and Stapleford

Cambridgeshire · 6,159 people
A+

Score 78.5·#11 of 2,138 UK towns

Strongest: jobs & income A+, walkability A+·lowest: cost of living C+

All 50 towns, ranked

By overall score against UK towns; ranks are within Cambridgeshire, and each UK rank links to the national list. The score (0–100) blends the seven livability grades and sets the order; the letter places that score among UK towns of 2,500+, and A+ is the top 5%, so neighbours on the list often share a letter.

Every town in Cambridgeshire →

51 towns, 50 ranked.

#TownScoreGrade · UK rankWhat drives it
1Bar Hill3,899 people87.4top 0.1%A+#1 of 2,138 nationallyStrongest: health A+, jobs & income A+·lowest: hazard risk B+
2Girton4,384 people81.4top 0.2%A+#3 of 2,138 nationallyStrongest: jobs & income A+, health A+·lowest: hazard risk C−
3Great Shelford and Stapleford6,159 people78.5top 0.6%A+#11 of 2,138 nationallyStrongest: jobs & income A+, walkability A+·lowest: cost of living C+
4Milton4,150 people77.0top 1.3%A+#24 of 2,138 nationallyStrongest: health A+, walkability A+·lowest: hazard risk B
5Histon and Impington7,781 people75.7top 1.9%A+#39 of 2,138 nationallyStrongest: schools A+, walkability A+·lowest: safety B
6Hardwick2,658 people74.5top 2.3%A+#45 of 2,138 nationallyStrongest: health A+, jobs & income A·lowest: walkability B−
7Over2,898 people73.9top 2.5%A+#50 of 2,138 nationallyStrongest: safety A, jobs & income A·lowest: hazard risk C
8Linton4,452 people73.8top 2.6%A+#52 of 2,138 nationallyStrongest: health A, jobs & income A−·lowest: hazard risk C
9Burwell5,912 people73.1top 3.1%A+#64 of 2,138 nationallyStrongest: health A, schools A·lowest: walkability C
10Hemingford Grey3,372 people72.8top 3.3%A+#67 of 2,138 nationallyStrongest: health A, safety A·lowest: hazard risk D−
11Cambourne11,071 people71.3top 4.7%A+#97 of 2,138 nationallyStrongest: schools A, health A·lowest: safety B−
12Cottenham6,156 people69.2top 7.3%A#150 of 2,138 nationallyStrongest: schools A+, walkability A−·lowest: safety B−
13Ely19,185 people68.8top 7.8%A#161 of 2,138 nationallyStrongest: walkability A, health A−·lowest: safety C+
14Fulbourn3,737 people68.3top 8.5%A#175 of 2,138 nationallyStrongest: jobs & income A, walkability A·lowest: cost of living B−
15Bluntisham and Colne2,790 people65.0top 13.2%A#274 of 2,138 nationallyStrongest: safety A, health A−·lowest: walkability D
16Somersham3,349 people64.3top 14.2%A#295 of 2,138 nationallyStrongest: cost of living A, health A−·lowest: walkability C−
17Swavesey2,739 people64.0top 14.4%A#299 of 2,138 nationallyStrongest: jobs & income A, cost of living A−·lowest: hazard risk D−
18St Ives16,818 people63.6top 15.1%A−#315 of 2,138 nationallyStrongest: cost of living A, walkability A·lowest: hazard risk D−
19Waterbeach5,375 people63.6top 15.2%A−#316 of 2,138 nationallyStrongest: walkability A−, jobs & income A−·lowest: hazard risk C
20Little Paxton4,031 people63.2top 15.6%A−#324 of 2,138 nationallyStrongest: cost of living A, jobs & income A−·lowest: hazard risk C−
21Godmanchester7,714 people63.2top 15.6%A−#325 of 2,138 nationallyStrongest: cost of living A−, walkability B+·lowest: safety C+
22Longstanton and Northstowe5,278 people62.1top 17.6%A−#368 of 2,138 nationallyStrongest: jobs & income A, schools A−·lowest: hazard risk D−
23Sawston7,270 people62.0top 18.0%A−#377 of 2,138 nationallyStrongest: walkability A, jobs & income B+·lowest: hazard risk D
24Melbourn4,907 people61.4top 19.4%A−#405 of 2,138 nationallyStrongest: jobs & income A−, health A−·lowest: schools C−
25Sawtry5,870 people60.5top 21.8%A−#456 of 2,138 nationallyStrongest: cost of living A, health B+·lowest: schools C+
26Willingham3,912 people59.7top 23.5%A−#492 of 2,138 nationallyStrongest: cost of living A−, health B+·lowest: hazard risk C
27Fordham2,566 people58.5top 25.5%B+#535 of 2,138 nationallyStrongest: schools A, cost of living B+·lowest: walkability C−
28Papworth Everard3,821 people57.3top 27.9%B+#588 of 2,138 nationallyStrongest: cost of living A, jobs & income A−·lowest: schools D
29St Neots33,262 people56.6top 28.9%B+#609 of 2,138 nationallyStrongest: cost of living A, walkability A−·lowest: hazard risk C−
30Gamlingay2,920 people56.5top 29.3%B+#617 of 2,138 nationallyStrongest: hazard risk A, health A·lowest: schools D−
31Haddenham3,050 people56.4top 29.5%B+#621 of 2,138 nationallyStrongest: hazard risk A, cost of living A−·lowest: schools C−
32Cambridge152,742 people56.0top 30.5%B+#642 of 2,138 nationallyStrongest: walkability A+, jobs & income A·lowest: safety C−
33Sutton3,880 people55.9top 30.8%B+#649 of 2,138 nationallyStrongest: cost of living A, health B+·lowest: schools D
34Yaxley9,403 people55.3top 32.3%B+#681 of 2,138 nationallyStrongest: cost of living A+, jobs & income B·lowest: schools C
35Soham10,609 people55.2top 32.5%B+#685 of 2,138 nationallyStrongest: cost of living A, schools B−·lowest: health C+
36Warboys4,318 people55.2top 32.6%B+#686 of 2,138 nationallyStrongest: cost of living A, health B·lowest: walkability D
37Brampton6,585 people55.0top 33.0%B+#695 of 2,138 nationallyStrongest: cost of living A−, jobs & income A−·lowest: hazard risk D
38Fenstanton3,015 people54.4top 34.3%B+#722 of 2,138 nationallyStrongest: health A, cost of living A−·lowest: schools D−
39Buckden2,757 people52.3top 38.2%B#806 of 2,138 nationallyStrongest: cost of living A−, safety B·lowest: schools D
40Huntingdon25,603 people45.0bottom 45.5%B−#1,158 of 2,138 nationallyStrongest: walkability A+, cost of living A·lowest: safety D
41Littleport9,170 people38.5bottom 30.7%C#1,475 of 2,138 nationallyStrongest: cost of living A, walkability B−·lowest: hazard risk D
42Ramsey5,727 people37.1bottom 26.9%C#1,557 of 2,138 nationallyStrongest: cost of living A, walkability B−·lowest: hazard risk D
43Peterborough190,592 people37.0bottom 26.2%C#1,572 of 2,138 nationallyStrongest: walkability A−, cost of living A−·lowest: safety D
44Eye5,419 people35.6bottom 22.5%C−#1,653 of 2,138 nationallyStrongest: cost of living B+, safety C+·lowest: schools D
45Chatteris11,022 people30.0bottom 10.5%D#1,911 of 2,138 nationallyStrongest: safety B−, walkability C+·lowest: schools D
46Whittlesey13,833 people27.6bottom 6.8%D#1,991 of 2,138 nationallyStrongest: walkability B−, health C·lowest: schools D
47Doddington and Wimblington4,279 people26.9bottom 5.7%D#2,015 of 2,138 nationallyStrongest: safety B−, jobs & income C·lowest: hazard risk D
48March21,345 people24.3bottom 3.6%D−#2,061 of 2,138 nationallyStrongest: walkability B+, cost of living C+·lowest: schools D−
49Manea2,638 people23.8bottom 3.3%D−#2,066 of 2,138 nationallyStrongest: safety B−, health C−·lowest: hazard risk D−
50Wisbech26,800 people22.0bottom 1.8%D−#2,099 of 2,138 nationallyStrongest: walkability A, cost of living B−·lowest: hazard risk D−
–Wittering Garrison town2,678 people77.9top 0.8%A+Strongest: walkability A, schools A·lowest: safety B

Military garrison towns and university campuses keep their grades but aren’t ranked: most residents serve in the forces or are students.

Quick answers

Questions people ask

What is the best place to live in Cambridgeshire?

Bar Hill ranks first of 50 graded towns of 2,500+: health (A+) and jobs & income (A+) are its strongest grades; hazard risk (B+) is its lowest. Girton and Great Shelford and Stapleford follow.

How are these towns ranked?

By the overall grade, which blends seven livability grades (cost of living, safety, schools, health, jobs & income, walkability, hazard risk) from public data, each comparing a town with every UK town. The rank is within Cambridgeshire. How grades work.

Why isn’t my town on this list?

The list covers places of 2,500+ residents with an overall grade. Smaller places, and towns missing figures the overall grade needs, show their subject grades on their own pages; every town in Cambridgeshire is listed on the county page.

County by county

Best places to live, county by county

Sources: TownRatings grades: our own summary of the data, ranked against UK towns only. All under the Open Government Licence v3.0.

Contains public sector information licensed under the Open Government Licence v3.0. Contains HM Land Registry data © Crown copyright and database right 2026. Contains OS data © Crown copyright and database right 2026 (ONS boundaries). Northern Ireland: Source: NISRA; contains Land & Property Services data and Ordnance Survey of Northern Ireland information, © Crown copyright, licensed under the Open Government Licence v3.0. Scotland: contains National Records of Scotland data, Registers of Scotland data and SEPA data, © Crown copyright / © SEPA 2025, licensed under the Open Government Licence v3.0.