Guest, Sign inJoin
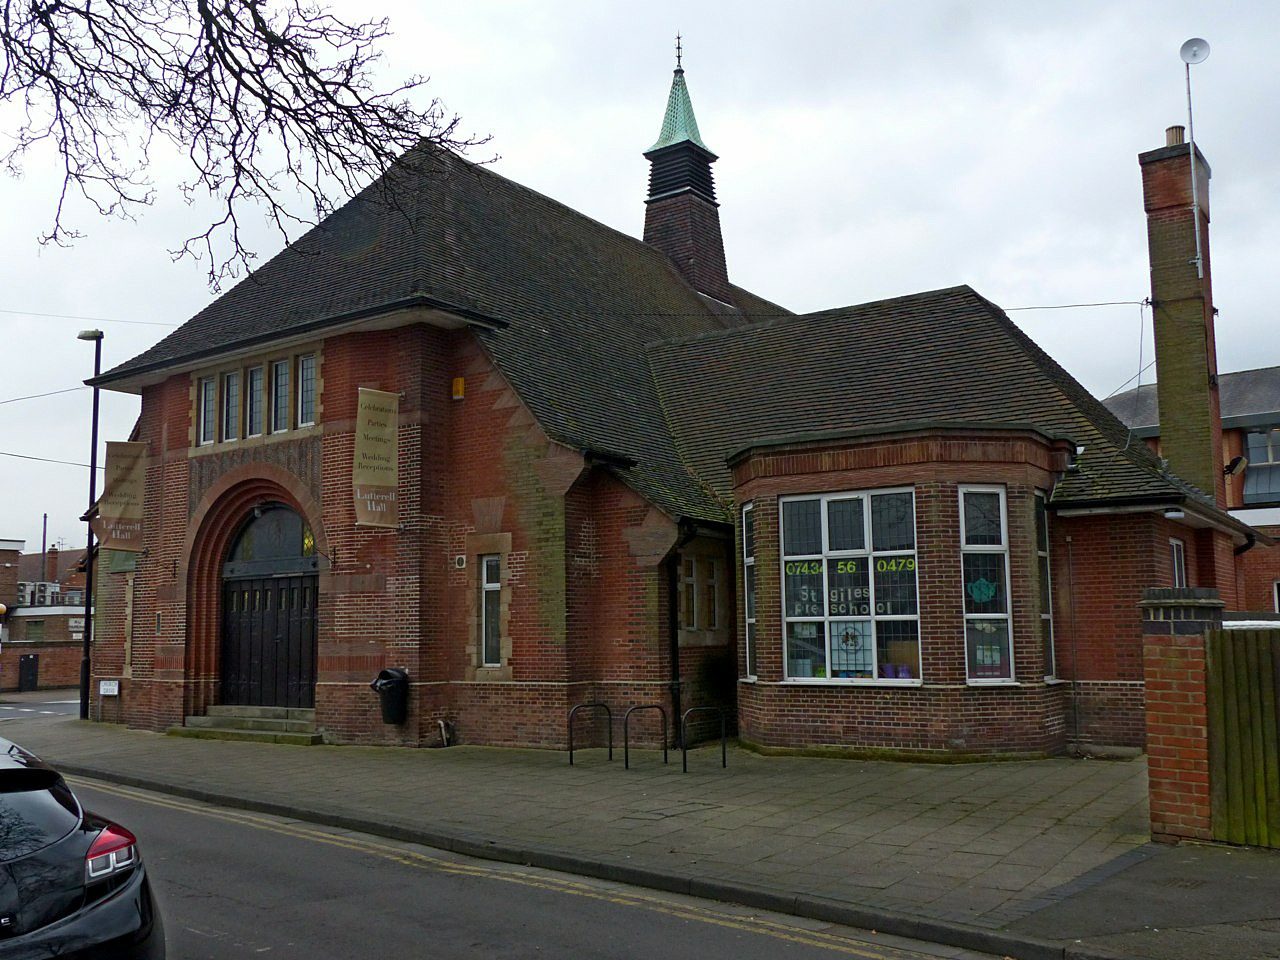
Lutterell Hall, Church Street, West BridgfordWest Bridgford, #1 on this list · Photo: Alan Murray-Rust · CC BY-SA 2.0
Nottinghamshire · 2026

Best places to live in Nottinghamshire

West Bridgford ranks first of 49 Nottinghamshire towns of 2,500+ residents, and #4 of 2,138 UK towns. 12 of the 49 grade A− or better; scores run from 80.8 down to 22.1.

The overall score, sorted within Nottinghamshire; the letter compares each town with every UK town, and its rank among UK towns sits beside it. How grades work

#1

West Bridgford

Nottinghamshire · 36,489 people
A+

Score 80.8·#4 of 2,138 UK towns

Strongest: schools A+, jobs & income A+·lowest: hazard risk C

#2

Keyworth

Nottinghamshire · 6,822 people
A+

Score 80.4·#5 of 2,138 UK towns

Strongest: cost of living A, health A·lowest: jobs & income B

#3

East Leake

Nottinghamshire · 8,551 people
A+

Score 77.0·#26 of 2,138 UK towns

Strongest: cost of living A, health A·lowest: hazard risk B−

All 49 towns, ranked

By overall score against UK towns; ranks are within Nottinghamshire, and each UK rank links to the national list. The score (0–100) blends the seven livability grades and sets the order; the letter places that score among UK towns of 2,500+, and A+ is the top 5%, so neighbours on the list often share a letter.

Every town in Nottinghamshire →

49 towns.

#TownScoreGrade · UK rankWhat drives it
1West Bridgford36,489 people80.8top 0.2%A+#4 of 2,138 nationallyStrongest: schools A+, jobs & income A+·lowest: hazard risk C
2Keyworth6,822 people80.4top 0.3%A+#5 of 2,138 nationallyStrongest: cost of living A, health A·lowest: jobs & income B
3East Leake8,551 people77.0top 1.3%A+#26 of 2,138 nationallyStrongest: cost of living A, health A·lowest: hazard risk B−
4Bingham10,109 people76.4top 1.7%A+#34 of 2,138 nationallyStrongest: cost of living A, schools A·lowest: safety B−
5Radcliffe on Trent7,205 people72.4top 3.8%A+#77 of 2,138 nationallyStrongest: cost of living A, schools A·lowest: hazard risk C−
6Ruddington7,491 people72.0top 4.1%A+#84 of 2,138 nationallyStrongest: schools A, cost of living A·lowest: safety B−
7Edwalton4,762 people70.1top 6.1%A#126 of 2,138 nationallyStrongest: schools A, hazard risk A·lowest: safety C+
8Collingham2,870 people70.0top 6.2%A#127 of 2,138 nationallyStrongest: schools A+, safety A·lowest: hazard risk C−
9Southwell7,405 people69.9top 6.6%A#137 of 2,138 nationallyStrongest: schools A+, health A−·lowest: cost of living C
10Ravenshead5,370 people64.4top 14.1%A#292 of 2,138 nationallyStrongest: safety A+, jobs & income A·lowest: walkability D
11Cotgrave7,794 people62.4top 16.8%A−#351 of 2,138 nationallyStrongest: cost of living A+, schools A·lowest: health C
12Beeston52,359 people58.9top 24.6%A−#516 of 2,138 nationallyStrongest: walkability A+, schools A·lowest: hazard risk C+
13Farnsfield3,217 people55.8top 31.1%B+#655 of 2,138 nationallyStrongest: hazard risk A, safety A−·lowest: walkability D
14Wilford4,849 people55.6top 31.6%B+#665 of 2,138 nationallyStrongest: schools A+, jobs & income A·lowest: hazard risk D−
15Arnold40,016 people55.1top 32.8%B+#690 of 2,138 nationallyStrongest: walkability A−, schools B+·lowest: health C+
16Carlton53,555 people54.7top 33.7%B+#709 of 2,138 nationallyStrongest: schools A−, walkability A−·lowest: hazard risk D
17Nuthall and Watnall9,581 people53.6top 35.6%B#751 of 2,138 nationallyStrongest: hazard risk A, safety B+·lowest: schools C+
18Balderton12,876 people50.1top 42.7%B#904 of 2,138 nationallyStrongest: cost of living B+, walkability B·lowest: hazard risk C−
19Edwinstowe5,327 people50.0top 42.8%B#906 of 2,138 nationallyStrongest: schools B, safety B·lowest: health C−
20Kimberley4,467 people49.9top 43.3%B#916 of 2,138 nationallyStrongest: hazard risk A, walkability B+·lowest: safety C+
21Brinsley and Underwood4,514 people49.8top 43.5%B#921 of 2,138 nationallyStrongest: safety A−, hazard risk B+·lowest: walkability D
22Bilsthorpe3,490 people47.8top 48.0%B−#1,018 of 2,138 nationallyStrongest: cost of living A−, schools B·lowest: hazard risk C−
23Stapleford15,041 people45.6bottom 47.1%B−#1,124 of 2,138 nationallyStrongest: walkability A−, schools B+·lowest: hazard risk D
24Blidworth4,295 people45.0bottom 45.3%B−#1,161 of 2,138 nationallyStrongest: hazard risk A, cost of living A·lowest: health D
25Calverton7,318 people44.4bottom 43.7%C+#1,197 of 2,138 nationallyStrongest: walkability B, cost of living B−·lowest: hazard risk C−
26Rainworth7,990 people43.4bottom 41.3%C+#1,249 of 2,138 nationallyStrongest: cost of living A, schools A−·lowest: health D
27Carlton in Lindrick5,460 people43.0bottom 40.3%C+#1,269 of 2,138 nationallyStrongest: schools A, cost of living B·lowest: jobs & income D
28Harworth and Bircotes8,885 people39.6bottom 33.0%C#1,426 of 2,138 nationallyStrongest: schools B+, cost of living B+·lowest: jobs & income D
29Worksop43,435 people39.3bottom 32.2%C#1,443 of 2,138 nationallyStrongest: cost of living B+, walkability B·lowest: safety D
30Annesley Woodhouse6,162 people38.2bottom 29.6%C#1,498 of 2,138 nationallyStrongest: hazard risk A, cost of living B−·lowest: health C−
31Jacksdale and Westwood2,758 people38.1bottom 29.3%C#1,506 of 2,138 nationallyStrongest: safety B, cost of living B−·lowest: jobs & income C−
32Eastwood18,890 people37.8bottom 28.5%C#1,523 of 2,138 nationallyStrongest: walkability B, cost of living B·lowest: health C−
33Tuxford2,810 people37.6bottom 28.0%C#1,533 of 2,138 nationallyStrongest: cost of living B+, health B−·lowest: jobs & income D
34Forest Town19,015 people36.6bottom 25.2%C#1,595 of 2,138 nationallyStrongest: hazard risk A, safety B−·lowest: walkability C−
35New Ollerton and Ollerton10,870 people36.6bottom 25.1%C#1,597 of 2,138 nationallyStrongest: cost of living A−, hazard risk B·lowest: health D
36Newark-on-Trent29,755 people35.6bottom 22.5%C−#1,652 of 2,138 nationallyStrongest: walkability A+, cost of living A−·lowest: safety D
37Hucknall35,848 people34.2bottom 18.7%C−#1,734 of 2,138 nationallyStrongest: walkability B+, schools B−·lowest: health C−
38Selston6,278 people33.6bottom 17.3%C−#1,764 of 2,138 nationallyStrongest: hazard risk A, safety B−·lowest: health D
39Retford23,735 people33.5bottom 17.2%C−#1,767 of 2,138 nationallyStrongest: cost of living B+, walkability B+·lowest: hazard risk D
40Langold2,603 people32.3bottom 14.5%D#1,824 of 2,138 nationallyStrongest: hazard risk A, cost of living B+·lowest: jobs & income D
41Clifton22,936 people32.0bottom 13.8%D#1,841 of 2,138 nationallyStrongest: walkability A+, schools B+·lowest: health D
42Kirkby-in-Ashfield21,262 people31.8bottom 13.5%D#1,847 of 2,138 nationallyStrongest: hazard risk B, walkability B·lowest: health D
43Mansfield Woodhouse19,521 people30.9bottom 12.1%D#1,877 of 2,138 nationallyStrongest: hazard risk A, walkability C+·lowest: health D
44Huthwaite5,069 people29.5bottom 10.0%D#1,923 of 2,138 nationallyStrongest: hazard risk A, cost of living B−·lowest: health D
45Sutton in Ashfield36,435 people27.6bottom 6.8%D#1,992 of 2,138 nationallyStrongest: hazard risk A, walkability B+·lowest: health D
46Stanton Hill and Skegby4,568 people26.1bottom 4.9%D−#2,032 of 2,138 nationallyStrongest: hazard risk B+, walkability C+·lowest: jobs & income D
47Nottingham299,786 people24.3bottom 3.6%D−#2,060 of 2,138 nationallyStrongest: walkability A+, schools C+·lowest: safety D−
48Mansfield63,448 people24.1bottom 3.5%D−#2,063 of 2,138 nationallyStrongest: walkability B, hazard risk B−·lowest: safety D−
49Market Warsop6,970 people22.1bottom 2.0%D−#2,094 of 2,138 nationallyStrongest: hazard risk A, walkability B−·lowest: health D−
Quick answers

Questions people ask

What is the best place to live in Nottinghamshire?

West Bridgford ranks first of 49 graded towns of 2,500+: schools (A+) and jobs & income (A+) are its strongest grades; hazard risk (C) is its lowest. Keyworth and East Leake follow.

How are these towns ranked?

By the overall grade, which blends seven livability grades (cost of living, safety, schools, health, jobs & income, walkability, hazard risk) from public data, each comparing a town with every UK town. The rank is within Nottinghamshire. How grades work.

Why isn’t my town on this list?

The list covers places of 2,500+ residents with an overall grade. Smaller places, and towns missing figures the overall grade needs, show their subject grades on their own pages; every town in Nottinghamshire is listed on the county page.

County by county

Best places to live, county by county

Sources: TownRatings grades: our own summary of the data, ranked against UK towns only. All under the Open Government Licence v3.0.

Contains public sector information licensed under the Open Government Licence v3.0. Contains HM Land Registry data © Crown copyright and database right 2026. Contains OS data © Crown copyright and database right 2026 (ONS boundaries). Northern Ireland: Source: NISRA; contains Land & Property Services data and Ordnance Survey of Northern Ireland information, © Crown copyright, licensed under the Open Government Licence v3.0. Scotland: contains National Records of Scotland data, Registers of Scotland data and SEPA data, © Crown copyright / © SEPA 2025, licensed under the Open Government Licence v3.0.